115 Marlin Ter · Centerville, GA
Flood risk 1/10 · Minimal
- FEMA flood zone
- X (unshaded)
- Chance of flooding over 30 yrs
- 0.0%
- Est. flood insurance / yr
- $507 – $1,088
Fire risk 4/10 · Minor
- Est. fire insurance / yr
- $963 – $1,789
Heat risk 7/10 · Major
- Hot days now (above 108°F)
- 7 days/yr
- Hot days in 30 yrs
- 18 days/yr
Wind risk 7/10 · Major
- Chance of severe wind over 30 yrs
- 78.0%
Air-quality risk 3/10 · Minor
- Unhealthy air days now
- 2 days/yr
- Unhealthy air days in 30 yrs
- 3 days/yr
Risk factors via First Street. Map © Google.
Why this score? — see what drove the B grade
The composite is a weighted blend of 9 inputs, each scored 0–100. Each bar is that input's sub-score; the figure is the points it added to the 100-point composite (weight × sub-score).
- Cash flow +30.0/30.0
- 1% rule +10.0/10.0
- DSCR +10.0/10.0
- ARV discount +7.5/15.0
- Schools +3.9/10.0
- Livability +3.7/5.0
- Rent growth +2.5/5.0
- Condition / age +2.5/5.0
- Appreciation +0.0/10.0
$60,000
🖨 Deal sheet 📄 Offer letter ✓ Due diligence
Listing remarks
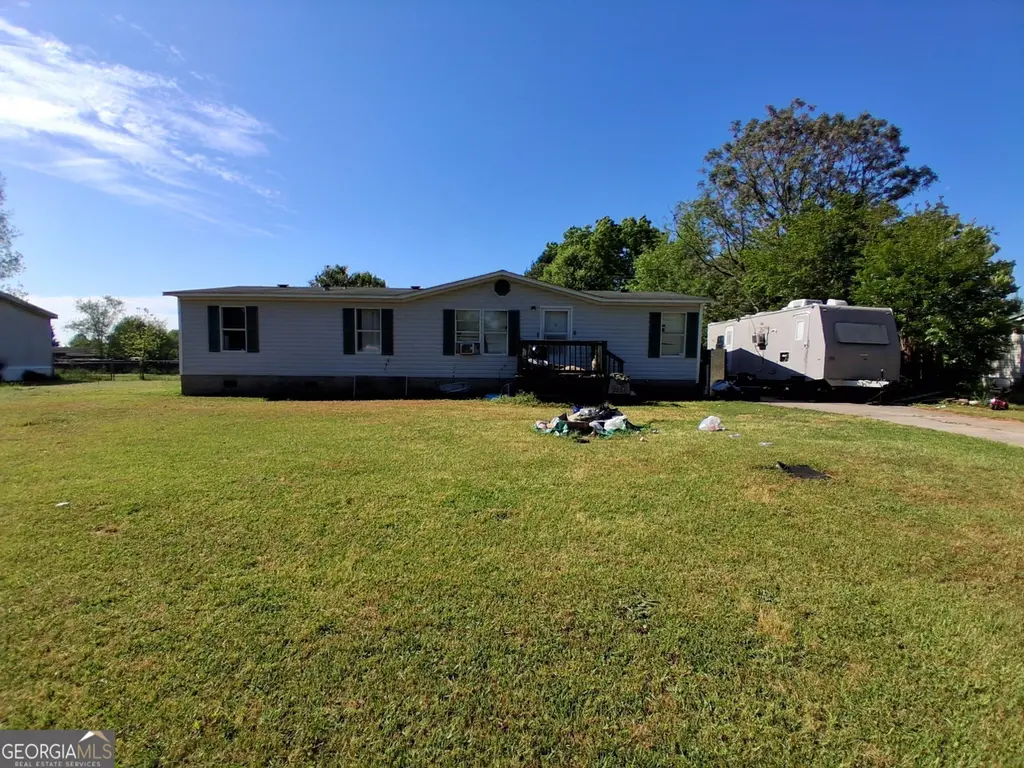
Investor special in Byron, GA! This 3-bedroom, 2-bath double wide mobile home presents strong potential for the right buyer. The property needs work but provides a great opportunity for a flip, rental, or value-add project. Features a spacious layout and is conveniently located with easy access to local amenities and I-75.
Key facts
- Spacious layout
- Conveniently located
- 0.34 acre lot
Tags
Property features AI
Finance
- Other: Lot size approximately 0.34 acres; Subdivision: HIDDEN COVE; Located at 115 Marlin Terrace, Byron, GA 31008
- Financial info: Cash offers only
- HOA & community: No HOA; No association fees
Exterior
- Parking: Off-street parking for 2 vehicles
- Utilities: Public water; Septic tank sewer; Other utilities
- Home design: Residential property; Manufactured home / Single family residence; Manufactured house structure; Built in 1997; Facing/entry level: One level
- Construction: Block construction; Composition roof
- Exterior features: Other exterior features; Lot includes other features
Interior
- Kitchen: Dishwasher
- Bedrooms: 3 bedrooms on the main level
- Flooring: Other flooring
- Bathrooms: 2 full bathrooms on the main level
- Heating & cooling: Central heating; Central air conditioning; Has heating and cooling
- Interior features: One-level living; Owner-provided living area measurement; No basement; Other interior features
- Laundry & utility: Laundry: Other
Neighborhood map
What this means for you Summary
Snapshot
- This is a 3-bed/2.5-bath other listed at $60k.
Deal economics
- At list price, monthly cash flow is $926 ($11k/yr) — positive.
- The deal already cash-flows at list — no discount required.
- Meets the 1% rule at list price ($2k rent vs $60k).
- Cap rate 24.8% vs local median 5.8% in Centerville — top-decile yield for the area; either an underpriced asset or a hidden risk that comps aren't pricing in. Stress-test before assuming the spread holds.
Location & tenants
- Location reads 73/100 on livability (#56 in GA) — a middle-class / working-renter tenant base. Strengths: cost of living A+, housing A+, health & safety A-; Watch: amenities F, commute F.
- Houston County (urban): math 43% / reading 46% proficiency, ranked #23 of 174 in GA (top 13%) — families likely to look elsewhere, expect single-tenant / working-renter base with shorter leases.
- Zoned schools: Eagle Springs Elementary (math 45% / reading 47%, grade D-, #316 of 1,228 statewide, top 26%, 704 students, 66% FRL); Thomson Middle School (math 29% / reading 34%, grade F, #234 of 470 statewide, top 50%, 736 students, 84% FRL); Northside High School (math 5% / reading 21%, grade F, #331 of 424 statewide, top 78%, 1,959 students, 84% FRL) — zoned schools average 78% FRL vs 46% district-wide (32 pts higher); higher-poverty schools than district average — tighter screening recommended.
- Zoned-school proficiency averages 30% at this address vs 44% district-wide (-14 pts) — the specific schools serving this property underperform the Houston County average; the district grade overstates school quality for this exact location.
- Market conditions: 205 active listings in the ZIP; 7 comparable units currently listed for rent nearby; rentals at typical pace (median 21d on market — plan ~3-4 weeks tenant-placement turnaround); 43% of comp listings sitting > 30 days — soft ceiling on asking rent; 1,545 units permitted in Houston County in 2024 (336 in 5+ unit buildings).
Forward outlook
- Local home prices are declining (-3.0%/yr); year-one equity from $415 of loan paydown is wiped out by about $2k of value loss. Plan a longer hold.
- Houston County population projected at +22% by 2050 — long-run rental-demand tailwind backs the buy-and-hold thesis.
- At projected returns (-3.0% appreciation + 3.0% rent growth), your $17k cash investment doubles in ~2 years — after that, you're playing with house money.
Negotiation context
- Only 1 days on market — expect competitive offers; lowballing is unlikely to land.
Risks & watch-outs
- Climate carrying-cost: major wind risk, 78% chance of damaging wind over 30y; extreme-heat days projected 7→18/yr by 2055 (HVAC capex compounding) — expect insurance premiums to compound above CPI over the hold.
Questions for the listing agent
- Is there a deadline driving the sale (1031 exchange, divorce, estate, relocation)? That informs how much negotiation room exists.
- What's the average days-on-market for RENTAL listings here right now (not sales)? A rising rental-DOM trend means longer vacancies and softer asking-rent achievability than the comps imply.
- What's the recent tenant-quality profile in this submarket — average credit score on applications, eviction rate, late-payment / NSF rate, and stable-employment percentage? A property-management company in the area should have these aggregated.
- How much new for-sale + rental construction is in the pipeline within 1–3 miles? Heavy new supply typically softens prices + rents 12–24 months out; constrained supply supports both.
Investment metrics
- 1% rule
- 2.76% ✓
- Cap rate
- 24.81%
- Cash-on-cash
- 66.12%
- DSCR
- 3.94
- GRM
- 3.0
CMA / ARV
No comps found within radius.
Projected returns pro-forma
-3.0% appreciation · 3.0% rent growth · sell at horizon
- IRR
- 65.4%
- Equity multiple
- 3.93×
- Total profit
- $49,238
- Equity at exit
- $8,946
- IRR
- 69.7%
- Equity multiple
- 8.07×
- Total profit
- $118,815
- Equity at exit
- $5,188
Cash invested: $16,800 (down + closing). Projections, not guarantees.
Landlord ↔ Tenant lean methodology
- Overall (STATE)
- 90 Strongly Landlord-Friendly
- State Georgia
- 90 Strongly Landlord-Friendly · R+3
- County
- — inherits STATE
- City
- — inherits STATE
ZIP-level market 31008
- Home prices YoY
- -18.1%
- Active inventory
- 205
- Price-to-rent
- 3.0×
Monthly cashflow live
- Estimated rent
- $1,659 high interval (Pro) →
- Mortgage (P&I)
- −$315
- Tax from tax record
- −$45 /mo · $544/yr
- Insurance
- −$25
- HOA
- −$0
- Vacancy / Maint / Mgmt
- −$348
- Net cashflow
- $926
Break-even live
UW: 25.0% down · 7.5% · 30yr · 1.5% tax · 5.0% vac · 8.0% maint · 8.0% mgmt
Financing live
Cash to close
- Down payment
- $15,000
- Closing costs
- $1,800
- Reserves months
- —
- Total cash needed
- —
Loan-product check · same deal, 3 products live
Conventional
25% down · 7.5% · 30yr
- Down + closing
- —
- Monthly P&I
- —
- Monthly cashflow
- —
- DSCR
- —
- Eligible?
- —
Personal DTI + credit; lowest rate.
DSCR
20% down · 8.5% · 30yr
- Down + closing
- —
- Monthly P&I
- —
- Monthly cashflow
- —
- DSCR
- —
- Eligible?
- —
No personal income docs; deal must DSCR.
Hard money
10% down · 12.0% · 12mo
- Down + closing
- —
- Monthly P&I
- —
- Monthly cashflow
- —
- DSCR
- —
- Eligible?
- —
Short-term bridge; refi at stabilization.
Rent comps 7 comps
| Address | Beds | Baths | Sqft | Rent | $/sqft | DOM | Units | Dist |
|---|---|---|---|---|---|---|---|---|
| 1280 Dunbar Rd Warner Robins, GA | 2.0–4.0 | 2.0 | 1235 | $2,052 | $1.66 | 13d | 11 | 0.87mi |
| 308 Silver Maple Ln Warner Robins, GA | 4.0 | 2.5 | 1865 | $2,095 | $1.12 | 43d | 1 | 0.87mi |
| 15 Michelle Dr Byron, GA | 3.0 | 2.0 | 1248 | $1,195 | $0.96 | 13d | 1 | 0.92mi |
| 111 Brighton Dr Byron, GA | 3.0 | 2.0 | 1782 | $1,400 | $0.79 | 20d | 1 | 1.04mi |
| 111 Brighton Dr Byron, GA | 3.0 | 2.0 | 1782 | $1,500 | $0.84 | 43d | 1 | 1.04mi |
| 302 Timberwind Dr Byron, GA | 3.0 | 2.0 | 1449 | $1,500 | $1.04 | 13d | 1 | 1.26mi |
| 121 Limestone Trl Warner Robins, GA | 3.0 | 2.0 | 1719 | $1,850 | $1.08 | 43d | 1 | 1.36mi |
Listing history 4 events
-
2026-04-10status Under Contract
-
2026-04-09$60,000 New
-
2002-04-23soldstatus $85,000
-
1997-03-21soldstatus $15,500
ⓘ Source: listings_history table (triggers on properties + properties_extension) + one-shot
backfill from property_details.listing_events for pre-trigger history.
Tax reassessment forecast GA · Resets to sale price
- Current annual tax
- $544 · $45/mo
- Projected year-2 tax
- $552 · $46/mo
- Expected delta
- +$8/yr (+$1/mo · 1.5%)
ⓘ Screening estimate from a state-policy table — verify with the county assessor before closing.
Climate risk First Street
- Flood 1/10 Low FEMA zone X (unshaded) · 0% chance over 30 yrs
- Wildfire 4/10 Moderate
- Heat 7/10 Severe 7 d/yr ≥108°F today · 18 d/yr by 30 yrs out
- Wind 7/10 Severe 78% chance of damaging wind over 30 yrs
- Air quality 3/10 Moderate 2 unhealthy d/yr today · 3 by 30 yrs out
Nearby sold comps map
Loading sold comps map…
Walkable amenities ~0.75 mi
Loading nearby amenities…
Taxation est. · year 1
- Rental income
- $19,908
- − Mortgage interest
- −$3,361
- − Property taxes
- −$544
- − Insurance
- −$300
- − Repairs & maintenance
- −$1,593
- − Management
- −$1,593
- − Depreciation
- −$1,745
- Taxable income
- $10,772
- Est. tax owed @ 24.0%
- −$2,585
- After-tax cash flow
- $8,522/yr
For passive investors: Depreciation is non-cash, so a rental often shows a tax loss while cash-flowing — sheltering income. Rental losses are passive: they offset passive income freely, and up to $25,000/yr can offset ordinary (W-2) income if you actively participate and your MAGI is under $100k (phasing out to $0 by $150k); unused losses carry forward. On sale, claimed depreciation is recaptured at up to 25%, and gains may owe capital-gains tax (a 1031 exchange can defer both). Figures are a year-1 estimate at your 24.0% rate — not tax advice; consult a CPA.
Schools (NCES district)
- District
- Houston County
- NCES district ID
- 1302880
- Math proficiency
- 43% ▼ -7.00%
- Reading proficiency
- 46% ▼ -2.00%
- Median HH income
- $54,823
- Composite
- 38.68/100
- National rank
- #4144
- State rank
- #23 of 174 in GA
Livability — Centerville
- Score
- 73/100
- State rank
- #56
- US rank
- #5374
Category grades
Schools grade is shown separately in the Schools card above.
Census & demographics
- City population
- 6,312
- Population (ZIP)
- 20,882
Population outlook (Houston County) Hauer SSP2
- Today (2025)
- 169,502 people
- By 2030
- 178,486 · +5.3%
- By 2040
- 194,642 · +14.8%
- By 2050
- 207,119 · +22.2%
- By 2075
- 231,480 · +36.6%
- By 2100
- 235,034 · +38.7%
Race, ethnicity, and origin ACS 2023
- Neighborhood character
- Majority White (61%)
- Race & ethnicity
- White 61% Black 27% Two or more races 7% Hispanic / Latino 6%
- Hispanic origin (detail)
- Mexican 3% Puerto Rican 2%
- Common ancestry
- Slovak 2% Serbian 1% Lithuanian 1%
- Foreign-born
- 2% · Canada
- Languages at home
- 95% English-only · Spanish 4%
Political lean MEDSL · Houston
- 2024 margin
- R (+11.3) · D 44.0% · R 55.3%
- 2008→2024 swing
- +8.9pp toward D · 2008: -20.2pp · 2024: -11.3pp
- All cycles
- 2024: R+11.3 2020: R+12.4 2016: R+21.6 2012: R+20.7 2008: R+20.2
Not yet ingested
- Civics
- —
Market trends
- HPI YoY
- ▼ -45.93%
- Current HPI
- 208.0889
- Rent YoY
- —
- Metro
- —
- State GDP YoY
- ▲ 2.66%
- F500 in state
- 28
Industry mix (Fortune 500 HQ in GA)
| Industry | F500 HQs | Revenue |
|---|---|---|
| Paper / Packaging | 2 | $29B |
|
||
| Retail | 1 | $160B |
|
||
| Transportation / Logistics | 1 | $91B |
|
||
| Airlines | 1 | $62B |
|
||
| Consumer Goods | 1 | $47B |
|
||
| Utilities | 1 | $25B |
|
||
Price history
+287.1% since first listed4 events — show timeline
- 2026-04-10 Pending — GAMLS
- 2026-04-09 Listed $60,000 GAMLS
- 2002-04-23 Sold (Public Records) $85,000 Public Records
- 1997-03-21 Sold (Public Records) $15,500 Public Records
Property tax history
+4.0%/yrLatest (2025): $544 · +2.1% YoY. Source: county tax records.
Cash-flow waterfall
monthlySold comps — $/sqft
last 12 mo · ≤1 miLoading sold comps…