 🏗️ New Construction
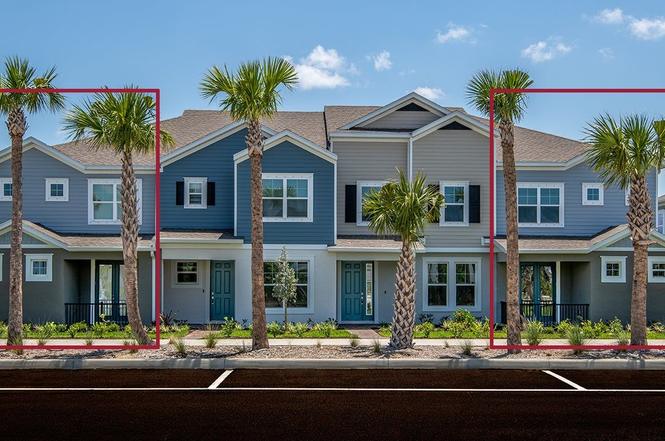
Adams Plan · North Fort Myers, FL
Flood risk No data
- FEMA flood zone
- —
- Chance of flooding over 30 yrs
- %
- Est. flood insurance / yr
- —
Fire risk No data
- Est. fire insurance / yr
- —
Heat risk No data
- Hot days now (above °F)
- days/yr
- Hot days in 30 yrs
- days/yr
Wind risk No data
- Chance of severe wind over 30 yrs
- %
Air-quality risk No data
- Unhealthy air days now
- days/yr
- Unhealthy air days in 30 yrs
- days/yr
Risk factors via First Street. Map © Google.
Why this score? — see what drove the C grade
The composite is a weighted blend of 9 inputs, each scored 0–100. Each bar is that input's sub-score; the figure is the points it added to the 100-point composite (weight × sub-score).
- Cash flow +21.2/30.0
- ARV discount +7.5/15.0
- DSCR +6.8/10.0
- 1% rule +6.0/10.0
- Schools +4.6/10.0
- Livability +3.7/5.0
- Rent growth +3.5/5.0
- Condition / age +2.5/5.0
- Appreciation +2.4/10.0
$345,990
🖨 Deal sheet 📄 Offer letter ✓ Due diligence
Listing remarks
Discover the Adams, an ideal 4-bedroom, 3.5-bathroom rear entry garage townhome. As an end unit, it offers the convenience of a side entry. Enjoy a first-floor master suite featuring dual walk-in closets and French doors leading to a private front porch. The open concept design seamlessly connects the kitchen and gathering areas. Upstairs, guests are welcomed by an airy loft surrounded by two more bedrooms and a guest suite complete with its private bath. Experience the perfect blend of comfort and functionality in this thoughtfully designed townhome. These images are for illustrative purposes only and may not depict the exact specifications or details of the actual home available for sale.
Key facts
- Dual walk-in closets
- Side entry
- Private front porch
Tags
Neighborhood map
What this means for you Summary
Snapshot
- This is a 4-bed/3.5-bath townhouse listed at $346k.
Deal economics
- At list price, monthly cash flow is $500 ($6k/yr) — positive.
- The deal already cash-flows at list — no discount required.
- Meets the 1% rule at list price ($4k rent vs $346k).
- Recommended offer: $304k (12.0% below list) — sets the bar for market timing.
- Cap rate 8.0% vs local median 3.6% in North Fort Myers — top-decile yield for the area; either an underpriced asset or a hidden risk that comps aren't pricing in. Stress-test before assuming the spread holds.
Location & tenants
- Location reads 74/100 on livability (#269 in FL, #4,409 nationally) — a middle-class / working-renter tenant base. Strengths: cost of living A+, housing A+, health & safety A+; Watch: employment C-, amenities F, commute F.
- Charlotte (suburban): math 54% / reading 54% proficiency, ranked #22 of 73 in FL (top 30%) — acceptable for families but not a draw, mixed tenant base, ~2y average lease.
- Market conditions: Rents rising fast (+4.1%/yr); 1037 active listings in the ZIP; 13 comparable units currently listed for rent nearby; rentals at typical pace (median 21d on market — plan ~3-4 weeks tenant-placement turnaround); 4,585 units permitted in Charlotte County in 2024 (703 in 5+ unit buildings).
- At $3,816/mo this rent would consume 63% of the median local household income ($72k/yr) (locally 43% of renters already pay >50% of income on rent) — very limited rent-growth headroom before tenants either downsize or default.
Forward outlook
- Local home prices are declining (-3.0%/yr); year-one equity from $2k of loan paydown is wiped out by about $10k of value loss. Plan a longer hold.
- Charlotte County population projected at +24% by 2050 — long-run rental-demand tailwind backs the buy-and-hold thesis.
Negotiation context
- It's been on market 188 days — a 12% lower offer ($304k) is reasonable based on typical stale-listing flexibility.
Questions for the listing agent
- It's been on market 188 days. Have you received any prior offers? Is the seller open to a 12% concession, seller financing, or rate buy-down credit?
- What does the HOA fee cover, when was the last increase, and are there any pending special assessments or reserve-fund shortfalls?
- Why hasn't it sold? Are there any deal-killer items the seller is aware of (foundation, flood, title, zoning, code violations)?
- Is there a deadline driving the sale (1031 exchange, divorce, estate, relocation)? That informs how much negotiation room exists.
- What's the average days-on-market for RENTAL listings here right now (not sales)? A rising rental-DOM trend means longer vacancies and softer asking-rent achievability than the comps imply.
- What's the recent tenant-quality profile in this submarket — average credit score on applications, eviction rate, late-payment / NSF rate, and stable-employment percentage? A property-management company in the area should have these aggregated.
- How much new for-sale + rental construction is in the pipeline within 1–3 miles? Heavy new supply typically softens prices + rents 12–24 months out; constrained supply supports both.
Investment metrics
- 1% rule
- 1.10% ✓
- Cap rate
- 8.03%
- Cash-on-cash
- 6.19%
- DSCR
- 1.28
- GRM
- 7.6
CMA / ARV
No comps found within radius.
Projected returns pro-forma
-3.0% appreciation · 4.13% rent growth · sell at horizon
- IRR
- -5.4%
- Equity multiple
- 0.80×
- Total profit
- $-19,730
- Equity at exit
- $51,588
- IRR
- 5.6%
- Equity multiple
- 1.44×
- Total profit
- $42,750
- Equity at exit
- $29,915
Cash invested: $96,877 (down + closing). Projections, not guarantees.
Landlord ↔ Tenant lean methodology
- Overall (STATE)
- 87 Strongly Landlord-Friendly
- State Florida
- 87 Strongly Landlord-Friendly · R+3
- County
- — inherits STATE
- City
- — inherits STATE
ZIP-level market 33982
- Home prices YoY
- -1.2%
- Rents YoY
- 4.1%
- Active inventory
- 1037
- Price-to-rent
- 7.6×
Monthly cashflow live
- Estimated rent
- $3,816 high interval (Pro) →
- Mortgage (P&I)
- −$1,814
- Tax est. 1.5%
- −$432 /mo · $5,190/yr
- Insurance
- −$144
- HOA
- −$124
- Vacancy / Maint / Mgmt
- −$801
- Net cashflow
- $500
Break-even live
UW: 25.0% down · 7.5% · 30yr · 1.5% tax · 5.0% vac · 8.0% maint · 8.0% mgmt
Financing live
Cash to close
- Down payment
- $86,498
- Closing costs
- $10,380
- Reserves months
- —
- Total cash needed
- —
Loan-product check · same deal, 3 products live
Conventional
25% down · 7.5% · 30yr
- Down + closing
- —
- Monthly P&I
- —
- Monthly cashflow
- —
- DSCR
- —
- Eligible?
- —
Personal DTI + credit; lowest rate.
DSCR
20% down · 8.5% · 30yr
- Down + closing
- —
- Monthly P&I
- —
- Monthly cashflow
- —
- DSCR
- —
- Eligible?
- —
No personal income docs; deal must DSCR.
Hard money
10% down · 12.0% · 12mo
- Down + closing
- —
- Monthly P&I
- —
- Monthly cashflow
- —
- DSCR
- —
- Eligible?
- —
Short-term bridge; refi at stabilization.
Rent comps 13 comps
| Address | Beds | Baths | Sqft | Rent | $/sqft | DOM | Units | Dist |
|---|---|---|---|---|---|---|---|---|
| 17174 Curry Preserve Dr Punta Gorda, FL | 3.0 | 1.0–2.0 | 1036 | $2,354 | $2.27 | 20d | 58 | 0.22mi |
| 43038 Parkside Ct Punta Gorda, FL | 3.0 | 2.0 | 1677 | $2,500 | $1.49 | 20d | 1 | 0.31mi |
| 43153 Wild Indigo Rd Punta Gorda, FL | 3.0–5.0 | 2.0–2.5 | 1919 | $2,826 | $1.47 | 20d | 25 | 0.46mi |
| 16572 Kingwood Ln #3611 Punta Gorda, FL | 3.0 | 2.0 | 1749 | $4,500 | $2.57 | 20d | 1 | 0.76mi |
| 43693 Tree Top Trl Punta Gorda, FL | 3.0 | 3.0 | 1850 | $11,000 | $5.95 | 20d | 1 | 0.89mi |
| 17339 Palmetto Pass Ln Punta Gorda, FL | 3.0 | 3.0 | 2464 | $5,000 | $2.03 | 20d | 1 | 0.90mi |
| 17604 Fallen Branch Way Punta Gorda, FL | 4.0 | 3.0 | 2027 | $2,700 | $1.33 | 20d | 1 | 0.96mi |
| 42098 Journey Dr Punta Gorda, FL | 3.0 | 2.0 | 2000 | $9,000 | $4.50 | 20d | 1 | 1.00mi |
| 43050 Greenway Blvd Punta Gorda, FL | 2.0–3.0 | 2.0 | 1235 | $6,000 | $4.86 | 13d | 2 | 1.31mi |
| 16397 Preservation Blvd Punta Gorda, FL | 4.0 | 3.5 | 2353 | $2,800 | $1.19 | 20d | 1 | 1.34mi |
| 43020 Greenway Blvd Punta Gorda, FL | 2.0–3.0 | 2.0 | 1243 | $6,500 | $5.23 | 13d | 7 | 1.41mi |
| 43041 Greenway Blvd Punta Gorda, FL | 2.0–3.0 | 2.0 | 1569 | $7,500 | $4.78 | 20d | 3 | 1.44mi |
| 43997 Boardwalk Loop #1821 Punta Gorda, FL | 3.0 | 2.0 | 1301 | $6,500 | $5.00 | 20d | 1 | 1.47mi |
HOA detail
- Monthly dues
- $124 · $1,488/yr
Listing history 3 events
-
2026-06-18days on market $345,990 Active 188 DOM
-
2026-06-17remarks 699-char remark
-
2026-06-17$345,990 Active 187 DOM
ⓘ Source: listings_history table (triggers on properties + properties_extension) + one-shot
backfill from property_details.listing_events for pre-trigger history.
Nearby sold comps map
Loading sold comps map…
Walkable amenities ~0.75 mi
Loading nearby amenities…
Taxation est. · year 1
- Rental income
- $45,791
- − Mortgage interest
- −$19,381
- − Property taxes
- −$5,190
- − Insurance
- −$1,730
- − Repairs & maintenance
- −$3,663
- − Management
- −$3,663
- − HOA
- −$1,488
- − Depreciation
- −$10,065
- Taxable income
- $611
- Est. tax owed @ 24.0%
- −$147
- After-tax cash flow
- $5,848/yr
For passive investors: Depreciation is non-cash, so a rental often shows a tax loss while cash-flowing — sheltering income. Rental losses are passive: they offset passive income freely, and up to $25,000/yr can offset ordinary (W-2) income if you actively participate and your MAGI is under $100k (phasing out to $0 by $150k); unused losses carry forward. On sale, claimed depreciation is recaptured at up to 25%, and gains may owe capital-gains tax (a 1031 exchange can defer both). Figures are a year-1 estimate at your 24.0% rate — not tax advice; consult a CPA.
Schools (NCES district)
- District
- Charlotte
- NCES district ID
- 1200240
- Math proficiency
- 54% ▼ -6.00%
- Reading proficiency
- 54% ▼ -1.00%
- Median HH income
- $44,864
- Composite
- 45.62/100
- National rank
- #2586
- State rank
- #22 of 73 in FL
Livability — North Fort Myers
- Score
- 74/100
- State rank
- #269
- US rank
- #4409
Category grades
Schools grade is shown separately in the Schools card above.
Census & demographics
- County
- Charlotte County · 196,994 people
- City population
- 57,035
- Metro
- Punta Gorda, FL
- Population (ZIP)
- 13,006
- Household income
- $72,443
- Rent vs Own
- Severe rent burden
- 43.0
Population outlook (Charlotte County) Hauer SSP2
- Today (2025)
- 198,646 people
- By 2030
- 210,507 · +6.0%
- By 2040
- 230,857 · +16.2%
- By 2050
- 247,148 · +24.4%
- By 2075
- 281,777 · +41.8%
- By 2100
- 293,609 · +47.8%
Race, ethnicity, and origin ACS 2023
- Neighborhood character
- Predominantly White (81%)
- Race & ethnicity
- White 81% Two or more races 8% Hispanic / Latino 7% Black 7%
- Hispanic origin (detail)
- Puerto Rican 2% Cuban 3%
- Common ancestry
- Lithuanian 3% Iranian 3% Slovak 3%
- Foreign-born
- 6% · Canada, Jamaica
- Languages at home
- 93% English-only · Spanish 5% German/W. Germanic 1% Arabic 1%
Political lean MEDSL · Charlotte
- 2024 margin
- Solid R (+34.0) · D 32.7% · R 66.7%
- 2008→2024 swing
- -26.7pp toward R · 2008: -7.2pp · 2024: -34.0pp
- All cycles
- 2024: R+34.0 2020: R+26.6 2016: R+27.8 2012: R+14.3 2008: R+7.2
Not yet ingested
- Civics
- —
Market trends
- HPI YoY
- ▼ -5.25%
- Current HPI
- 448.5895
- Rent YoY
- ▲ 4.13%
- Metro
- Punta Gorda, FL
- State GDP YoY
- ▲ 3.28%
- F500 in state
- 36
Industry mix (Fortune 500 HQ in FL)
| Industry | F500 HQs | Revenue |
|---|---|---|
| Industrial Technology | 2 | $29B |
|
||
| Insurance | 2 | $17B |
|
||
| Retail | 1 | $60B |
|
||
| Technology Distribution | 1 | $58B |
|
||
| Homebuilding | 1 | $35B |
|
||
| Technology Manufacturing | 1 | $35B |
|
||
Cash-flow waterfall
monthlySold comps — $/sqft
last 12 mo · ≤1 miLoading sold comps…