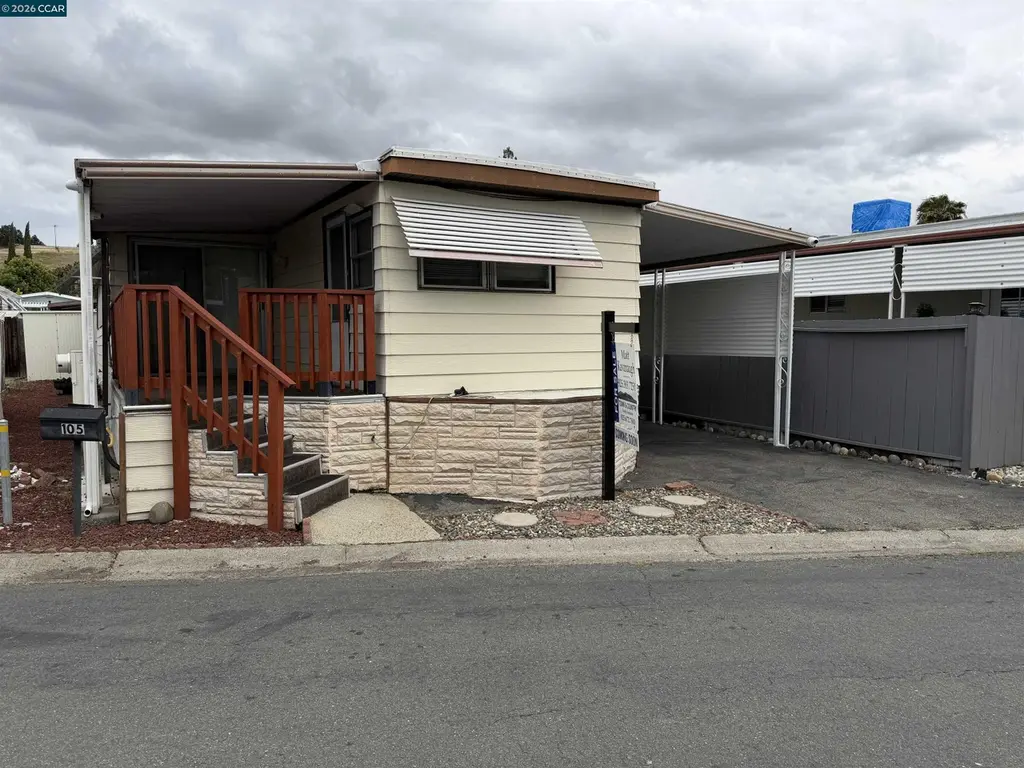
105 Eileen Ln · Concord, CA
Flood risk 1/10 · Minimal
- FEMA flood zone
- X (unshaded)
- Chance of flooding over 30 yrs
- 0.0%
- Est. flood insurance / yr
- $507 – $1,088
Fire risk 3/10 · Minor
- Est. fire insurance / yr
- $659 – $1,223
Heat risk 4/10 · Minor
- Hot days now (above 96°F)
- 7 days/yr
- Hot days in 30 yrs
- 14 days/yr
Wind risk 1/10 · Minimal
- Chance of severe wind over 30 yrs
- —
Air-quality risk 9/10 · Severe
- Unhealthy air days now
- 18 days/yr
- Unhealthy air days in 30 yrs
- 19 days/yr
Risk factors via First Street. Map © Google.
Why this score? — see what drove the B+ grade
The composite is a weighted blend of 9 inputs, each scored 0–100. Each bar is that input's sub-score; the figure is the points it added to the 100-point composite (weight × sub-score).
- Cash flow +30.0/30.0
- ARV discount +15.0/15.0
- 1% rule +10.0/10.0
- DSCR +10.0/10.0
- Schools +3.8/10.0
- Condition / age +3.8/5.0
- Rent growth +3.2/5.0
- Livability +3.2/5.0
- Appreciation +0.0/10.0
$125,000
🖨 Deal sheet 📄 Offer letter ✓ Due diligence
Listing remarks
Welcome home to this charming 1 bedroom, 1 bathroom mobile home in the desirable Concord Mobile Home Park off San Miguel Drive. Located in a friendly, family-oriented community, this well-maintained home offers comfort and convenience. Step inside to a cozy, open living space that flows into a completely enclosed patio — an ideal spot for relaxing, entertaining, or enjoying extra living area filled with natural light. Pride of ownership is evident throughout this lovingly cared-for home. The park offers fantastic amenities including two pools, two clubhouses for community gatherings, on-site laundry facilities, RV parking, and a car wash port. Residents also enjoy a prime location clo
Key facts
- Community pool
- Listed 23 days
Property features AI
Finance
- HOA & community: Pets allowed upon approval; Community clubhouse; Community pool; BBQ area; Car wash area; Guest parking; On-site laundry; RV parking; RV storage; Located in Concord Mobile Home Park
Exterior
- Parking: Carport with space for 2 or more
- Utilities: Public water; Public sewer; Master gas meter
- Home design: Manufactured in park (mobile home); Single-wide body type; 1 story
- Construction: Aluminum siding; Metal construction; Aluminum skirting; In-ground pool
- Exterior features: Deck; Patio; Covered porch; Enclosed porch; Front porch; Back yard; Side yard; Low-maintenance yard; Shed(s)
Interior
- Kitchen: Gas range; Built-in oven; Refrigerator; Pantry; Solid-surface counters
- Bedrooms: 1 bedroom (street level)
- Flooring: Laminate flooring; Linoleum flooring
- Bathrooms: 1 full bathroom
- Heating & cooling: Forced-air heating; Evaporative cooling
- Interior features: Solid-surface countertops; Pantry; Bonus/plus room; Sun porch
- Laundry & utility: Washer/dryer hookups only
Neighborhood map
What this means for you Summary
Snapshot
- This is a 1-bed/1.0-bath manufactured listed at $125k. Condition is rated good.
Deal economics
- At list price, monthly cash flow is $759 ($9k/yr) — positive.
- The deal already cash-flows at list — no discount required.
- Meets the 1% rule at list price ($2k rent vs $125k).
- Recommended offer: $123k (1.5% below list) — sets the bar for market timing.
- Cap rate 13.6% vs local median 2.8% in Concord — top-decile yield for the area; either an underpriced asset or a hidden risk that comps aren't pricing in. Stress-test before assuming the spread holds.
Location & tenants
- Location reads 65/100 on livability (#397 in CA) — a middle-class / working-renter tenant base. Strengths: employment A+, health & safety A+, housing B; Watch: schools C-, crime F, amenities F.
- Mt. Diablo Unified (suburban): math 36% / reading 45% proficiency, ranked #202 of 517 in CA (top 39%) — families likely to look elsewhere, expect single-tenant / working-renter base with shorter leases.
- Market conditions: Rents rising (+2.8%/yr); 128 active listings in the ZIP; 40 comparable units currently listed for rent nearby; rentals at typical pace (median 21d on market — plan ~3-4 weeks tenant-placement turnaround); high-income renter base; 2,169 units permitted in Contra Costa County in 2024 (896 in 5+ unit buildings).
Forward outlook
- Local home prices are declining (-3.0%/yr); year-one equity from $864 of loan paydown is wiped out by about $4k of value loss. Plan a longer hold.
- Contra Costa County population projected at +26% by 2050 — long-run rental-demand tailwind backs the buy-and-hold thesis.
- At projected returns (-3.0% appreciation + 2.8% rent growth), your $35k cash investment doubles in ~5 years — after that, you're playing with house money.
Negotiation context
- It's been on market 23 days — a 2% lower offer ($123k) is reasonable based on typical stale-listing flexibility.
Questions for the listing agent
- Is there a deadline driving the sale (1031 exchange, divorce, estate, relocation)? That informs how much negotiation room exists.
- Crime grade is F in this area — have there been break-ins, vandalism, or insurance claims at this property in the last 3 years? What carrier currently insures it and at what premium?
- What's the average days-on-market for RENTAL listings here right now (not sales)? A rising rental-DOM trend means longer vacancies and softer asking-rent achievability than the comps imply.
- What's the recent tenant-quality profile in this submarket — average credit score on applications, eviction rate, late-payment / NSF rate, and stable-employment percentage? A property-management company in the area should have these aggregated.
- How much new for-sale + rental construction is in the pipeline within 1–3 miles? Heavy new supply typically softens prices + rents 12–24 months out; constrained supply supports both.
Investment metrics
- 1% rule
- 1.64% ✓
- Cap rate
- 13.58%
- Cash-on-cash
- 26.02%
- DSCR
- 2.16
- GRM
- 5.1
CMA / ARV
- ARV (on-the-fly)
- $194,650
- Comps found
- 6
Show comp detail 6 sales within ~0.75 mi
| Address | Dist | Beds/Ba | Sqft | Sold | Price | $/sf | Match |
|---|---|---|---|---|---|---|---|
| 81 Eileen | 0.04mi | 2/1.0 (+1) | 825 (-3%) | 4mo | $149,000 | $181 | 85 |
| 96 Welcome Ave | 0.16mi | 2/2.0 (+1) | 868 (+2%) | 1mo | $199,000 | $229 | 79 |
| 86 Eileen Ln | 0.02mi | 2/2.0 (+1) | 812 (-4%) | 6mo | $235,000 | $289 | 77 |
| 141 Scenic Dr | 0.17mi | 2/1.0 (+1) | 800 (-6%) | 2mo | $135,000 | $169 | 75 |
| 53 Galloway Dr #53 | 0.08mi | 2/2.0 (+1) | 940 (+11%) | 16mo | $275,000 | $293 | 57 |
| 56 Koch Ln | 0.11mi | 2/2.0 (+1) | 960 (+13%) | 13mo | $145,000 | $151 | 54 |
Match score weights: distance 35% · size 25% · config 20% · recency 20%. Top-matched comps best support the ARV.
Projected returns pro-forma
-3.0% appreciation · 2.77% rent growth · sell at horizon
- IRR
- 19.5%
- Equity multiple
- 1.79×
- Total profit
- $27,639
- Equity at exit
- $18,638
- IRR
- 27.6%
- Equity multiple
- 3.41×
- Total profit
- $84,498
- Equity at exit
- $10,808
Cash invested: $35,000 (down + closing). Projections, not guarantees.
Landlord ↔ Tenant lean methodology
- Overall (STATE)
- 18 Strongly Tenant-Friendly
- State California
- 18 Strongly Tenant-Friendly · D+13
- County
- — inherits STATE
- City
- — inherits STATE
ZIP-level market 94518
- Rents YoY
- 2.8%
- Active inventory
- 128
- Price-to-rent
- 5.1×
Monthly cashflow live
- Estimated rent
- $2,054 high interval (Pro) →
- Mortgage (P&I)
- −$656
- Tax est. 1.5%
- −$156 /mo · $1,875/yr
- Insurance
- −$52
- HOA
- −$0
- Vacancy / Maint / Mgmt
- −$431
- Net cashflow
- $759
Break-even live
UW: 25.0% down · 7.5% · 30yr · 1.5% tax · 5.0% vac · 8.0% maint · 8.0% mgmt
Financing live
Cash to close
- Down payment
- $31,250
- Closing costs
- $3,750
- Reserves months
- —
- Total cash needed
- —
Loan-product check · same deal, 3 products live
Conventional
25% down · 7.5% · 30yr
- Down + closing
- —
- Monthly P&I
- —
- Monthly cashflow
- —
- DSCR
- —
- Eligible?
- —
Personal DTI + credit; lowest rate.
DSCR
20% down · 8.5% · 30yr
- Down + closing
- —
- Monthly P&I
- —
- Monthly cashflow
- —
- DSCR
- —
- Eligible?
- —
No personal income docs; deal must DSCR.
Hard money
10% down · 12.0% · 12mo
- Down + closing
- —
- Monthly P&I
- —
- Monthly cashflow
- —
- DSCR
- —
- Eligible?
- —
Short-term bridge; refi at stabilization.
Rent comps 40 comps
| Address | Beds | Baths | Sqft | Rent | $/sqft | DOM | Units | Dist |
|---|---|---|---|---|---|---|---|---|
| 1070 San Miguel Rd Concord, CA | 1.0–2.0 | 1.0–1.5 | 890 | $1,895 | $2.13 | 19d | 1 | 0.26mi |
| 2055 Sierra Rd #34 Concord, CA | 1.0 | 1.0 | 639 | $2,150 | $3.36 | 24d | 1 | 0.49mi |
| 2043 Sierra Rd #11 Concord, CA | 2.0 | 1.5 | 904 | $2,100 | $2.32 | 24d | 1 | 0.54mi |
| 1036 Oak Grove Rd Concord, CA | 1.0–2.0 | 1.0–1.5 | 810 | $1,980 | $2.44 | 24d | 2 | 0.58mi |
| 1036 Oak Grove Rd Concord, CA | 1.0–2.0 | 1.0–1.5 | 826 | $1,850 | $2.24 | 2d | 3 | 0.58mi |
| 2751 Monument Blvd Concord, CA | 1.0–2.0 | 1.0 | 676 | $1,715 | $2.54 | 3d | 1 | 0.61mi |
| 1236 Detroit Ave Concord, CA | 2.0 | 1.0 | 750 | $2,430 | $3.24 | 4d | 1 | 0.67mi |
| 1050 Oak Grove Rd Concord, CA | 1.0–2.0 | 1.0 | 740 | $2,150 | $2.91 | 1d | 3 | 0.69mi |
| 2055 Fox Way Concord, CA | 1.0 | 1.0 | 592 | $1,850 | $3.12 | 24d | 1 | 0.70mi |
| 2925 Monument Blvd Concord, CA | 2.0–3.0 | 1.5 | 1084 | $2,545 | $2.35 | 3d | 5 | 0.73mi |
| 1160 Meadow Ln Concord, CA | 1.0–2.0 | 1.0–1.5 | 740 | $1,795 | $2.42 | 11d | 9 | 0.81mi |
| 2067 Riley Ct Unit 5 Concord, CA | 1.0 | 1.0 | 710 | $1,750 | $2.46 | 18d | 1 | 0.83mi |
| 2065 Riley Ct Apt 1 Concord, CA | 1.0 | 1.0 | 600 | $1,699 | $2.83 | 21d | 1 | 0.84mi |
| 2065 Riley Ct Apt 1 Concord, CA | 1.0 | 1.0 | 600 | $1,799 | $3.00 | 24d | 1 | 0.84mi |
| 1133 Meadow Ln #94 Concord, CA | 1.0 | 1.0 | 592 | $1,595 | $2.69 | 3d | 1 | 0.84mi |
| 1750 Diane Ct Concord, CA | 2.0 | 1.0 | 900 | $2,325 | $2.58 | 24d | 1 | 0.87mi |
| 1185 Meadow Ln Unit 115 Concord, CA | 1.0 | 1.0 | 800 | $2,350 | $2.94 | 24d | 1 | 0.87mi |
| 1866 Robin Ln Unit 6 Concord, CA | 2.0 | 1.0 | 700 | $2,200 | $3.14 | 20d | 1 | 0.88mi |
| 1854 Robin Ln Concord, CA | 1.0 | 1.0 | 625 | $1,725 | $2.76 | 24d | 1 | 0.89mi |
| 1883 Robin Ln #1 Concord, CA | 2.0 | 1.0 | 950 | $2,600 | $2.74 | 24d | 1 | 0.89mi |
| 1867 Robin Ln Unit 3 Concord, CA | 1.0 | 1.0 | 700 | $1,595 | $2.28 | 24d | 1 | 0.90mi |
| 1195 Heather Ct Unit A Concord, CA | 2.0 | 1.0 | 980 | $2,700 | $2.76 | 3d | 1 | 0.92mi |
| 1835 Robin Ln Concord, CA | 2.0 | 2.0 | 800 | $2,100 | $2.62 | 5d | 1 | 0.94mi |
| 1835 Robin Ln Unit 11 Concord, CA | 2.0 | 2.0 | 800 | $2,100 | $2.62 | 23d | 1 | 0.95mi |
| 1590 Frisbie Ct Unit 6 Concord, CA | 2.0 | 1.0 | 850 | $2,195 | $2.58 | 15d | 1 | 0.96mi |
| 1818 Laguna St Concord, CA | 1.0–2.0 | 1.0 | 750 | $1,958 | $2.61 | 5d | 12 | 0.97mi |
| 1150 Virginia Ln Concord, CA | 1.0 | 1.0 | 600 | $1,775 | $2.96 | 16d | 1 | 0.98mi |
| 1660 Haller Ct Concord, CA | 2.0 | 1.0 | 880 | $2,125 | $2.41 | 21d | 1 | 0.98mi |
| 1631 Frisbie Ct Concord, CA | 2.0 | 1.0 | 750 | $2,100 | $2.80 | 23d | 1 | 1.01mi |
| 1631 Frisbie Ct Concord, CA | 2.0 | 1.0 | 750 | $2,100 | $2.80 | 5d | 1 | 1.01mi |
| 1641 Frisbie Ct Concord, CA | 2.0 | 1.0 | 900 | $2,325 | $2.58 | 24d | 1 | 1.01mi |
| 1500 Ellis St Concord, CA | 2.0 | 1.0–2.0 | 664 | $2,085 | $3.14 | 11d | 5 | 1.02mi |
| 1441 Detroit Ave Concord, CA | 1.0–2.0 | 1.0–2.0 | 738 | $1,840 | $2.49 | 1d | 11 | 1.02mi |
| 1125 Lacey Ln #4 Concord, CA | 1.0 | 1.0 | 680 | $1,850 | $2.72 | 24d | 1 | 1.03mi |
| 1841 Laguna St Concord, CA | 2.0 | 1.0 | 925 | $2,372 | $2.56 | 24d | 5 | 1.04mi |
| 1551 Lacey Ct #2 Concord, CA | 1.0 | 1.0 | 680 | $1,850 | $2.72 | 20d | 1 | 1.05mi |
| 1699 Laguna St Concord, CA | 1.0 | 1.0 | 646 | $1,787 | $2.77 | 24d | 1 | 1.06mi |
| 1491 Detroit Ave Concord, CA | 1.0–2.0 | 1.0 | 650 | $1,525 | $2.35 | 16d | 1 | 1.08mi |
| 1555 Galindo St Concord, CA | 1.0–3.0 | 1.0–2.5 | 1045 | $2,857 | $2.73 | 1d | 13 | 1.09mi |
| 1591 Ellis St #220 Concord, CA | 1.0 | 1.0 | 646 | $2,000 | $3.10 | 12d | 1 | 1.10mi |
Listing history 7 events
-
2026-06-04status $125,000 Pending 23 DOM
-
2026-06-03days on market $125,000 Active Under Contract 23 DOM
-
2026-06-02statusdays on market $125,000 Active Under Contract 22 DOM
-
2026-06-01days on market $125,000 Active 21 DOM
-
2026-05-31days on market $125,000 Active 20 DOM
-
2026-05-11$125,000 Active
-
2026-05-05historical $125,000
ⓘ Source: listings_history table (triggers on properties + properties_extension) + one-shot
backfill from property_details.listing_events for pre-trigger history.
Climate risk First Street
- Flood 1/10 Low FEMA zone X (unshaded) · 0% chance over 30 yrs
- Wildfire 3/10 Moderate
- Heat 4/10 Moderate 7 d/yr ≥96°F today · 14 d/yr by 30 yrs out
- Wind 1/10 Low
- Air quality 9/10 Extreme 18 unhealthy d/yr today · 19 by 30 yrs out
Nearby sold comps map
Loading sold comps map…
Walkable amenities ~0.75 mi
Loading nearby amenities…
Taxation est. · year 1
- Rental income
- $24,650
- − Mortgage interest
- −$7,002
- − Property taxes
- −$1,875
- − Insurance
- −$625
- − Repairs & maintenance
- −$1,972
- − Management
- −$1,972
- − Depreciation
- −$3,636
- Taxable income
- $7,568
- Est. tax owed @ 24.0%
- −$1,816
- After-tax cash flow
- $7,291/yr
For passive investors: Depreciation is non-cash, so a rental often shows a tax loss while cash-flowing — sheltering income. Rental losses are passive: they offset passive income freely, and up to $25,000/yr can offset ordinary (W-2) income if you actively participate and your MAGI is under $100k (phasing out to $0 by $150k); unused losses carry forward. On sale, claimed depreciation is recaptured at up to 25%, and gains may owe capital-gains tax (a 1031 exchange can defer both). Figures are a year-1 estimate at your 24.0% rate — not tax advice; consult a CPA.
Condition & rehab AI · 12 photos
This charming mobile home in Concord Mobile Home Park is in good condition with cosmetic updates needed to enhance its resale and rental value.
Repairs flagged
- Minor kitchen cabinets — dated design
- Minor bathroom fixtures — standard, could be updated
Value-add opportunities
- Resale paint interior walls — enhances curb appeal
- Resale replace kitchen cabinets — modernizes space
- Resale update bathroom fixtures — enhances functionality
- Both landscaping — enhances curb appeal and adds value
Renovation cost estimate screening
| Repair item | Severity | Est. cost |
|---|---|---|
| kitchen cabinets · dated design | Minor | $500–3,000 |
| bathroom fixtures · standard, could be updated | Minor | $500–3,000 |
| Total estimated repair cost · 2 items | $1,000–6,000 |
Value-add ROI direction
- Resale paint interior walls — enhances curb appeal ↑
- Resale replace kitchen cabinets — modernizes space ↑
- Resale update bathroom fixtures — enhances functionality ↑
- Both landscaping — enhances curb appeal and adds value ↑
ⓘ Cost ranges are severity-bucket heuristics (US national rule-of-thumb). Get contractor quotes + a written scope before underwriting a rehab budget.
Schools (NCES district)
- District
- Mt. Diablo Unified
- NCES district ID
- 0626370
- Math proficiency
- 36% ▼ -2.00%
- Reading proficiency
- 45% ▼ -5.00%
- Median HH income
- $77,494
- Composite
- 37.5/100
- National rank
- #4401
- State rank
- #202 of 517 in CA
Livability — Concord
- Score
- 65/100
- State rank
- #397
- US rank
- #13519
Category grades
Schools grade is shown separately in the Schools card above.
Census & demographics
- Census place
- Concord, CA
- County
- Contra Costa County · 1,059,880 people
- City population
- 125,693
- Metro
- San Francisco-Oakland-Berkeley, CA
- Population (ZIP)
- 27,345
- Household income
- $112,094
- Rent vs Own
- Severe rent burden
- 1071.0
Population outlook (Contra Costa County) Hauer SSP2
- Today (2025)
- 1,287,720 people
- By 2030
- 1,364,937 · +6.0%
- By 2040
- 1,506,209 · +17.0%
- By 2050
- 1,624,373 · +26.1%
- By 2075
- 1,853,193 · +43.9%
- By 2100
- 1,901,231 · +47.6%
Race, ethnicity, and origin ACS 2023
- Neighborhood character
- Diverse neighborhood (Simpson 0.67)
- Race & ethnicity
- White 48% Hispanic / Latino 29% Two or more races 18% Asian 13% Black 2% Native American 1%
- Hispanic origin (detail)
- Mexican 17%
- Common ancestry
- Lithuanian 2% Italian 2% Slovak 2%
- Foreign-born
- 26% · Canada, China, Jamaica
- Languages at home
- 64% English-only · Spanish 20% Other Indo-European 5% Chinese 4%
Political lean MEDSL · Contra Costa
- 2024 margin
- Solid D (+38.0) · D 67.3% · R 29.4% · Other 3.3%
- 2008→2024 swing
- +0.2pp no change · 2008: 37.8pp · 2024: 38.0pp
- All cycles
- 2024: D+38.0 2020: D+45.3 2016: D+43.5 2012: D+33.7 2008: D+37.8
Not yet ingested
- Civics
- —
Market trends
- HPI YoY
- ▼ -817.60%
- Current HPI
- 149.0257
- Rent YoY
- ▲ 2.77%
- Metro
- San Francisco-Oakland-Berkeley, CA
- State GDP YoY
- ▲ 3.21%
- F500 in state
- 116
Industry mix (Fortune 500 HQ in CA)
| Industry | F500 HQs | Revenue |
|---|---|---|
| Technology | 27 | $1,492B |
|
||
| Financial Services | 3 | $174B |
|
||
| Retail | 3 | $44B |
|
||
| Insurance | 3 | $26B |
|
||
| Media / Entertainment | 2 | $115B |
|
||
| Pharmaceuticals / Biotech | 2 | $62B |
|
||
Price history
+0.0% since first listed2 events — show timeline
- 2026-05-11 Listed $125,000 bridgeMLS, Bay East AOR, or Contra Costa AOR
- 2026-05-05 Coming Soon $125,000 bridgeMLS, Bay East AOR, or Contra Costa AOR
Cash-flow waterfall
monthlySold comps — $/sqft
last 12 mo · ≤1 miLoading sold comps…