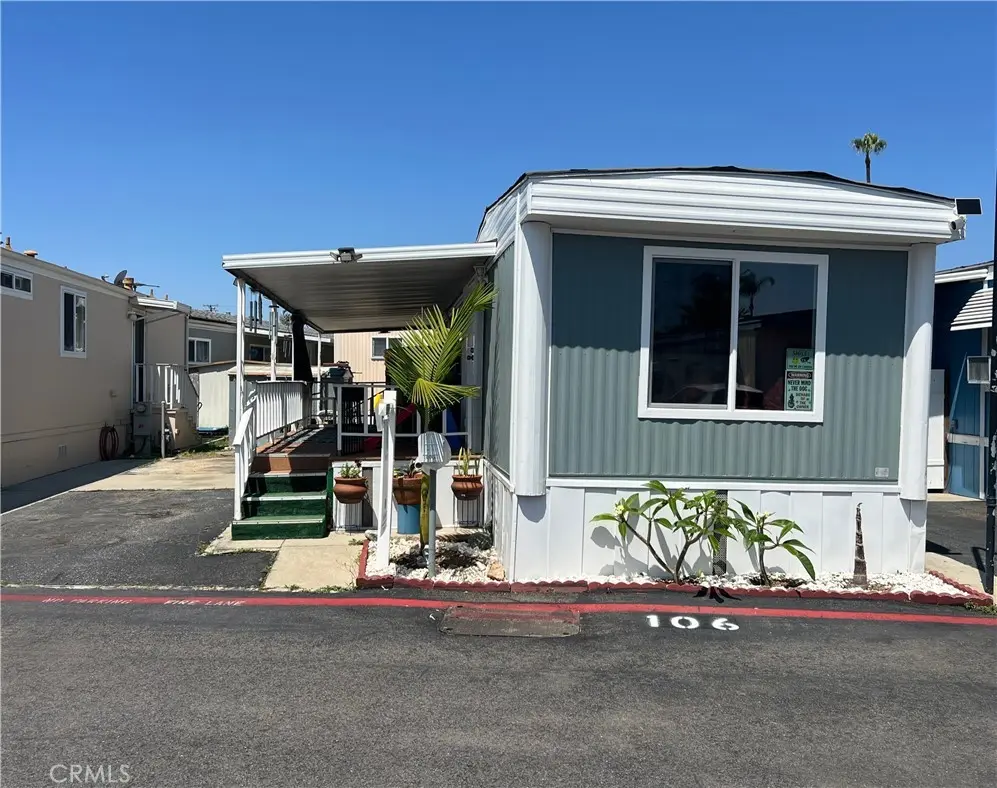
23701 S Western Ave #106 · Torrance, CA
Flood risk 1/10 · Minimal
- FEMA flood zone
- X (unshaded)
- Chance of flooding over 30 yrs
- 0.0%
- Est. flood insurance / yr
- $507 – $1,088
Fire risk 1/10 · Minimal
- Est. fire insurance / yr
- $659 – $1,223
Heat risk 3/10 · Minor
- Hot days now (above 86°F)
- 7 days/yr
- Hot days in 30 yrs
- 22 days/yr
Wind risk 1/10 · Minimal
- Chance of severe wind over 30 yrs
- —
Air-quality risk 5/10 · Moderate
- Unhealthy air days now
- 7 days/yr
- Unhealthy air days in 30 yrs
- 7 days/yr
Risk factors via First Street. Map © Google.
Why this score? — see what drove the C grade
The composite is a weighted blend of 9 inputs, each scored 0–100. Each bar is that input's sub-score; the figure is the points it added to the 100-point composite (weight × sub-score).
- Cash flow +15.0/30.0
- ARV discount +15.0/15.0
- Schools +5.9/10.0
- 1% rule +5.0/10.0
- DSCR +5.0/10.0
- Livability +3.8/5.0
- Rent growth +3.3/5.0
- Condition / age +2.5/5.0
- Appreciation +0.0/10.0
$39,500
🖨 Deal sheet 📄 Offer letter ✓ Due diligence
Listing remarks MLS
JUST REDUCED – PRICED TO SELL! Selling "As Is", Cozy 1 bed, 1 bath home in Knolls Lodge Mobile Home Park! Filled with natural light, featuring a comfortable living space and private outdoor area. Close to shops, restaurants, and freeway access. Ideal for first time buyers! Enjoy community pool, car wash, laundromat and club house. Please do not disturb the owners
Key facts
- Community pool
- Natural light
- Club house
Tags
Neighborhood map
What this means for you Summary
Snapshot
- This is a 1-bed/1.0-bath manufactured listed at $40k.
Deal economics
- At list price, monthly cash flow is $2k ($19k/yr) — positive.
- The deal already cash-flows at list — no discount required.
- Meets the 1% rule at list price ($2k rent vs $40k).
- Recommended offer: $35k (12.0% below list) — sets the bar for market timing.
- Cap rate 54.9% vs local median 2.1% in Torrance — top-decile yield for the area; either an underpriced asset or a hidden risk that comps aren't pricing in. Stress-test before assuming the spread holds.
Location & tenants
- Location reads 76/100 on livability (#95 in CA, #3,501 nationally) — a middle-class / working-renter tenant base. Strengths: schools A+, amenities A+, commute A+; Watch: health & safety C-, crime D+, cost of living F.
- Torrance Unified (urban): math 62% / reading 67% proficiency, ranked #150 of 1,400 in CA (top 11%) — acceptable for families but not a draw, mixed tenant base, ~2y average lease; only 20% free/reduced lunch — higher-income household profile.
- Market conditions: Rents rising (+3.2%/yr); 96 active listings in the ZIP; 27 comparable units currently listed for rent nearby; rentals lingering (median 44d on market — plan ~5-8 weeks vacancy on turnover, expect pricing pressure); 56% of comp listings sitting > 30 days — soft ceiling on asking rent; solid renter incomes; 19,697 units permitted in Los Angeles County in 2024 (9,426 in 5+ unit buildings).
- This rent runs 31% of the median local income ($93k/yr) — at the standard rent-burdened threshold; future hikes will face affordability resistance.
Forward outlook
- Local home prices are declining (-3.0%/yr); year-one equity from $273 of loan paydown is wiped out by about $1k of value loss. Plan a longer hold.
- Los Angeles County population projected at +9% by 2050 — modest demand growth; plan on rents tracking national, not racing it.
- At projected returns (-3.0% appreciation + 3.2% rent growth), your $11k cash investment doubles in ~1 year — after that, you're playing with house money.
Negotiation context
- It's been on market 178 days — a 12% lower offer ($35k) is reasonable based on typical stale-listing flexibility.
- 7 sale attempts since 4y ago; this cycle's ask has dropped $6k (12%) from the opening price — seller is motivated, your offer sets the floor, not the list.
Questions for the listing agent
- It's been on market 178 days. Have you received any prior offers? Is the seller open to a 12% concession, seller financing, or rate buy-down credit?
- Built in 1970 — when were the roof, HVAC, electrical panel, plumbing, and water heater last replaced?
- Why hasn't it sold? Are there any deal-killer items the seller is aware of (foundation, flood, title, zoning, code violations)?
- Is there a deadline driving the sale (1031 exchange, divorce, estate, relocation)? That informs how much negotiation room exists.
- Schools are A-rated — typically a magnet for longer-tenancy family renters. What's the average tenant stay here, and is there a school-zone premium baked into asking?
- Crime grade is D in this area — have there been break-ins, vandalism, or insurance claims at this property in the last 3 years? What carrier currently insures it and at what premium?
- What's the average days-on-market for RENTAL listings here right now (not sales)? A rising rental-DOM trend means longer vacancies and softer asking-rent achievability than the comps imply.
- What's the recent tenant-quality profile in this submarket — average credit score on applications, eviction rate, late-payment / NSF rate, and stable-employment percentage? A property-management company in the area should have these aggregated.
- How much new for-sale + rental construction is in the pipeline within 1–3 miles? Heavy new supply typically softens prices + rents 12–24 months out; constrained supply supports both.
Investment metrics
- 1% rule
- 6.00% ✓
- Cap rate
- 54.89%
- Cash-on-cash
- 173.56%
- DSCR
- 8.72
- GRM
- 1.4
CMA / ARV
- ARV (median comp)
- $58,127
- List price
- $39,500
- Delta
- -32.05%
- Verdict
- UNDERPRICED
- Comps
- 2 within 1.0 mi
Show comp detail 2 sales within ~0.75 mi
| Address | Dist | Beds/Ba | Sqft | Sold | Price | $/sf | Match |
|---|---|---|---|---|---|---|---|
| 23701 S Western Ave #42 | 0.05mi | 2/1.0 (+1) | 624 (0%) | 6mo | $45,000 | $72 | 87 |
| 23701 S Western Ave #77 | 0.05mi | 2/1.0 (+1) | 704 (+13%) | 19mo | $86,200 | $122 | 55 |
Match score weights: distance 35% · size 25% · config 20% · recency 20%. Top-matched comps best support the ARV.
Projected returns pro-forma
-3.0% appreciation · 3.25% rent growth · sell at horizon
- IRR
- —
- Equity multiple
- 9.69×
- Total profit
- $96,114
- Equity at exit
- $5,890
- IRR
- —
- Equity multiple
- 20.66×
- Total profit
- $217,494
- Equity at exit
- $3,415
Cash invested: $11,060 (down + closing). Projections, not guarantees.
Landlord ↔ Tenant lean methodology
- Overall (STATE)
- 18 Strongly Tenant-Friendly
- State California
- 18 Strongly Tenant-Friendly · D+13
- County
- — inherits STATE
- City
- — inherits STATE
ZIP-level market 90501
- Rents YoY
- 3.2%
- Active inventory
- 96
- Price-to-rent
- 1.4×
Monthly cashflow live
- Estimated rent
- $2,370 high interval (Pro) →
- Mortgage (P&I)
- −$207
- Tax est. 1.5%
- −$49 /mo · $592/yr
- Insurance
- −$16
- HOA
- −$0
- Vacancy / Maint / Mgmt
- −$498
- Net cashflow
- $1,600
Break-even live
UW: 25.0% down · 7.5% · 30yr · 1.5% tax · 5.0% vac · 8.0% maint · 8.0% mgmt
Financing live
Cash to close
- Down payment
- $9,875
- Closing costs
- $1,185
- Reserves months
- —
- Total cash needed
- —
Loan-product check · same deal, 3 products live
Conventional
25% down · 7.5% · 30yr
- Down + closing
- —
- Monthly P&I
- —
- Monthly cashflow
- —
- DSCR
- —
- Eligible?
- —
Personal DTI + credit; lowest rate.
DSCR
20% down · 8.5% · 30yr
- Down + closing
- —
- Monthly P&I
- —
- Monthly cashflow
- —
- DSCR
- —
- Eligible?
- —
No personal income docs; deal must DSCR.
Hard money
10% down · 12.0% · 12mo
- Down + closing
- —
- Monthly P&I
- —
- Monthly cashflow
- —
- DSCR
- —
- Eligible?
- —
Short-term bridge; refi at stabilization.
Rent comps 27 comps
| Address | Beds | Baths | Sqft | Rent | $/sqft | DOM | Units | Dist |
|---|---|---|---|---|---|---|---|---|
| 2124 W 238th St Unit A Torrance, CA | 2.0 | 2.0 | 750 | $3,600 | $4.80 | 17d | 1 | 0.48mi |
| 2128 W 238th St Unit A Torrance, CA | 2.0 | 2.0 | 750 | $3,500 | $4.67 | 43d | 1 | 0.48mi |
| 2742 Cabrillo Ave #302 Torrance, CA | 1.0 | 1.0 | 670 | $2,400 | $3.58 | 43d | 1 | 0.72mi |
| 1657 W 227th St Apt 1 Torrance, CA | 2.0 | 1.0 | 575 | $2,150 | $3.74 | 43d | 1 | 0.73mi |
| 1434 Plaza del Amo Unit 4 Torrance, CA | 1.0 | 1.0 | 575 | $1,803 | $3.14 | 43d | 1 | 0.86mi |
| 1318 W 227th St Torrance, CA | 2.0 | 1.0 | 640 | $2,250 | $3.52 | 1d | 1 | 0.88mi |
| 1318 W 227th St Torrance, CA | 2.0 | 1.0 | 640 | $2,250 | $3.52 | 43d | 1 | 0.88mi |
| 25109 Ebony Ln Lomita, CA | 1.0 | 1.0 | 700 | $1,839 | $2.63 | 43d | 1 | 0.88mi |
| 24836 Narbonne Ave Lomita, CA | 2.0 | 1.0 | 740 | $2,995 | $4.05 | 43d | 1 | 0.96mi |
| 2457 Lomita Blvd Lomita, CA | 2.0 | 1.0–2.0 | 878 | $4,112 | $4.68 | 2d | 14 | 1.02mi |
| 25004 Frampton Ave Harbor City, CA | 1.0 | 1.0 | 650 | $1,695 | $2.61 | 5d | 3 | 1.06mi |
| 2122 Gramercy Ave Unit 3 Torrance, CA | 1.0 | 1.0 | 575 | $1,850 | $3.22 | 5d | 1 | 1.18mi |
| 2100 Cabrillo Ave Unit 2106 Torrance, CA | 1.0 | 1.0 | 500 | $2,150 | $4.30 | 24d | 1 | 1.19mi |
| 1609 W 221st St Unit studio1 Torrance, CA | — | 1.0 | 415 | $1,650 | $3.98 | 43d | 1 | 1.19mi |
| 1611 W 221st St Torrance, CA | 2.0 | 1.5 | 650 | $2,600 | $4.00 | 43d | 1 | 1.19mi |
| 820 Coriander Dr Unit K Torrance, CA | 1.0 | 1.0 | 639 | $2,140 | $3.35 | 7d | 1 | 1.20mi |
| 1800 255th St Unit 1812-A Lomita, CA | 2.0 | 1.0 | 750 | $2,145 | $2.86 | 43d | 1 | 1.23mi |
| 23314 Sesame St Unit J-17 Torrance, CA | 1.0 | 1.0 | 639 | $2,275 | $3.56 | 12d | 1 | 1.25mi |
| 1903 Cabrillo Ave Unit C Torrance, CA | 2.0 | 1.0 | 700 | $2,700 | $3.86 | 43d | 1 | 1.31mi |
| 1625 257th St Unit 07 Harbor City, CA | 1.0 | 1.0 | 600 | $1,750 | $2.92 | 24d | 1 | 1.35mi |
| 1033 W 253rd St Unit 103305 Harbor City, CA | 1.0 | 1.0 | 550 | $1,795 | $3.26 | 43d | 1 | 1.39mi |
| 21724 S Western Ave Torrance, CA | — | 1.0 | 450 | $1,670 | $3.71 | 43d | 1 | 1.42mi |
| 1565 W 218th St Torrance, CA | 2.0 | 1.0 | 728 | $2,700 | $3.71 | 43d | 1 | 1.43mi |
| 25710 1/2 Belle Porte Ave Harbor City, CA | 1.0 | 1.0 | 600 | $2,100 | $3.50 | 22d | 1 | 1.44mi |
| 25710 1/2 Belle Porte Ave Harbor City, CA | 1.0 | 1.0 | 600 | $2,100 | $3.50 | 20d | 1 | 1.44mi |
| 23818 S Figueroa St Unit 7042A Carson, CA | 1.0 | 1.0 | 750 | $2,940 | $3.92 | 43d | 1 | 1.49mi |
| 1661 259th St Harbor City, CA | 1.0 | 1.0 | 650 | $1,895 | $2.92 | 16d | 1 | 1.49mi |
Listing history 29 events
-
2026-05-31days on market $39,500 Active 178 DOM
-
2026-02-21price $39,500 385-char remark
Show marketing remark (385 chars)
JUST REDUCED – PRICED TO SELL! Selling "As Is", Cozy 1 bed, 1 bath home in Knolls Lodge Mobile Home Park! Filled with natural light, featuring a comfortable living space and private outdoor area. Close to shops, restaurants, and freeway access. Ideal for first time buyers! Enjoy community pool, car wash, laundromat and club house. Please do not disturb the owners
-
2025-12-04$45,000 Active 385-char remark
Show marketing remark (385 chars)
JUST REDUCED – PRICED TO SELL! Selling "As Is", Cozy 1 bed, 1 bath home in Knolls Lodge Mobile Home Park! Filled with natural light, featuring a comfortable living space and private outdoor area. Close to shops, restaurants, and freeway access. Ideal for first time buyers! Enjoy community pool, car wash, laundromat and club house. Please do not disturb the owners
-
2025-12-01historical
-
2025-11-25price $45,000
-
2025-09-30$49,999 Active
-
2025-09-22historical
-
2025-09-17price $49,999
-
2025-08-22price $54,000
-
2025-08-21price $58,000
-
2025-07-11price $60,000
-
2025-07-10$58,000 Active
-
2025-07-09historical
-
2025-06-30historical
-
2025-05-29price $50,900
-
2025-02-07price $53,000
-
2025-01-15$55,000 Active
-
2024-12-18historical
-
2024-11-20price $55,000
-
2024-10-31price $51,000
-
2024-09-24price $55,000
-
2024-09-20price $57,000
-
2024-09-14price $59,000
-
2024-08-30price $60,000
-
2024-08-15price $62,000
-
2024-08-01price $67,000
-
2024-07-18$75,000 Active
-
2022-12-29status Active
-
2022-12-12$17,500 Active
ⓘ Source: listings_history table (triggers on properties + properties_extension) + one-shot
backfill from property_details.listing_events for pre-trigger history.
Climate risk First Street
- Flood 1/10 Low FEMA zone X (unshaded) · 0% chance over 30 yrs
- Wildfire 1/10 Low
- Heat 3/10 Moderate 7 d/yr ≥86°F today · 22 d/yr by 30 yrs out
- Wind 1/10 Low
- Air quality 5/10 Major 7 unhealthy d/yr today · 7 by 30 yrs out
Nearby sold comps map
Loading sold comps map…
Walkable amenities ~0.75 mi
Loading nearby amenities…
Taxation est. · year 1
- Rental income
- $28,445
- − Mortgage interest
- −$2,213
- − Property taxes
- −$592
- − Insurance
- −$198
- − Repairs & maintenance
- −$2,276
- − Management
- −$2,276
- − Depreciation
- −$1,149
- Taxable income
- $19,742
- Est. tax owed @ 24.0%
- −$4,738
- After-tax cash flow
- $14,458/yr
For passive investors: Depreciation is non-cash, so a rental often shows a tax loss while cash-flowing — sheltering income. Rental losses are passive: they offset passive income freely, and up to $25,000/yr can offset ordinary (W-2) income if you actively participate and your MAGI is under $100k (phasing out to $0 by $150k); unused losses carry forward. On sale, claimed depreciation is recaptured at up to 25%, and gains may owe capital-gains tax (a 1031 exchange can defer both). Figures are a year-1 estimate at your 24.0% rate — not tax advice; consult a CPA.
Schools (NCES district)
- District
- Torrance Unified
- NCES district ID
- 0639420
- Math proficiency
- 62% ▲ 2.00%
- Reading proficiency
- 67% ▬ 0.00%
- Median HH income
- $78,640
- Composite
- 58.96/100
- National rank
- #1969
- State rank
- #150 of 1400 in CA
Livability — Torrance
- Score
- 76/100
- State rank
- #95
- US rank
- #3501
Category grades
Schools grade is shown separately in the Schools card above.
Census & demographics
- Census place
- Torrance, CA
- County
- Los Angeles County · 9,444,647 people
- City population
- 153,473
- Metro
- Los Angeles-Long Beach-Anaheim, CA
- Population (ZIP)
- 41,787
- Household income
- $92,923
- Rent vs Own
- Severe rent burden
- 1972.0
Population outlook (Los Angeles County) Hauer SSP2
- Today (2025)
- 10,940,515 people
- By 2030
- 11,256,481 · +2.9%
- By 2040
- 11,729,929 · +7.2%
- By 2050
- 11,948,407 · +9.2%
- By 2075
- 11,818,114 · +8.0%
- By 2100
- 10,842,928 · -0.9%
Race, ethnicity, and origin ACS 2023
- Neighborhood character
- Diverse neighborhood (Simpson 0.70)
- Race & ethnicity
- Hispanic / Latino 43% Asian 27% White 20% Two or more races 15% Black 5%
- Hispanic origin (detail)
- Mexican 34%
- Common ancestry
- Slovak 1% Lithuanian 1% British 1%
- Foreign-born
- 33% · Canada, South Korea, China
- Languages at home
- 46% English-only · Spanish 32% Other Asian/Pacific 5% Korean 5%
Political lean MEDSL · Los Angeles
- 2024 margin
- Solid D (+32.9) · D 64.8% · R 31.9% · Other 3.3%
- 2008→2024 swing
- -7.4pp toward R · 2008: 40.4pp · 2024: 32.9pp
- All cycles
- 2024: D+32.9 2020: D+44.2 2016: D+48.0 2012: D+40.0 2008: D+40.4
Not yet ingested
- Civics
- —
Market trends
- HPI YoY
- ▼ -755.95%
- Current HPI
- 334.9041
- Rent YoY
- ▲ 3.25%
- Metro
- Los Angeles-Long Beach-Anaheim, CA
- State GDP YoY
- ▲ 3.21%
- F500 in state
- 116
Industry mix (Fortune 500 HQ in CA)
| Industry | F500 HQs | Revenue |
|---|---|---|
| Technology | 27 | $1,492B |
|
||
| Financial Services | 3 | $174B |
|
||
| Retail | 3 | $44B |
|
||
| Insurance | 3 | $26B |
|
||
| Media / Entertainment | 2 | $115B |
|
||
| Pharmaceuticals / Biotech | 2 | $62B |
|
||
Price history
+125.7% since first listed28 events — show timeline
- 2026-02-21 Price Changed $39,500 CRMLS
- 2025-12-04 Listed $45,000 CRMLS
- 2025-12-01 Listing Removed — CRMLS
- 2025-11-25 Price Changed $45,000 CRMLS
- 2025-09-30 Listed $49,999 CRMLS
- 2025-09-22 Listing Removed — CRMLS
- 2025-09-17 Price Changed $49,999 CRMLS
- 2025-08-22 Price Changed $54,000 CRMLS
- 2025-08-21 Price Changed $58,000 CRMLS
- 2025-07-11 Price Changed $60,000 CRMLS
- 2025-07-10 Listed $58,000 CRMLS
- 2025-07-09 Coming Soon — CRMLS
- 2025-06-30 Listing Removed — CRMLS
- 2025-05-29 Price Changed $50,900 CRMLS
- 2025-02-07 Price Changed $53,000 CRMLS
- 2025-01-15 Listed $55,000 CRMLS
- 2024-12-18 Listing Removed — CRMLS
- 2024-11-20 Price Changed $55,000 CRMLS
- 2024-10-31 Price Changed $51,000 CRMLS
- 2024-09-24 Price Changed $55,000 CRMLS
- 2024-09-20 Price Changed $57,000 CRMLS
- 2024-09-14 Price Changed $59,000 CRMLS
- 2024-08-30 Price Changed $60,000 CRMLS
- 2024-08-15 Price Changed $62,000 CRMLS
- 2024-08-01 Price Changed $67,000 CRMLS
- 2024-07-18 Listed $75,000 CRMLS
- 2022-12-29 Relisted — CRMLS
- 2022-12-12 Listed $17,500 CRMLS
Cash-flow waterfall
monthlySold comps — $/sqft
last 12 mo · ≤1 miLoading sold comps…