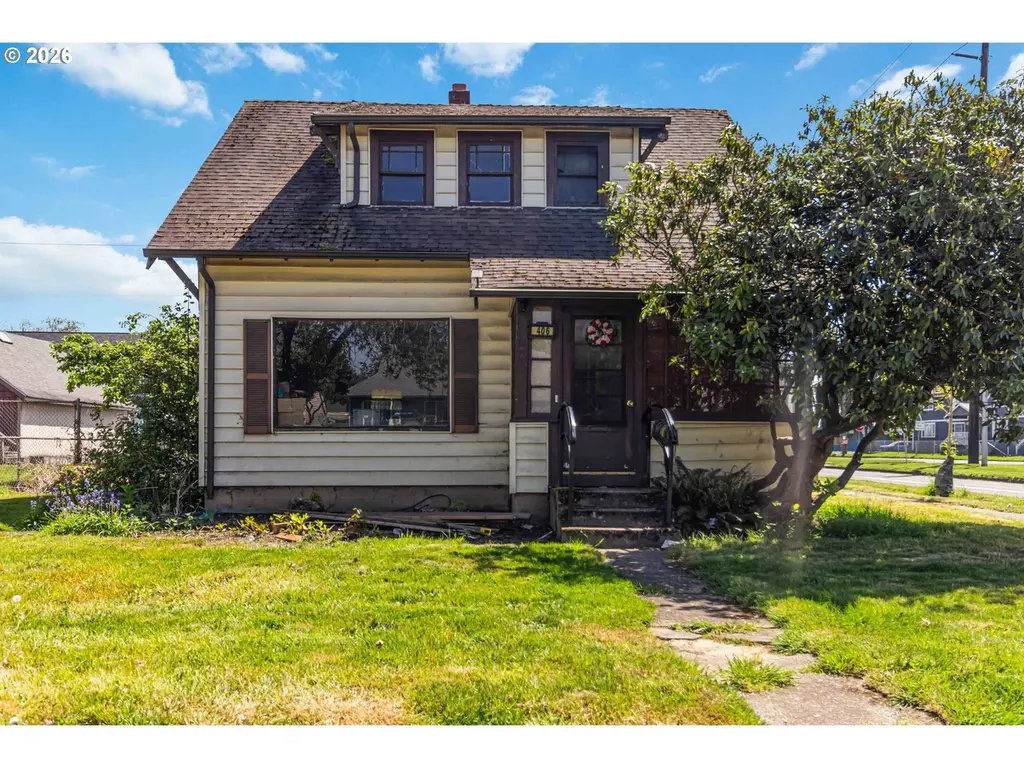
406 15th Ave · Longview, WA
Flood risk 1/10 · Minimal
- FEMA flood zone
- X
- Chance of flooding over 30 yrs
- 0.0%
- Est. flood insurance / yr
- $473 – $860
Fire risk 1/10 · Minimal
- Est. fire insurance / yr
- $604 – $1,122
Heat risk 3/10 · Minor
- Hot days now (above 89°F)
- 7 days/yr
- Hot days in 30 yrs
- 14 days/yr
Wind risk 1/10 · Minimal
- Chance of severe wind over 30 yrs
- —
Air-quality risk 7/10 · Major
- Unhealthy air days now
- 9 days/yr
- Unhealthy air days in 30 yrs
- 10 days/yr
Risk factors via First Street. Map © Google.
Why this score? — see what drove the C- grade
The composite is a weighted blend of 9 inputs, each scored 0–100. Each bar is that input's sub-score; the figure is the points it added to the 100-point composite (weight × sub-score).
- ARV discount +15.0/15.0
- Cash flow +14.4/30.0
- DSCR +4.4/10.0
- 1% rule +4.0/10.0
- Schools +4.0/10.0
- Livability +3.6/5.0
- Rent growth +3.1/5.0
- Condition / age +2.5/5.0
- Appreciation +0.0/10.0
$198,000
🖨 Deal sheet 📄 Offer letter ✓ Due diligence
Listing remarks MLS
Great layout with solid bones-- an investors dream! This home was a stunner in its time with large living spaces, high ceilings, huge windows, adorable dining area and more. The primary bedroom is on the main floor with attached half bath, and the other two bedrooms boast large square footage and walk in closets. The unfinished basement and detached garage add additional storage. To make this home even sweeter, in the fenced backyard you'll find fruit producing apple and plum trees. New electrical panel. Appraised for $220,000.
Key facts
- 5,998 sq ft lot
- Garage
- Built 1935
Property features AI
Finance
- Other: Senior property tax exemption available
- Financial info: Listing terms: Cash
Exterior
- Parking: Detached garage (1 covered space); Driveway and off-street parking
- Security: Partially fenced
- Utilities: Public water; Sewer connected; Electric and oil energy sources; Power by Cowlitz PUD
- Home design: Single-family detached house; Two stories; Main-level entry
- Construction: Wood construction; Composition roof
- Exterior features: Partial fencing; Wood exterior products; Corner lot with paved surfaces and sidewalks
Interior
- Kitchen: Refrigerator; Stove/Range
- Bedrooms: 3 bedrooms (2 upper, 1 main)
- Flooring: Hardwood; Laminate
- Bathrooms: 1 full bath; 1 half bath; One bathtub and one shower
- Heating & cooling: Forced air heating; No central cooling
- Interior features: Dining room; Walk-in closet(s)
- Laundry & utility: Unfinished basement (utility space)
Neighborhood map
What this means for you Summary
Snapshot
- This is a 3-bed/1.5-bath single-family listed at $198k.
Deal economics
- At list price, monthly cash flow is $42 ($500/yr) — positive.
- The deal already cash-flows at list — no discount required.
- To meet the 1% rule (rent ≥ 1% of price), the offer needs to be $178k (9.9% below list).
- Recommended offer: $178k (9.9% below list) — sets the bar for 1% rule.
- Cap rate 6.5% vs local median 3.0% in Longview — top-decile yield for the area; either an underpriced asset or a hidden risk that comps aren't pricing in. Stress-test before assuming the spread holds.
Location & tenants
- Location reads 71/100 on livability (#228 in WA) — a middle-class / working-renter tenant base. Strengths: housing A+, health & safety A+, cost of living A-; Watch: crime C-, employment D+, commute F.
- Longview School District (urban): math 40% / reading 51% proficiency, ranked #185 of 291 in WA (top 64%) — families likely to look elsewhere, expect single-tenant / working-renter base with shorter leases.
- Zoned schools: Kessler Elementary School (289 students, 85% FRL); Mark Morris High School (914 students, 54% FRL) — zoned schools average 70% FRL vs 54% district-wide (15 pts higher); higher-poverty schools than district average — tighter screening recommended.
- Market conditions: Rents rising (+2.6%/yr); 356 active listings in the ZIP; 1 comparable units currently listed for rent nearby; 348 units permitted in Cowlitz County in 2024 (40 in 5+ unit buildings).
- This rent runs 32% of the median local income ($66k/yr) — at the standard rent-burdened threshold; future hikes will face affordability resistance.
Forward outlook
- Local home prices are declining (-3.0%/yr); year-one equity from $1k of loan paydown is wiped out by about $6k of value loss. Plan a longer hold.
- Cowlitz County population projected to shrink 8% by 2050 — rents likely to lag national; underwrite the cash flow, not the appreciation.
Negotiation context
- It's been on market 43 days — a 3% lower offer ($192k) is reasonable based on typical stale-listing flexibility.
- 2 sale attempts; this cycle's ask has dropped $22k (10%) from the opening price — seller is motivated, your offer sets the floor, not the list.
Risks & watch-outs
- Watch-outs: built in 1935 — expect roof / HVAC / electrical / plumbing capex.
Questions for the listing agent
- It's been on market 43 days. Have you received any prior offers? Is the seller open to a 10% concession, seller financing, or rate buy-down credit?
- Built in 1935 — when were the roof, HVAC, electrical panel, plumbing, and water heater last replaced?
- Is there a deadline driving the sale (1031 exchange, divorce, estate, relocation)? That informs how much negotiation room exists.
- What's the average days-on-market for RENTAL listings here right now (not sales)? A rising rental-DOM trend means longer vacancies and softer asking-rent achievability than the comps imply.
- What's the recent tenant-quality profile in this submarket — average credit score on applications, eviction rate, late-payment / NSF rate, and stable-employment percentage? A property-management company in the area should have these aggregated.
- How much new for-sale + rental construction is in the pipeline within 1–3 miles? Heavy new supply typically softens prices + rents 12–24 months out; constrained supply supports both.
Investment metrics
- 1% rule
- 0.90% ✗
- Cap rate
- 6.55%
- Cash-on-cash
- 0.90%
- DSCR
- 1.04
- GRM
- 9.2
CMA / ARV
- ARV (median comp)
- $319,483
- List price
- $198,000
- Delta
- -31.14%
- Verdict
- UNDERPRICED
- Comps
- 20 within 1.0 mi
Show comp detail 12 sales within ~0.75 mi
| Address | Dist | Beds/Ba | Sqft | Sold | Price | $/sf | Match |
|---|---|---|---|---|---|---|---|
| 511 15th Ave | 0.17mi | 4/2.0 (+1) | 1,440 (-6%) | 3mo | $245,000 | $170 | 72 |
| 567 20th Ave | 0.42mi | 3/2.0 | 1,532 (-0%) | 9mo | $380,000 | $248 | 70 |
| 567 Oregon Way | 0.28mi | 3/2.0 | 1,447 (-6%) | 7mo | $332,500 | $230 | 69 |
| 159 16th Ave | 0.27mi | 2/2.0 (-1) | 1,390 (-9%) | 0mo | $166,500 | $120 | 64 |
| 447 22nd Ave | 0.45mi | 3/2.0 | 1,444 (-6%) | 4mo | $379,900 | $263 | 64 |
| 520 24th Ave | 0.56mi | 4/1.5 (+1) | 1,568 (+2%) | 2mo | $421,200 | $269 | 64 |
| 467 22nd Ave | 0.46mi | 4/1.0 (+1) | 1,512 (-2%) | 9mo | $349,000 | $231 | 62 |
| 421 24th Ave | 0.56mi | 3/1.0 | 1,464 (-5%) | 4mo | $356,500 | $244 | 61 |
| 467 19th Ave | 0.29mi | 3/1.5 | 1,347 (-12%) | 6mo | $350,000 | $260 | 61 |
| 537 26th Ave | 0.71mi | 3/2.0 | 1,485 (-3%) | 6mo | $390,500 | $263 | 55 |
| 656 22nd Ave | 0.57mi | 4/1.0 (+1) | 1,640 (+7%) | 8mo | $392,000 | $239 | 48 |
| 516 26th Ave | 0.67mi | 4/2.0 (+1) | 1,644 (+7%) | 9mo | $415,000 | $252 | 43 |
Match score weights: distance 35% · size 25% · config 20% · recency 20%. Top-matched comps best support the ARV.
Projected returns pro-forma
-3.0% appreciation · 2.59% rent growth · sell at horizon
- IRR
- -15.3%
- Equity multiple
- 0.46×
- Total profit
- $-30,137
- Equity at exit
- $29,522
- IRR
- -7.5%
- Equity multiple
- 0.54×
- Total profit
- $-25,701
- Equity at exit
- $17,119
Cash invested: $55,440 (down + closing). Projections, not guarantees.
Landlord ↔ Tenant lean methodology
- Overall (STATE)
- 28 Tenant-Leaning
- State Washington
- 28 Tenant-Leaning · D+8
- County
- — inherits STATE
- City
- — inherits STATE
ZIP-level market 98632
- Rents YoY
- 2.6%
- Active inventory
- 356
- Price-to-rent
- 9.2×
Monthly cashflow live
- Estimated rent
- $1,785 medium interval (Pro) →
- Mortgage (P&I)
- −$1,038
- Tax est. 1.5%
- −$248 /mo · $2,970/yr
- Insurance
- −$82
- HOA
- −$0
- Vacancy / Maint / Mgmt
- −$375
- Net cashflow
- $42
Break-even live
UW: 25.0% down · 7.5% · 30yr · 1.5% tax · 5.0% vac · 8.0% maint · 8.0% mgmt
Financing live
Cash to close
- Down payment
- $49,500
- Closing costs
- $5,940
- Reserves months
- —
- Total cash needed
- —
Loan-product check · same deal, 3 products live
Conventional
25% down · 7.5% · 30yr
- Down + closing
- —
- Monthly P&I
- —
- Monthly cashflow
- —
- DSCR
- —
- Eligible?
- —
Personal DTI + credit; lowest rate.
DSCR
20% down · 8.5% · 30yr
- Down + closing
- —
- Monthly P&I
- —
- Monthly cashflow
- —
- DSCR
- —
- Eligible?
- —
No personal income docs; deal must DSCR.
Hard money
10% down · 12.0% · 12mo
- Down + closing
- —
- Monthly P&I
- —
- Monthly cashflow
- —
- DSCR
- —
- Eligible?
- —
Short-term bridge; refi at stabilization.
Rent comps 1 comps
| Address | Beds | Baths | Sqft | Rent | $/sqft | DOM | Units | Dist |
|---|---|---|---|---|---|---|---|---|
| 228 25th Ave Unit 201 Longview, WA | 3.0 | 1.0 | 1100 | $1,350 | $1.23 | 11d | 1 | 0.67mi |
Listing history 19 events
-
2026-06-19days on market $198,000 Active 43 DOM
-
2026-06-18price $198,000 Active 42 DOM
-
2026-06-18days on market $220,000 Active 42 DOM
-
2026-06-17days on market $220,000 Active 41 DOM
-
2026-06-16days on market $220,000 Active 40 DOM
-
2026-06-15days on market $220,000 Active 39 DOM
-
2026-06-14days on market $220,000 Active 37 DOM
-
2026-06-13days on market $220,000 Active 36 DOM
-
2026-06-10days on market $220,000 Active 34 DOM
-
2026-06-09days on market $220,000 Active 33 DOM
-
2026-06-08days on market $220,000 Active 32 DOM
-
2026-06-07days on market $220,000 Active 31 DOM
-
2026-06-05days on market $220,000 Active 28 DOM
-
2026-06-02days on market $220,000 Active 26 DOM
-
2026-06-01days on market $220,000 Active 25 DOM
-
2026-05-31days on market $220,000 Active 24 DOM
-
2026-05-30days on market $220,000 Active 23 DOM
-
2026-05-07$220,000 Active
Show marketing remark (533 chars)
Great layout with solid bones-- an investors dream! This home was a stunner in its time with large living spaces, high ceilings, huge windows, adorable dining area and more. The primary bedroom is on the main floor with attached half bath, and the other two bedrooms boast large square footage and walk in closets. The unfinished basement and detached garage add additional storage. To make this home even sweeter, in the fenced backyard you'll find fruit producing apple and plum trees. New electrical panel. Appraised for $220,000.
-
2026-05-07$220,000 Active 533-char remark
Show marketing remark (533 chars)
Great layout with solid bones-- an investors dream! This home was a stunner in its time with large living spaces, high ceilings, huge windows, adorable dining area and more. The primary bedroom is on the main floor with attached half bath, and the other two bedrooms boast large square footage and walk in closets. The unfinished basement and detached garage add additional storage. To make this home even sweeter, in the fenced backyard you'll find fruit producing apple and plum trees. New electrical panel. Appraised for $220,000.
ⓘ Source: listings_history table (triggers on properties + properties_extension) + one-shot
backfill from property_details.listing_events for pre-trigger history.
Climate risk First Street
- Flood 1/10 Low FEMA zone X · 0% chance over 30 yrs
- Wildfire 1/10 Low
- Heat 3/10 Moderate 7 d/yr ≥89°F today · 14 d/yr by 30 yrs out
- Wind 1/10 Low
- Air quality 7/10 Severe 9 unhealthy d/yr today · 10 by 30 yrs out
Nearby sold comps map
Loading sold comps map…
Walkable amenities ~0.75 mi
Loading nearby amenities…
Taxation est. · year 1
- Rental income
- $21,418
- − Mortgage interest
- −$11,091
- − Property taxes
- −$2,970
- − Insurance
- −$990
- − Repairs & maintenance
- −$1,713
- − Management
- −$1,713
- − Depreciation
- −$5,760
- Taxable loss
- −$2,820
- Est. tax savings @ 24.0%
- +$677
- After-tax cash flow
- $1,177/yr
For passive investors: Depreciation is non-cash, so a rental often shows a tax loss while cash-flowing — sheltering income. Rental losses are passive: they offset passive income freely, and up to $25,000/yr can offset ordinary (W-2) income if you actively participate and your MAGI is under $100k (phasing out to $0 by $150k); unused losses carry forward. On sale, claimed depreciation is recaptured at up to 25%, and gains may owe capital-gains tax (a 1031 exchange can defer both). Figures are a year-1 estimate at your 24.0% rate — not tax advice; consult a CPA.
Schools (NCES district)
- District
- Longview School District
- NCES district ID
- 5304470
- Math proficiency
- 40% ▲ 1.00%
- Reading proficiency
- 51% ▲ 3.00%
- Median HH income
- $41,324
- Composite
- 40.41/100
- National rank
- #7732
- State rank
- #185 of 291 in WA
Livability — Longview
- Score
- 71/100
- State rank
- #228
- US rank
- #6972
Category grades
Schools grade is shown separately in the Schools card above.
Census & demographics
- Census place
- Longview, WA
- County
- Cowlitz County · 77,527 people
- City population
- 50,635
- Metro
- Longview, WA
- Population (ZIP)
- 50,635
- Household income
- $66,305
- Rent vs Own
- Severe rent burden
- 2224.0
Population outlook (Cowlitz County) Hauer SSP2
- Today (2025)
- 104,780 people
- By 2030
- 103,980 · -0.8%
- By 2040
- 100,769 · -3.8%
- By 2050
- 96,685 · -7.7%
- By 2075
- 86,454 · -17.5%
- By 2100
- 74,052 · -29.3%
Race, ethnicity, and origin ACS 2023
- Neighborhood character
- Predominantly White (78%)
- Race & ethnicity
- White 78% Hispanic / Latino 12% Two or more races 11% Asian 2% Native American 1%
- Hispanic origin (detail)
- Mexican 10%
- Common ancestry
- Portuguese 5% Lithuanian 3% Italian 3%
- Foreign-born
- 4% · Canada, Vietnam
- Languages at home
- 91% English-only · Spanish 7% Other Asian/Pacific 1%
Political lean MEDSL · Cowlitz
- 2024 margin
- R (+19.9) · D 38.7% · R 58.6% · Other 2.7%
- 2008→2024 swing
- -31.1pp toward R · 2008: 11.2pp · 2024: -19.9pp
- All cycles
- 2024: R+19.9 2020: R+17.4 2016: R+13.7 2012: D+4.4 2008: D+11.2
Not yet ingested
- Civics
- —
Market trends
- HPI YoY
- ▼ -479.09%
- Current HPI
- 230.8501
- Rent YoY
- ▲ 2.59%
- Metro
- Longview, WA
- State GDP YoY
- ▲ 4.65%
- F500 in state
- 22
Industry mix (Fortune 500 HQ in WA)
| Industry | F500 HQs | Revenue |
|---|---|---|
| Retail | 2 | $269B |
|
||
| Technology / Retail | 1 | $638B |
|
||
| Technology | 1 | $245B |
|
||
| Telecommunications | 1 | $38B |
|
||
| Food / Beverage | 1 | $36B |
|
||
| Automotive / Trucks | 1 | $34B |
|
||
Price history
+0.0% since first listed2 events — show timeline
- 2026-05-07 Listed $220,000 RMLS
- 2026-05-07 Listed $220,000 NWMLS as Distributed by MLS Grid
Property tax history
-4.9%/yrLatest (2026): $240 · +12.5% YoY. Source: county tax records.
Cash-flow waterfall
monthlySold comps — $/sqft
last 12 mo · ≤1 miLoading sold comps…