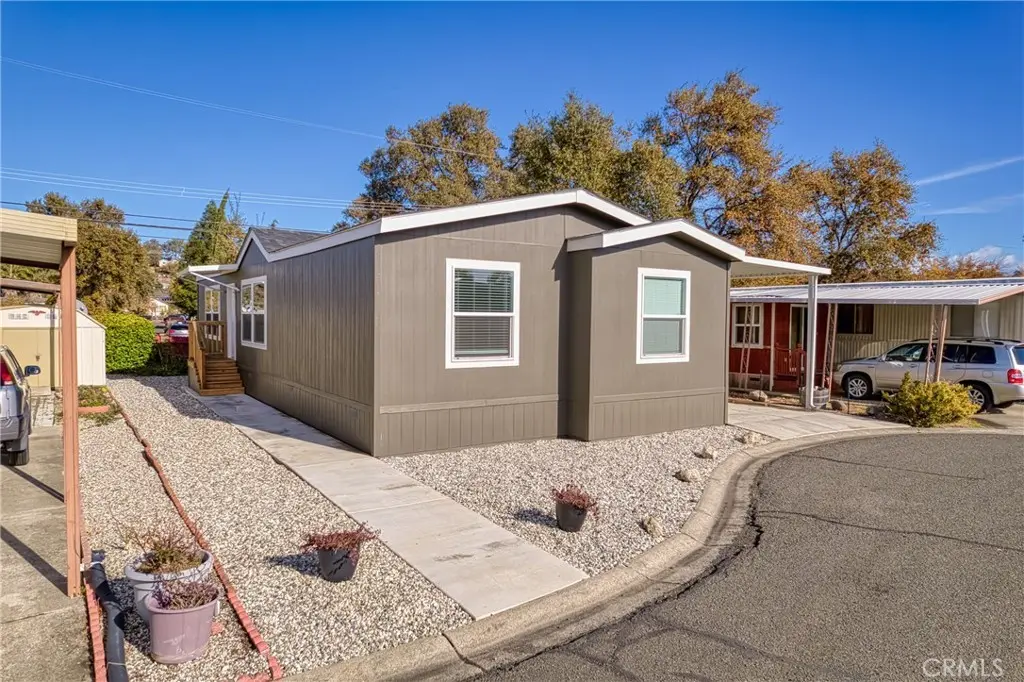
1025 Martin St #2 · Lakeport, CA
Flood risk 1/10 · Minimal
- FEMA flood zone
- X (unshaded)
- Chance of flooding over 30 yrs
- 0.0%
- Est. flood insurance / yr
- $507 – $1,088
Fire risk 8/10 · Major
- Est. fire insurance / yr
- $659 – $1,223
Heat risk 5/10 · Moderate
- Hot days now (above 103°F)
- 7 days/yr
- Hot days in 30 yrs
- 14 days/yr
Wind risk 1/10 · Minimal
- Chance of severe wind over 30 yrs
- —
Air-quality risk 10/10 · Severe
- Unhealthy air days now
- 28 days/yr
- Unhealthy air days in 30 yrs
- 29 days/yr
Risk factors via First Street. Map © Google.
Why this score? — see what drove the C+ grade
The composite is a weighted blend of 9 inputs, each scored 0–100. Each bar is that input's sub-score; the figure is the points it added to the 100-point composite (weight × sub-score).
- Cash flow +30.0/30.0
- 1% rule +10.0/10.0
- DSCR +10.0/10.0
- ARV discount +5.0/15.0
- Livability +2.7/5.0
- Rent growth +2.5/5.0
- Condition / age +2.5/5.0
- Schools +1.9/10.0
- Appreciation +0.0/10.0
$129,900
🖨 Deal sheet 📄 Offer letter ✓ Due diligence
Listing remarks
This stunning, brand-new 2023 Champion Manufactured Home is move-in ready and waiting for you to make it your own. Located in the desirable Fairgrounds Village Mobile Home Park, this spacious double-wide home offers three bedrooms, two bathrooms, and 1,320 square feet of modern comfort. Inside, you’ll find a brand-new stove, refrigerator, dishwasher, and cabinetry, along with fresh paint, laminate flooring, and plush carpeting throughout. The home sits within a beautifully maintained senior community that offers excellent onsite management and access to shared amenities including a recreation room, kitchen, and laundry facilities. Fairgrounds Village MHP is a peaceful, solar-powered p
Key facts
- Solar powered park
- Recreation room
- Brand new
Tags
Property features AI
Finance
- Other: Access via paved county road; directions: Main St to Martin St
- Financial info: Land lease: $785 monthly (current)
- HOA & community: Located in a senior community; Park: Fairground Village MHP; Community offers watersports, lake access, fishing, hiking, biking and mountainous surroundings; Pets allowed (manager approval required)
Exterior
- Parking: Carport with space for 2 vehicles
- Utilities: Public/district water; Public sewer; 220V in kitchen and laundry; Electricity connected
- Home design: Mobile home (24' x 56'); Double wide; Single story; Turnkey condition; Has a view
- Construction: Composition roof; Mobile home remains on site
- Exterior features: No pool; Lot is level/flat
Interior
- Kitchen: Refrigerator; Electric range; Dishwasher
- Bedrooms: Primary bedroom
- Flooring: Carpet; Laminate flooring
- Bathrooms: 2 full bathrooms
- Heating & cooling: Central furnace heating; Central cooling
- Interior features: Laminate counters; One-level home; Front entry
- Laundry & utility: Inside laundry in a separate room
Neighborhood map
What this means for you Summary
Snapshot
- This is a 3-bed/2.0-bath land listed at $130k.
Deal economics
- At list price, monthly cash flow is $855 ($10k/yr) — positive.
- The deal already cash-flows at list — no discount required.
- Meets the 1% rule at list price ($2k rent vs $130k).
- Recommended offer: $126k (3.0% below list) — sets the bar for market timing.
- Cap rate 14.2% vs local median 3.3% in Lakeport — top-decile yield for the area; either an underpriced asset or a hidden risk that comps aren't pricing in. Stress-test before assuming the spread holds.
Location & tenants
- Location reads 54/100 on livability (#925 in CA) — a working-class tenant base; expect higher turnover. Strengths: housing A; Watch: health & safety C-, schools D+, employment D+.
- Lakeport Unified (town): math 13% / reading 30% proficiency, ranked #451 of 517 in CA (top 87%) — low school quality limits family demand, transient renter base, plan for 1-2y turnover.
- Market conditions: 148 active listings in the ZIP; 5 comparable units currently listed for rent nearby; rentals lingering (median 44d on market — plan ~5-8 weeks vacancy on turnover, expect pricing pressure); 100% of comp listings sitting > 30 days — soft ceiling on asking rent; 107 units permitted in Lake County in 2024 (40 in 5+ unit buildings).
- This rent runs 37% of the median local income ($71k/yr) — at the standard rent-burdened threshold; future hikes will face affordability resistance.
Forward outlook
- Local home prices are declining (-3.0%/yr); year-one equity from $898 of loan paydown is wiped out by about $4k of value loss. Plan a longer hold.
- Lake County population projected at -15% by 2050 — secular population decline; favor cash flow + early exit over multi-decade hold.
- At projected returns (-3.0% appreciation + 3.0% rent growth), your $36k cash investment doubles in ~5 years — after that, you're playing with house money.
Negotiation context
- It's been on market 49 days — a 3% lower offer ($126k) is reasonable based on typical stale-listing flexibility.
- 2 sale attempts with the ask held roughly flat each time — persistent listings suggest the price (not the market) is what's stuck; bring a comps-based counter.
Risks & watch-outs
- Climate carrying-cost: severe wildfire risk; extreme-heat days projected 7→14/yr by 2055 (HVAC capex compounding) — expect insurance premiums to compound above CPI over the hold.
Questions for the listing agent
- It's been on market 49 days. Have you received any prior offers? Is the seller open to a 3% concession, seller financing, or rate buy-down credit?
- Is there a deadline driving the sale (1031 exchange, divorce, estate, relocation)? That informs how much negotiation room exists.
- Schools are D-rated, which usually means shorter tenancies and higher turnover. Who's the typical renter profile here, and what's been the actual vacancy rate?
- Crime grade is F in this area — have there been break-ins, vandalism, or insurance claims at this property in the last 3 years? What carrier currently insures it and at what premium?
- What's the average days-on-market for RENTAL listings here right now (not sales)? A rising rental-DOM trend means longer vacancies and softer asking-rent achievability than the comps imply.
- What's the recent tenant-quality profile in this submarket — average credit score on applications, eviction rate, late-payment / NSF rate, and stable-employment percentage? A property-management company in the area should have these aggregated.
- How much new for-sale + rental construction is in the pipeline within 1–3 miles? Heavy new supply typically softens prices + rents 12–24 months out; constrained supply supports both.
Investment metrics
- 1% rule
- 1.71% ✓
- Cap rate
- 14.19%
- Cash-on-cash
- 28.22%
- DSCR
- 2.26
- GRM
- 4.9
CMA / ARV
- ARV (median comp)
- $123,151
- List price
- $129,900
- Delta
- 5.48%
- Verdict
- FAIR
- Comps
- 13 within 1.0 mi
Projected returns pro-forma
-3.0% appreciation · 3.0% rent growth · sell at horizon
- IRR
- 22.4%
- Equity multiple
- 1.92×
- Total profit
- $33,458
- Equity at exit
- $19,369
- IRR
- 30.5%
- Equity multiple
- 3.73×
- Total profit
- $99,414
- Equity at exit
- $11,231
Cash invested: $36,372 (down + closing). Projections, not guarantees.
Landlord ↔ Tenant lean methodology
- Overall (STATE)
- 18 Strongly Tenant-Friendly
- State California
- 18 Strongly Tenant-Friendly · D+13
- County
- — inherits STATE
- City
- — inherits STATE
ZIP-level market 95453
- Active inventory
- 148
- Price-to-rent
- 4.9×
Monthly cashflow live
- Estimated rent
- $2,219 high interval (Pro) →
- Mortgage (P&I)
- −$681
- Tax est. 1.5%
- −$162 /mo · $1,948/yr
- Insurance
- −$54
- HOA
- −$0
- Vacancy / Maint / Mgmt
- −$466
- Net cashflow
- $855
Break-even live
UW: 25.0% down · 7.5% · 30yr · 1.5% tax · 5.0% vac · 8.0% maint · 8.0% mgmt
Financing live
Cash to close
- Down payment
- $32,475
- Closing costs
- $3,897
- Reserves months
- —
- Total cash needed
- —
Loan-product check · same deal, 3 products live
Conventional
25% down · 7.5% · 30yr
- Down + closing
- —
- Monthly P&I
- —
- Monthly cashflow
- —
- DSCR
- —
- Eligible?
- —
Personal DTI + credit; lowest rate.
DSCR
20% down · 8.5% · 30yr
- Down + closing
- —
- Monthly P&I
- —
- Monthly cashflow
- —
- DSCR
- —
- Eligible?
- —
No personal income docs; deal must DSCR.
Hard money
10% down · 12.0% · 12mo
- Down + closing
- —
- Monthly P&I
- —
- Monthly cashflow
- —
- DSCR
- —
- Eligible?
- —
Short-term bridge; refi at stabilization.
Rent comps 5 comps
| Address | Beds | Baths | Sqft | Rent | $/sqft | DOM | Units | Dist |
|---|---|---|---|---|---|---|---|---|
| 10 Royale Ave Lakeport, CA | 2.0–3.0 | 2.0 | 1475 | $2,195 | $1.49 | 43d | 3 | 0.59mi |
| 10 Royale Ave #21 Lakeport, CA | 2.0 | 2.0 | 1225 | $2,195 | $1.79 | 43d | 1 | 0.59mi |
| 10 Royale Ave #17 Lakeport, CA | 2.0 | 2.0 | 1221 | $2,100 | $1.72 | 43d | 1 | 0.59mi |
| 595 9th St Lakeport, CA | 3.0 | 2.5 | 1596 | $1,900 | $1.19 | 43d | 1 | 0.60mi |
| 300 Grace Ln Lakeport, CA | 2.0 | 2.0 | 1200 | $2,500 | $2.08 | 43d | 1 | 0.60mi |
Listing history 23 events
-
2026-06-19days on market $129,900 Active 49 DOM
-
2026-06-18days on market $129,900 Active 48 DOM
-
2026-06-17days on market $129,900 Active 47 DOM
-
2026-06-16days on market $129,900 Active 46 DOM
-
2026-06-15days on market $129,900 Active 45 DOM
-
2026-06-14days on market $129,900 Active 43 DOM
-
2026-06-12days on market $129,900 Active 42 DOM
-
2026-06-09days on market $129,900 Active 39 DOM
-
2026-06-08days on market $129,900 Active 38 DOM
-
2026-06-07days on market $129,900 Active 37 DOM
-
2026-06-05days on market $129,900 Active 34 DOM
-
2026-06-03days on market $129,900 Active 33 DOM
-
2026-06-02days on market $129,900 Active 32 DOM
-
2026-06-01days on market $129,900 Active 31 DOM
-
2026-05-31days on market $129,900 Active 30 DOM
-
2026-05-30days on market $129,900 Active 29 DOM
-
2026-05-01$129,900 Active 1136-char remark
-
2026-03-12historical
-
2026-01-14price $139,900
-
2025-12-17price $145,900
-
2025-10-06price $154,900
-
2025-05-08price $159,900
-
2025-04-02$169,900 Active
ⓘ Source: listings_history table (triggers on properties + properties_extension) + one-shot
backfill from property_details.listing_events for pre-trigger history.
Climate risk First Street
- Flood 1/10 Low FEMA zone X (unshaded) · 0% chance over 30 yrs
- Wildfire 8/10 Severe
- Heat 5/10 Major 7 d/yr ≥103°F today · 14 d/yr by 30 yrs out
- Wind 1/10 Low
- Air quality 10/10 Extreme 28 unhealthy d/yr today · 29 by 30 yrs out
Nearby sold comps map
Loading sold comps map…
Walkable amenities ~0.75 mi
Loading nearby amenities…
Taxation est. · year 1
- Rental income
- $26,628
- − Mortgage interest
- −$7,276
- − Property taxes
- −$1,948
- − Insurance
- −$650
- − Repairs & maintenance
- −$2,130
- − Management
- −$2,130
- − Depreciation
- −$3,779
- Taxable income
- $8,714
- Est. tax owed @ 24.0%
- −$2,091
- After-tax cash flow
- $8,172/yr
For passive investors: Depreciation is non-cash, so a rental often shows a tax loss while cash-flowing — sheltering income. Rental losses are passive: they offset passive income freely, and up to $25,000/yr can offset ordinary (W-2) income if you actively participate and your MAGI is under $100k (phasing out to $0 by $150k); unused losses carry forward. On sale, claimed depreciation is recaptured at up to 25%, and gains may owe capital-gains tax (a 1031 exchange can defer both). Figures are a year-1 estimate at your 24.0% rate — not tax advice; consult a CPA.
Schools (NCES district)
- District
- Lakeport Unified
- NCES district ID
- 0620670
- Math proficiency
- 13% ▼ -8.00%
- Reading proficiency
- 30% ▲ 1.00%
- Median HH income
- $44,332
- Composite
- 18.55/100
- National rank
- #8912
- State rank
- #451 of 517 in CA
Livability — Lakeport
- Score
- 54/100
- State rank
- #925
- US rank
- #24236
Category grades
Schools grade is shown separately in the Schools card above.
Census & demographics
- Census place
- Lakeport, CA
- County
- Lake County · 24,333 people
- City population
- 11,741
- Metro
- Clearlake, CA
- Population (ZIP)
- 11,741
- Household income
- $71,419
- Rent vs Own
- Severe rent burden
- 250.0
Population outlook (Lake County) Hauer SSP2
- Today (2025)
- 62,396 people
- By 2030
- 60,626 · -2.8%
- By 2040
- 56,453 · -9.5%
- By 2050
- 53,054 · -15.0%
- By 2075
- 47,663 · -23.6%
- By 2100
- 41,804 · -33.0%
Race, ethnicity, and origin ACS 2023
- Neighborhood character
- Predominantly White (74%)
- Race & ethnicity
- White 74% Hispanic / Latino 14% Two or more races 9% Native American 5% Asian 1%
- Hispanic origin (detail)
- Mexican 10%
- Common ancestry
- Italian 3% Slovak 3% Romanian 2%
- Foreign-born
- 6% · Canada
- Languages at home
- 89% English-only · Spanish 9% Other Indo-European 1%
Political lean MEDSL · Lake
- 2024 margin
- Toss-up / Even · D 47.8% · R 49.2% · Other 3.0%
- 2008→2024 swing
- -20.6pp toward R · 2008: 19.3pp · 2024: -1.4pp
- All cycles
- 2024: R+1.4 2020: D+6.3 2016: D+3.7 2012: D+16.5 2008: D+19.3
Not yet ingested
- Civics
- —
Market trends
- HPI YoY
- ▼ -176.01%
- Current HPI
- 155.5391
- Rent YoY
- —
- Metro
- Clearlake, CA
- State GDP YoY
- ▲ 3.21%
- F500 in state
- 116
Industry mix (Fortune 500 HQ in CA)
| Industry | F500 HQs | Revenue |
|---|---|---|
| Technology | 27 | $1,492B |
|
||
| Financial Services | 3 | $174B |
|
||
| Retail | 3 | $44B |
|
||
| Insurance | 3 | $26B |
|
||
| Media / Entertainment | 2 | $115B |
|
||
| Pharmaceuticals / Biotech | 2 | $62B |
|
||
Price history
-23.5% since first listed7 events — show timeline
- 2026-05-01 Listed $129,900 CRMLS
- 2026-03-12 Listing Removed — CRMLS
- 2026-01-14 Price Changed $139,900 CRMLS
- 2025-12-17 Price Changed $145,900 CRMLS
- 2025-10-06 Price Changed $154,900 CRMLS
- 2025-05-08 Price Changed $159,900 CRMLS
- 2025-04-02 Listed $169,900 CRMLS
Property tax history
+7.5%/yrLatest (2025): $200 · +7.9% YoY. Source: county tax records.
Cash-flow waterfall
monthlySold comps — $/sqft
last 12 mo · ≤1 miLoading sold comps…