 Duplex
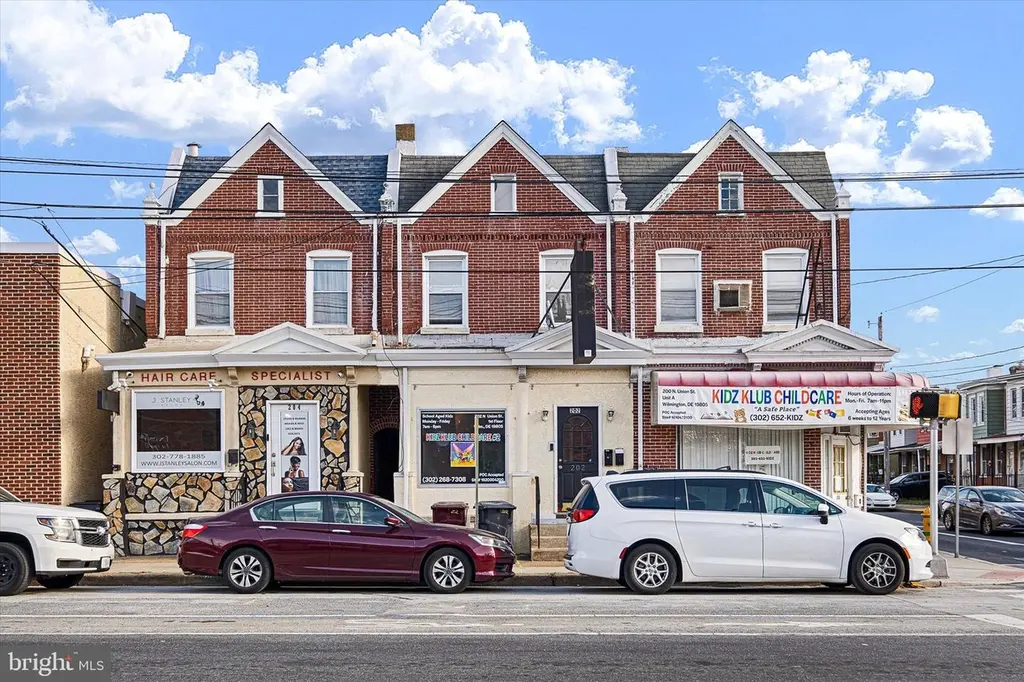
202 N Union St · Wilmington, DE
Flood risk No data
- FEMA flood zone
- —
- Chance of flooding over 30 yrs
- —
- Est. flood insurance / yr
- —
Fire risk No data
- Est. fire insurance / yr
- —
Heat risk No data
- Hot days now (above threshold)
- —
- Hot days in 30 yrs
- —
Wind risk No data
- Chance of severe wind over 30 yrs
- —
Air-quality risk No data
- Unhealthy air days now
- —
- Unhealthy air days in 30 yrs
- —
Risk factors via First Street. Map © Google.
Why this score? — see what drove the B- grade
The composite is a weighted blend of 9 inputs, each scored 0–100. Each bar is that input's sub-score; the figure is the points it added to the 100-point composite (weight × sub-score).
- Cash flow +30.0/30.0
- DSCR +10.0/10.0
- 1% rule +8.6/10.0
- ARV discount +7.1/15.0
- Rent growth +4.1/5.0
- Livability +3.2/5.0
- Schools +3.1/10.0
- Condition / age +2.5/5.0
- Appreciation +0.0/10.0
$225,000
🖨 Deal sheet 📄 Offer letter ✓ Due diligence
Multi-family units
County records classify this as Multi-Family (2-4 Unit). Listing-text estimate: 2 units. confirmed
Listing remarks MLS
Duplex right on Union Street! Cash producing property features an occupied commercial unit downstairs with long term tenants, and a well maintained occupied full one bedroom residential apartment upstairs. Both units are in good condition. The property is a great buy for any buy and hold investor, or a savvy occupant buyer looking for a house-hack opportunity.
Key facts
- 1,307 sq ft lot
- Built 1900
- Listed 188 days
Tags
Neighborhood map
What this means for you Summary
Snapshot
- This is a 1×1bd/1ba + 1×?bd/?ba units multifamily listed at $225k.
Deal economics
- At list price, monthly cash flow is $870 ($10k/yr) — positive. Per door: $435/mo.
- The deal already cash-flows at list — no discount required.
- Meets the 1% rule at list price ($3k rent vs $225k).
- Recommended offer: $198k (12.0% below list) — sets the bar for market timing.
- Cap rate 10.9% vs local median 5.6% in Wilmington — top-decile yield for the area; either an underpriced asset or a hidden risk that comps aren't pricing in. Stress-test before assuming the spread holds.
Location & tenants
- Location reads 64/100 on livability (#52 in DE) — a middle-class / working-renter tenant base. Strengths: cost of living A+, housing A; Watch: employment D+, schools D, commute D.
- Red Clay Consolidated School District (suburban): math 27% / reading 42% proficiency, ranked #12 of 26 in DE (top 46%) — families likely to look elsewhere, expect single-tenant / working-renter base with shorter leases.
- Market conditions: Rents rising fast (+6.3%/yr); 167 active listings in the ZIP; 40 comparable units currently listed for rent nearby; rentals at typical pace (median 19d on market — plan ~3-4 weeks tenant-placement turnaround); 1,367 units permitted in New Castle County in 2024 (201 in 5+ unit buildings).
- At $3,069/mo this rent would consume 61% of the median local household income ($60k/yr) (locally 1730% of renters already pay >50% of income on rent) — very limited rent-growth headroom before tenants either downsize or default.
Forward outlook
- Local home prices are declining (-3.0%/yr); year-one equity from $2k of loan paydown is wiped out by about $7k of value loss. Plan a longer hold.
- New Castle County population projected at +9% by 2050 — modest demand growth; plan on rents tracking national, not racing it.
- At projected returns (-3.0% appreciation + 6.3% rent growth), your $63k cash investment doubles in ~6 years — after that, you're playing with house money.
Negotiation context
- It's been on market 188 days — a 12% lower offer ($198k) is reasonable based on typical stale-listing flexibility.
- 4 sale attempts since 27y ago with the ask held roughly flat each time — persistent listings suggest the price (not the market) is what's stuck; bring a comps-based counter.
- Current owner paid $21k; list at $225k implies a 971% gain — meaningful room to come down on a strong offer.
Risks & watch-outs
- Watch-outs: built in 1900 — expect roof / HVAC / electrical / plumbing capex.
Questions for the listing agent
- It's been on market 188 days. Have you received any prior offers? Is the seller open to a 12% concession, seller financing, or rate buy-down credit?
- Can we see the unit-by-unit rent roll, current vacancy, and any below-market leases? What's the average tenancy length?
- What capital expenditures (roof, boiler, parking lot, exteriors) have been made in the last 5 years, and what's planned in the next 2?
- Built in 1900 — when were the roof, HVAC, electrical panel, plumbing, and water heater last replaced?
- Why hasn't it sold? Are there any deal-killer items the seller is aware of (foundation, flood, title, zoning, code violations)?
- Is there a deadline driving the sale (1031 exchange, divorce, estate, relocation)? That informs how much negotiation room exists.
- Schools are D-rated, which usually means shorter tenancies and higher turnover. Who's the typical renter profile here, and what's been the actual vacancy rate?
- Crime grade is F in this area — have there been break-ins, vandalism, or insurance claims at this property in the last 3 years? What carrier currently insures it and at what premium?
- What's the average days-on-market for RENTAL listings here right now (not sales)? A rising rental-DOM trend means longer vacancies and softer asking-rent achievability than the comps imply.
- What's the recent tenant-quality profile in this submarket — average credit score on applications, eviction rate, late-payment / NSF rate, and stable-employment percentage? A property-management company in the area should have these aggregated.
- How much new apartment / multifamily construction is in the pipeline within 1–3 miles? Heavy new supply (>2% of stock underway) typically softens rents 12–24 months out; light construction supports rent growth.
Investment metrics
- 1% rule
- 1.36% ✓
- Cap rate
- 10.93%
- Cash-on-cash
- 16.56%
- DSCR
- 1.74
- GRM
- 6.1
CMA / ARV
- ARV (median comp)
- $223,230
- List price
- $225,000
- Delta
- 0.79%
- Verdict
- FAIR
- Comps
- 20 within 1.0 mi
Show comp detail 1 sale within ~0.75 mi
| Address | Dist | Beds/Ba | Sqft | Sold | Price | $/sf | Match |
|---|---|---|---|---|---|---|---|
| 1230 Linden St | 0.59mi | 3/— (+1) | 1,825 (+11%) | 16mo | $240,000 | $132 | 37 |
Match score weights: distance 35% · size 25% · config 20% · recency 20%. Top-matched comps best support the ARV.
Projected returns pro-forma
-3.0% appreciation · 6.35% rent growth · sell at horizon
- IRR
- 11.4%
- Equity multiple
- 1.47×
- Total profit
- $29,663
- Equity at exit
- $33,548
- IRR
- 23.0%
- Equity multiple
- 3.29×
- Total profit
- $144,338
- Equity at exit
- $19,454
Cash invested: $63,000 (down + closing). Projections, not guarantees.
Landlord ↔ Tenant lean methodology
- Overall (STATE)
- 70 Landlord-Friendly
- State Delaware
- 70 Landlord-Friendly · D+7
- County
- — inherits STATE
- City
- — inherits STATE
ZIP-level market 19805
- Rents YoY
- 6.3%
- Active inventory
- 167
- Price-to-rent
- 12.1×
Monthly cashflow live
- Estimated rent
- $3,069 high interval (Pro) →
- Mortgage (P&I)
- −$1,180
- Tax est. 1.5%
- −$281 /mo · $3,375/yr
- Insurance
- −$94
- HOA
- −$0
- Vacancy / Maint / Mgmt
- −$644
- Net cashflow
- $870
Break-even live
2-unit breakdown (identical units grouped — click to expand)
| Units | Beds | Baths | Est. rent |
|---|---|---|---|
| 1× unit | 1 | 1 | $1,549 |
| 1× unit | 0 | 0 | $1,520 |
| Total (2 units) | $3,069 | ||
UW: 25.0% down · 7.5% · 30yr · 1.5% tax · 5.0% vac · 8.0% maint · 8.0% mgmt
Financing live
Cash to close
- Down payment
- $56,250
- Closing costs
- $6,750
- Reserves months
- —
- Total cash needed
- —
Loan-product check · same deal, 3 products live
Conventional
25% down · 7.5% · 30yr
- Down + closing
- —
- Monthly P&I
- —
- Monthly cashflow
- —
- DSCR
- —
- Eligible?
- —
Personal DTI + credit; lowest rate.
DSCR
20% down · 8.5% · 30yr
- Down + closing
- —
- Monthly P&I
- —
- Monthly cashflow
- —
- DSCR
- —
- Eligible?
- —
No personal income docs; deal must DSCR.
Hard money
10% down · 12.0% · 12mo
- Down + closing
- —
- Monthly P&I
- —
- Monthly cashflow
- —
- DSCR
- —
- Eligible?
- —
Short-term bridge; refi at stabilization.
Rent comps 40 comps
| Address | Beds | Baths | Sqft | Rent | $/sqft | DOM | Units | Dist |
|---|---|---|---|---|---|---|---|---|
| 219 S Union St Unit B Wilmington, DE | 1.0 | 1.0 | 1075 | $1,150 | $1.07 | 24d | 1 | 0.20mi |
| 115 N Clayton St Unit 115 Wilmington, DE | 3.0 | 1.5 | 1200 | $1,725 | $1.44 | 11d | 1 | 0.29mi |
| 618 N Scott St Wilmington, DE | 3.0 | 1.5 | 1400 | $1,850 | $1.32 | 43d | 1 | 0.31mi |
| 1815 Maple St Wilmington, DE | 3.0 | 1.5 | 1100 | $1,995 | $1.81 | 18d | 1 | 0.32mi |
| 1802 Maple St Wilmington, DE | 3.0 | 1.5 | 1250 | $2,500 | $2.00 | 24d | 1 | 0.35mi |
| 307 N Rodney St Wilmington, DE | 3.0 | 1.5 | 1425 | $2,000 | $1.40 | 43d | 1 | 0.37mi |
| 1607 Howland St Wilmington, DE | 3.0 | 1.0 | 1075 | $1,900 | $1.77 | 3d | 1 | 0.47mi |
| 1624 W 9th St Wilmington, DE | 3.0 | 2.5 | 1780 | $2,500 | $1.40 | 18d | 1 | 0.48mi |
| 1525 Beech St Wilmington, DE | 3.0 | 2.5 | 1850 | $2,400 | $1.30 | 5d | 1 | 0.50mi |
| 232 N Franklin St Wilmington, DE | 3.0 | 2.0 | 1150 | $1,795 | $1.56 | 43d | 1 | 0.56mi |
| 521 N Franklin St Wilmington, DE | 3.0 | 2.0 | 1500 | $1,850 | $1.23 | 3d | 1 | 0.57mi |
| 414 S Franklin St Wilmington, DE | 3.0 | 2.0 | 1195 | $1,895 | $1.59 | 43d | 1 | 0.63mi |
| 1110 Read St Wilmington, DE | 2.0 | 1.0 | 1100 | $1,250 | $1.14 | 20d | 1 | 0.66mi |
| 1936 Lakeview Rd Wilmington, DE | 3.0 | 1.0 | 1350 | $1,850 | $1.37 | 15d | 1 | 0.70mi |
| 1319 W 10th St Wilmington, DE | 2.0 | 3.0 | 2200 | $2,500 | $1.14 | 18d | 1 | 0.70mi |
| 1110 Maple St Wilmington, DE | 3.0 | 1.0 | 1525 | $1,600 | $1.05 | 43d | 1 | 0.72mi |
| 205 Porter St Wilmington, DE | 2.0 | 1.5 | 1200 | $1,700 | $1.42 | 15d | 1 | 0.73mi |
| 1016 Clayton Rd Wilmington, DE | 3.0 | 1.0 | 1150 | $1,850 | $1.61 | 5d | 1 | 0.73mi |
| 1122 Coyne Pl Wilmington, DE | 3.0 | 1.0 | 1350 | $1,950 | $1.44 | 43d | 1 | 0.77mi |
| 1000 W 8th St Unit 3 Wilmington, DE | 2.0 | 1.0 | 1050 | $1,695 | $1.61 | 24d | 1 | 0.80mi |
| 827 N Jackson St Unit 2 Wilmington, DE | 2.0 | 1.0 | 2250 | $1,545 | $0.69 | 12d | 1 | 0.84mi |
| 21 Stroud St Unit 1 Wilmington, DE | 3.0 | 1.5 | 1875 | $1,900 | $1.01 | 43d | 1 | 0.87mi |
| 25 Stroud St Wilmington, DE | 3.0 | 1.0 | 1200 | $1,795 | $1.50 | 3d | 1 | 0.88mi |
| 7 6th Ave Wilmington, DE | 3.0 | 2.0 | 1325 | $1,800 | $1.36 | 43d | 1 | 0.88mi |
| 1504 Delaware Ave Wilmington, DE | 2.0 | 1.0 | 1100 | $1,590 | $1.45 | 16d | 1 | 0.89mi |
| 1504 Delaware Ave Wilmington, DE | 2.0 | 1.0 | 1100 | $1,749 | $1.59 | 22d | 1 | 0.89mi |
| 1508 Maryland Ave Wilmington, DE | 3.0 | 1.5 | 1450 | $1,975 | $1.36 | 15d | 1 | 0.90mi |
| 1210 Delaware Ave Unit 3 Wilmington, DE | 2.0 | 1.0 | 1200 | $2,395 | $2.00 | 43d | 1 | 0.93mi |
| 715 W 8th St Wilmington, DE | 1.0 | 1.0 | 1750 | $1,150 | $0.66 | 43d | 1 | 0.95mi |
| 1501 N Broom St Unit 2/3 Wilmington, DE | 2.0 | 2.5 | 1250 | $2,500 | $2.00 | 5d | 1 | 0.96mi |
| 1207 Delaware Ave Wilmington, DE | 2.0 | 1.0 | 1200 | $1,700 | $1.42 | 11d | 1 | 0.97mi |
| 1301 N Harrison St Wilmington, DE | 1.0–2.0 | 1.0 | 1050 | $1,850 | $1.76 | 5d | 1 | 1.00mi |
| 1010 Trenton Pl Wilmington, DE | 3.0 | 1.5 | 1475 | $2,350 | $1.59 | 16d | 1 | 1.00mi |
| 231 5th Ave Wilmington, DE | 2.0 | 1.0 | 1050 | $1,350 | $1.29 | 43d | 1 | 1.02mi |
| 507 W 4th St Wilmington, DE | 3.0 | 1.5 | 1075 | $1,800 | $1.67 | 12d | 1 | 1.04mi |
| 331 Justison St Wilmington, DE | 1.0–2.0 | 1.0–2.0 | 859 | $2,205 | $2.57 | 1d | 9 | 1.07mi |
| 613 W 10th St Wilmington, DE | 2.0 | 1.0 | 1100 | $1,745 | $1.59 | 43d | 1 | 1.08mi |
| 3403 Lancaster Pike Wilmington, DE | 1.0–3.0 | 1.0 | 916 | $1,616 | $1.76 | 1d | 4 | 1.11mi |
| 530 Harlan Blvd #519 Wilmington, DE | 2.0 | 2.0 | 1192 | $2,250 | $1.89 | 24d | 1 | 1.12mi |
| 903 Shallcross Ave Wilmington, DE | 2.0 | 1.5 | 1575 | $2,195 | $1.39 | 24d | 1 | 1.17mi |
Listing history 23 events
-
2026-06-18days on market $225,000 Active 188 DOM
-
2026-06-17days on market $225,000 Active 187 DOM
-
2026-06-16days on market $225,000 Active 186 DOM
-
2026-06-15days on market $225,000 Active 185 DOM
-
2026-06-13days on market $225,000 Active 183 DOM
-
2026-06-13days on market $225,000 Active 182 DOM
-
2026-06-09days on market $225,000 Active 179 DOM
-
2026-06-08days on market $225,000 Active 178 DOM
-
2026-06-07days on market $225,000 Active 177 DOM
-
2026-06-04days on market $225,000 Active 174 DOM
-
2026-06-03days on market $225,000 Active 173 DOM
-
2026-06-02days on market $225,000 Active 172 DOM
-
2026-06-02price $225,000 Active 171 DOM
-
2026-06-01days on market $235,000 Active 171 DOM
-
2026-05-31days on market $235,000 Active 170 DOM
-
2026-04-06status Active 364-char remark
Show marketing remark (364 chars)
Duplex right on Union Street! Cash producing property features an occupied commercial unit downstairs with long term tenants, and a well maintained occupied full one bedroom residential apartment upstairs. Both units are in good condition. The property is a great buy for any buy and hold investor, or a savvy occupant buyer looking for a house-hack opportunity.
-
2026-03-11status Pending 364-char remark
Show marketing remark (364 chars)
Duplex right on Union Street! Cash producing property features an occupied commercial unit downstairs with long term tenants, and a well maintained occupied full one bedroom residential apartment upstairs. Both units are in good condition. The property is a great buy for any buy and hold investor, or a savvy occupant buyer looking for a house-hack opportunity.
-
2025-11-16$235,000 Active 364-char remark
Show marketing remark (364 chars)
Duplex right on Union Street! Cash producing property features an occupied commercial unit downstairs with long term tenants, and a well maintained occupied full one bedroom residential apartment upstairs. Both units are in good condition. The property is a great buy for any buy and hold investor, or a savvy occupant buyer looking for a house-hack opportunity.
-
2010-11-17historical
-
2010-05-17$217,500
-
1999-07-01soldstatus $21,000
-
1999-06-22historical
-
1999-06-21$21,000
ⓘ Source: listings_history table (triggers on properties + properties_extension) + one-shot
backfill from property_details.listing_events for pre-trigger history.
Nearby sold comps map
Loading sold comps map…
Walkable amenities ~0.75 mi
Loading nearby amenities…
Taxation est. · year 1
- Rental income
- $36,828
- − Mortgage interest
- −$12,603
- − Property taxes
- −$3,375
- − Insurance
- −$1,125
- − Repairs & maintenance
- −$2,946
- − Management
- −$2,946
- − Depreciation
- −$6,545
- Taxable income
- $7,287
- Est. tax owed @ 24.0%
- −$1,749
- After-tax cash flow
- $8,686/yr
For passive investors: Depreciation is non-cash, so a rental often shows a tax loss while cash-flowing — sheltering income. Rental losses are passive: they offset passive income freely, and up to $25,000/yr can offset ordinary (W-2) income if you actively participate and your MAGI is under $100k (phasing out to $0 by $150k); unused losses carry forward. On sale, claimed depreciation is recaptured at up to 25%, and gains may owe capital-gains tax (a 1031 exchange can defer both). Figures are a year-1 estimate at your 24.0% rate — not tax advice; consult a CPA.
Schools (NCES district)
- District
- Red Clay Consolidated School District
- NCES district ID
- 1001300
- Math proficiency
- 27% ▼ -11.00%
- Reading proficiency
- 42% ▼ -7.00%
- Median HH income
- $64,298
- Composite
- 31.25/100
- National rank
- #6027
- State rank
- #12 of 26 in DE
Livability — Wilmington
- Score
- 64/100
- State rank
- #52
- US rank
- #14251
Category grades
Schools grade is shown separately in the Schools card above.
Census & demographics
- Census place
- Wilmington, DE
- County
- New Castle County · 483,412 people
- City population
- 173,480
- Metro
- Philadelphia-Camden-Wilmington, PA-NJ-DE-MD
- Population (ZIP)
- 41,402
- Household income
- $60,221
- Rent vs Own
- Severe rent burden
- 1730.0
Population outlook (New Castle County) Hauer SSP2
- Today (2025)
- 594,686 people
- By 2030
- 609,164 · +2.4%
- By 2040
- 632,154 · +6.3%
- By 2050
- 649,068 · +9.1%
- By 2075
- 687,771 · +15.7%
- By 2100
- 694,961 · +16.9%
Race, ethnicity, and origin ACS 2023
- Neighborhood character
- Diverse neighborhood (Simpson 0.70)
- Race & ethnicity
- White 37% Black 32% Hispanic / Latino 25% Two or more races 10%
- Hispanic origin (detail)
- Mexican 10% Puerto Rican 10% Dominican 2%
- Common ancestry
- Romanian 4% Slovak 1% Italian 1%
- Foreign-born
- 9% · Canada
- Languages at home
- 79% English-only · Spanish 18% French/Haitian/Cajun 1% Arabic 1%
Political lean MEDSL · New Castle
- 2024 margin
- Solid D (+32.6) · D 65.5% · R 32.9% · Other 1.6%
- 2008→2024 swing
- -8.1pp toward R · 2008: 40.6pp · 2024: 32.6pp
- All cycles
- 2024: D+32.6 2020: D+37.1 2016: D+29.6 2012: D+34.1 2008: D+40.6
Not yet ingested
- Civics
- —
Market trends
- HPI YoY
- ▼ -291.16%
- Current HPI
- 259.1455
- Rent YoY
- ▲ 6.35%
- Metro
- Philadelphia-Camden-Wilmington, PA-NJ-DE-MD
- State GDP YoY
- —
- F500 in state
- 0
Price history
+1019.0% since first listed8 events — show timeline
- 2026-04-06 Relisted — BRIGHT MLS
- 2026-03-11 Pending — BRIGHT MLS
- 2025-11-16 Listed $235,000 BRIGHT MLS
- 2010-11-17 Listing Removed — BRIGHT MLS
- 2010-05-17 Listed $217,500 BRIGHT MLS
- 1999-07-01 Sold (MLS) $21,000 BRIGHT MLS
- 1999-06-22 Listing Removed — BRIGHT MLS
- 1999-06-21 Listed $21,000 BRIGHT MLS
Cash-flow waterfall
monthlySold comps — $/sqft
last 12 mo · ≤1 miLoading sold comps…