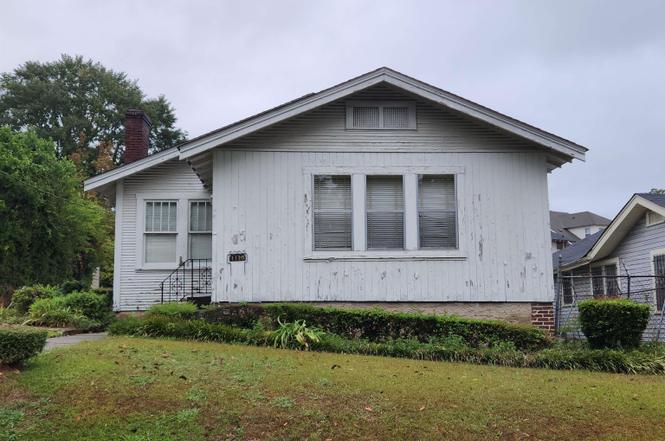
1120 Graymont Ave W · Birmingham, AL
Flood risk 1/10 · Minimal
- FEMA flood zone
- X (unshaded)
- Chance of flooding over 30 yrs
- 0.0%
- Est. flood insurance / yr
- $473 – $860
Fire risk 1/10 · Minimal
- Est. fire insurance / yr
- $916 – $1,700
Heat risk 7/10 · Major
- Hot days now (above 106°F)
- 7 days/yr
- Hot days in 30 yrs
- 19 days/yr
Wind risk 6/10 · Moderate
- Chance of severe wind over 30 yrs
- 27.0%
Air-quality risk 4/10 · Minor
- Unhealthy air days now
- 5 days/yr
- Unhealthy air days in 30 yrs
- 5 days/yr
Risk factors via First Street. Map © Google.
Why this score? — see what drove the B+ grade
The composite is a weighted blend of 9 inputs, each scored 0–100. Each bar is that input's sub-score; the figure is the points it added to the 100-point composite (weight × sub-score).
- Cash flow +30.0/30.0
- ARV discount +15.0/15.0
- 1% rule +10.0/10.0
- DSCR +10.0/10.0
- Appreciation +5.3/10.0
- Livability +3.4/5.0
- Rent growth +2.5/5.0
- Condition / age +2.5/5.0
- Schools +0.9/10.0
$75,000
🖨 Deal sheet 📄 Offer letter ✓ Due diligence
Listing remarks
INVESTOR/OWNER OPPORTUNITY in Graymont! Ready for restoration, this spacious home at 1120 Graymont Ave W is a blank canvas. Featuring 3 Bedrooms, 1.5 Baths, and approximately 1709 sqft of living space. ?Highlights include beautiful original hardwood floors, a classic brick fireplace with built-in shelving, a detached garage, and storage building. Embrace the charm with it's retro kitchen sink, counter, cabinets, and architectural details like the prominent brick chimney. The location is excellent, near Legion Field and historic Rickwood Field. personalize this home and unlock its full potential in a neighborhood full of history and revival! ?A perfect chance to customize and create value! B
Key facts
- Retro kitchen sink
- Brick fireplace
- Storage building
Tags
Neighborhood map
What this means for you Summary
Snapshot
- This is a 3-bed/1.0-bath single-family listed at $75k.
Deal economics
- At list price, monthly cash flow is $359 ($4k/yr) — positive.
- The deal already cash-flows at list — no discount required.
- Meets the 1% rule at list price ($1k rent vs $75k).
- Recommended offer: $66k (12.0% below list) — sets the bar for market timing.
- Cap rate 12.0% vs local median 6.2% in Birmingham — top-decile yield for the area; either an underpriced asset or a hidden risk that comps aren't pricing in. Stress-test before assuming the spread holds.
Location & tenants
- Location reads 67/100 on livability (#78 in AL) — a middle-class / working-renter tenant base. Strengths: commute A+, cost of living A+, housing A+; Watch: amenities C-, crime F, employment F.
- Birmingham City (urban): math 4% / reading 20% proficiency, ranked #116 of 129 in AL (top 90%) — low school quality limits family demand, transient renter base, plan for 1-2y turnover; 82% free/reduced lunch — lower-income household profile, screen leases tightly.
- Zoned schools: Minor Elementary School (math 0% / reading 14%, grade F, #601 of 627 statewide, top 98%, 454 students, 90% FRL).
- Market conditions: 64 active listings in the ZIP; 40 comparable units currently listed for rent nearby; rentals lingering (median 44d on market — plan ~5-8 weeks vacancy on turnover, expect pricing pressure); 52% of comp listings sitting > 30 days — soft ceiling on asking rent; lower-income renter base — watch delinquency; 2,114 units permitted in Jefferson County in 2024 (556 in 5+ unit buildings).
- This rent runs 39% of the median local income ($35k/yr) — at the standard rent-burdened threshold; future hikes will face affordability resistance.
Forward outlook
- In year one you build about $1k of equity ($519 loan paydown + $481 appreciation (0.6% local appreciation)).
- Jefferson County population projected to shrink 4% by 2050 — rents likely to lag national; underwrite the cash flow, not the appreciation.
- At projected returns (0.6% appreciation + 3.0% rent growth), your $21k cash investment doubles in ~4 years — after that, you're playing with house money.
Negotiation context
- It's been on market 154 days — a 12% lower offer ($66k) is reasonable based on typical stale-listing flexibility.
- 2 sale attempts with the ask held roughly flat each time — persistent listings suggest the price (not the market) is what's stuck; bring a comps-based counter.
Risks & watch-outs
- Watch-outs: built in 1930 — expect roof / HVAC / electrical / plumbing capex.
- Climate carrying-cost: major wind risk, 27% chance of damaging wind over 30y; extreme-heat days projected 7→19/yr by 2055 (HVAC capex compounding) — expect insurance premiums to compound above CPI over the hold.
Questions for the listing agent
- It's been on market 154 days. Have you received any prior offers? Is the seller open to a 12% concession, seller financing, or rate buy-down credit?
- Built in 1930 — when were the roof, HVAC, electrical panel, plumbing, and water heater last replaced?
- Why hasn't it sold? Are there any deal-killer items the seller is aware of (foundation, flood, title, zoning, code violations)?
- Is there a deadline driving the sale (1031 exchange, divorce, estate, relocation)? That informs how much negotiation room exists.
- Schools are F-rated, which usually means shorter tenancies and higher turnover. Who's the typical renter profile here, and what's been the actual vacancy rate?
- Crime grade is F in this area — have there been break-ins, vandalism, or insurance claims at this property in the last 3 years? What carrier currently insures it and at what premium?
- What's the average days-on-market for RENTAL listings here right now (not sales)? A rising rental-DOM trend means longer vacancies and softer asking-rent achievability than the comps imply.
- What's the recent tenant-quality profile in this submarket — average credit score on applications, eviction rate, late-payment / NSF rate, and stable-employment percentage? A property-management company in the area should have these aggregated.
- How much new for-sale + rental construction is in the pipeline within 1–3 miles? Heavy new supply typically softens prices + rents 12–24 months out; constrained supply supports both.
Investment metrics
- 1% rule
- 1.53% ✓
- Cap rate
- 12.04%
- Cash-on-cash
- 20.54%
- DSCR
- 1.91
- GRM
- 5.4
CMA / ARV
- ARV (on-the-fly)
- $120,768
- Comps found
- 12
Show comp detail 12 sales within ~0.75 mi
| Address | Dist | Beds/Ba | Sqft | Sold | Price | $/sf | Match |
|---|---|---|---|---|---|---|---|
| 1330 Bush Blvd W | 0.27mi | 3/1.0 | 1,523 (-7%) | 11mo | $170,000 | $112 | 67 |
| 2854 20th St W | 0.65mi | 3/1.5 | 1,634 (+0%) | 10mo | $62,000 | $38 | 60 |
| 1569 Graymont Ave W | 0.49mi | 3/1.5 | 1,656 (+2%) | 20mo | $48,550 | $29 | 56 |
| 820 7th St W | 0.47mi | 3/2.0 | 1,774 (+9%) | 5mo | $131,000 | $74 | 56 |
| 732 8th Ct W | 0.43mi | 3/2.0 | 1,696 (+4%) | 17mo | $157,000 | $93 | 55 |
| 704 9th Ct W | 0.66mi | 3/1.0 | 1,502 (-8%) | 1mo | $114,429 | $76 | 55 |
| 1424 2nd Ave W | 0.59mi | 2/1.0 (-1) | 1,744 (+7%) | 6mo | $19,000 | $11 | 51 |
| 1620 5th Ave W | 0.51mi | 3/2.0 | 1,436 (-12%) | 3mo | $220,000 | $153 | 49 |
| 3100 Pike Rd | 0.69mi | 3/1.0 | 1,461 (-10%) | 6mo | $81,000 | $55 | 45 |
| 882 6th St W | 0.61mi | 3/2.0 | 1,485 (-9%) | 14mo | $147,500 | $99 | 41 |
| 741 W 9th Ave | 0.50mi | 4/2.0 (+1) | 1,806 (+11%) | 11mo | $97,000 | $54 | 41 |
| 933 6th St W | 0.71mi | 2/2.0 (-1) | 1,392 (-15%) | 0mo | $35,000 | $25 | 33 |
Match score weights: distance 35% · size 25% · config 20% · recency 20%. Top-matched comps best support the ARV.
Projected returns pro-forma
0.64% appreciation · 3.0% rent growth · sell at horizon
- IRR
- 21.9%
- Equity multiple
- 2.10×
- Total profit
- $23,023
- Equity at exit
- $24,212
- IRR
- 25.3%
- Equity multiple
- 3.96×
- Total profit
- $62,165
- Equity at exit
- $31,126
Cash invested: $21,000 (down + closing). Projections, not guarantees.
Landlord ↔ Tenant lean methodology
- Overall (STATE)
- 90 Strongly Landlord-Friendly
- State Alabama
- 90 Strongly Landlord-Friendly · R+15
- County
- — inherits STATE
- City
- — inherits STATE
ZIP-level market 35204
- Home prices YoY
- 0.3%
- Active inventory
- 64
- Price-to-rent
- 5.4×
Monthly cashflow live
- Estimated rent
- $1,147 high interval (Pro) →
- Mortgage (P&I)
- −$393
- Tax from tax record
- −$122 /mo · $1,464/yr
- Insurance
- −$31
- HOA
- −$0
- Vacancy / Maint / Mgmt
- −$241
- Net cashflow
- $359
Break-even live
UW: 25.0% down · 7.5% · 30yr · 1.5% tax · 5.0% vac · 8.0% maint · 8.0% mgmt
Financing live
Cash to close
- Down payment
- $18,750
- Closing costs
- $2,250
- Reserves months
- —
- Total cash needed
- —
Loan-product check · same deal, 3 products live
Conventional
25% down · 7.5% · 30yr
- Down + closing
- —
- Monthly P&I
- —
- Monthly cashflow
- —
- DSCR
- —
- Eligible?
- —
Personal DTI + credit; lowest rate.
DSCR
20% down · 8.5% · 30yr
- Down + closing
- —
- Monthly P&I
- —
- Monthly cashflow
- —
- DSCR
- —
- Eligible?
- —
No personal income docs; deal must DSCR.
Hard money
10% down · 12.0% · 12mo
- Down + closing
- —
- Monthly P&I
- —
- Monthly cashflow
- —
- DSCR
- —
- Eligible?
- —
Short-term bridge; refi at stabilization.
Rent comps 40 comps
| Address | Beds | Baths | Sqft | Rent | $/sqft | DOM | Units | Dist |
|---|---|---|---|---|---|---|---|---|
| 1101 7th Ave W Birmingham, AL | 3.0 | 1.0 | 1248 | $1,250 | $1.00 | 43d | 1 | 0.04mi |
| 1119 Graymont Ave W Birmingham, AL | 3.0 | 1.0 | 1260 | $1,073 | $0.85 | 2d | 1 | 0.07mi |
| 612 12th St W Birmingham, AL | 3.0 | 1.5 | 1242 | $1,150 | $0.93 | 43d | 1 | 0.08mi |
| 1108 4th Ct W Birmingham, AL | 3.0 | 2.0 | 1623 | $1,125 | $0.69 | 3d | 1 | 0.25mi |
| 1230 4th Ter W Birmingham, AL | 3.0 | 2.0 | 1540 | $1,000 | $0.65 | 43d | 1 | 0.27mi |
| 827 6th Ave W Birmingham, AL | 3.0 | 1.0 | 1214 | $1,075 | $0.89 | 23d | 1 | 0.27mi |
| 724 4th Ct W Birmingham, AL | 3.0 | 1.0 | 1300 | $930 | $0.72 | 43d | 1 | 0.44mi |
| 617 7th St W Birmingham, AL | 3.0 | 1.5 | 1120 | $1,175 | $1.05 | 43d | 1 | 0.46mi |
| 1532 Graymont Ave W Birmingham, AL | 4.0 | 2.0 | 1913 | $1,150 | $0.60 | 43d | 1 | 0.49mi |
| 757 10th Ave W Birmingham, AL | 2.0 | 1.0 | 1136 | $1,000 | $0.88 | 43d | 1 | 0.58mi |
| 1701 4th Ter W Birmingham, AL | 4.0 | 2.5 | 1977 | $1,550 | $0.78 | 23d | 1 | 0.60mi |
| 1642 Graymont Ave W Birmingham, AL | 3.0 | 1.0 | 1219 | $1,090 | $0.89 | 3d | 1 | 0.64mi |
| 915 6th St W Birmingham, AL | 3.0 | 1.0 | 1332 | $1,075 | $0.81 | 43d | 1 | 0.65mi |
| 3113 Pike Rd Birmingham, AL | 3.0 | 2.0 | 1143 | $1,275 | $1.12 | 43d | 1 | 0.66mi |
| 854 5th St W Birmingham, AL | 3.0 | 1.0 | 1501 | $1,275 | $0.85 | 43d | 1 | 0.68mi |
| 410 8th Ter W Birmingham, AL | 3.0 | 1.0 | 1440 | $1,200 | $0.83 | 16d | 1 | 0.69mi |
| 1621 2nd Ct W Birmingham, AL | 3.0 | 1.0 | 1074 | $1,095 | $1.02 | 43d | 1 | 0.71mi |
| 644 Alabama Ave SW Birmingham, AL | 3.0 | 1.0 | 1274 | $1,125 | $0.88 | 23d | 1 | 0.76mi |
| 2920 24th Street Ensley Unit ENSLEY Birmingham, AL | 3.0 | 2.0 | 1800 | $1,050 | $0.58 | 23d | 1 | 0.77mi |
| 2309 Eufaula Ave Birmingham, AL | 4.0 | 2.0 | 1454 | $1,395 | $0.96 | 23d | 1 | 0.80mi |
| 608 Fulton Ave SW Birmingham, AL | 3.0 | 1.0 | 1271 | $1,300 | $1.02 | 43d | 1 | 0.82mi |
| 2304 Eufaula Ave Birmingham, AL | 3.0 | 1.0 | 1381 | $980 | $0.71 | 43d | 1 | 0.83mi |
| 719 Washington Ave SW Birmingham, AL | 3.0 | 1.0 | 1064 | $950 | $0.89 | 11d | 1 | 0.83mi |
| 405 11th St SW Unit B Birmingham, AL | 2.0 | 1.0 | 1065 | $800 | $0.75 | 43d | 1 | 0.90mi |
| 1720 Cullman Ave Unit 3 Birmingham, AL | 3.0 | 2.0 | 1174 | $950 | $0.81 | 43d | 1 | 0.90mi |
| 1720 Cullman Ave Unit 2 Birmingham, AL | 3.0 | 1.0 | 1174 | $899 | $0.77 | 21d | 1 | 0.90mi |
| 963 3rd St W Birmingham, AL | 3.0 | 2.0 | 1444 | $1,295 | $0.90 | 23d | 1 | 0.96mi |
| 1220 Alabama Ave SW Birmingham, AL | 3.0 | 1.5 | 1175 | $1,350 | $1.15 | 43d | 1 | 0.97mi |
| 2720 23rd Street Ensley Birmingham, AL | 4.0 | 2.0 | 1350 | $1,500 | $1.11 | 3d | 1 | 0.99mi |
| 2720 23rd Street Ensley Birmingham, AL | 4.0 | 2.0 | 1692 | $1,500 | $0.89 | 19d | 1 | 0.99mi |
| 1213 Alabama Ave SW Birmingham, AL | 4.0 | 2.0 | 1616 | $1,200 | $0.74 | 43d | 1 | 0.99mi |
| 2714 17th Street Ensley Birmingham, AL | 4.0 | 2.0 | 1976 | $1,553 | $0.79 | 3d | 1 | 1.02mi |
| 2712 24th Street Ensley Unit ENSLEY Birmingham, AL | 3.0 | 1.0 | 1232 | $1,099 | $0.89 | 23d | 1 | 1.03mi |
| 1217 Fulton Ave SW Birmingham, AL | 4.0 | 2.0 | 1397 | $1,395 | $1.00 | 43d | 1 | 1.06mi |
| 2621 20th Street Ensley Birmingham, AL | 3.0 | 1.0 | 1117 | $1,295 | $1.16 | 43d | 1 | 1.07mi |
| 2709 30th Street Ensley Birmingham, AL | 4.0 | 2.0 | 1410 | $1,323 | $0.94 | 2d | 1 | 1.09mi |
| 2609 20th Street Ensley Birmingham, AL | 3.0 | 2.0 | 1229 | $1,550 | $1.26 | 43d | 1 | 1.10mi |
| 2609 20th Street Ensley Birmingham, AL | 3.0 | 2.0 | 1500 | $1,550 | $1.03 | 3d | 1 | 1.10mi |
| 1437 Woodland Ave SW Birmingham, AL | 3.0 | 1.0 | 1369 | $1,100 | $0.80 | 3d | 1 | 1.13mi |
| 1012 Cotton Ave SW Birmingham, AL | 3.0 | 1.0 | 1232 | $1,000 | $0.81 | 43d | 1 | 1.17mi |
Listing history 4 events
-
2026-04-03status Pending
-
2026-01-29status Active
-
2026-01-29status Pending
-
2025-10-29$75,000 Active
ⓘ Source: listings_history table (triggers on properties + properties_extension) + one-shot
backfill from property_details.listing_events for pre-trigger history.
Tax reassessment forecast AL · Resets to sale price
- Current annual tax
- $1,464 · $122/mo
- Projected year-2 tax
- $1,464 · $122/mo
- Expected delta
- $0/yr ($0/mo · 0.0%)
ⓘ Screening estimate from a state-policy table — verify with the county assessor before closing.
Climate risk First Street
- Flood 1/10 Low FEMA zone X (unshaded) · 0% chance over 30 yrs
- Wildfire 1/10 Low
- Heat 7/10 Severe 7 d/yr ≥106°F today · 19 d/yr by 30 yrs out
- Wind 6/10 Major 27% chance of damaging wind over 30 yrs
- Air quality 4/10 Moderate 5 unhealthy d/yr today · 5 by 30 yrs out
Nearby sold comps map
Loading sold comps map…
Walkable amenities ~0.75 mi
Loading nearby amenities…
Taxation est. · year 1
- Rental income
- $13,763
- − Mortgage interest
- −$4,201
- − Property taxes
- −$1,464
- − Insurance
- −$375
- − Repairs & maintenance
- −$1,101
- − Management
- −$1,101
- − Depreciation
- −$2,182
- Taxable income
- $3,338
- Est. tax owed @ 24.0%
- −$801
- After-tax cash flow
- $3,512/yr
For passive investors: Depreciation is non-cash, so a rental often shows a tax loss while cash-flowing — sheltering income. Rental losses are passive: they offset passive income freely, and up to $25,000/yr can offset ordinary (W-2) income if you actively participate and your MAGI is under $100k (phasing out to $0 by $150k); unused losses carry forward. On sale, claimed depreciation is recaptured at up to 25%, and gains may owe capital-gains tax (a 1031 exchange can defer both). Figures are a year-1 estimate at your 24.0% rate — not tax advice; consult a CPA.
Schools (NCES district)
- District
- Birmingham City
- NCES district ID
- 0100390
- Math proficiency
- 4% ▼ -17.00%
- Reading proficiency
- 20% ▼ -4.00%
- Median HH income
- $31,988
- Composite
- 9.49/100
- National rank
- #9850
- State rank
- #116 of 129 in AL
Livability — Birmingham
- Score
- 67/100
- State rank
- #78
- US rank
- #10412
Category grades
Schools grade is shown separately in the Schools card above.
Census & demographics
- Census place
- Birmingham, AL
- County
- Jefferson County · 527,445 people
- City population
- 210,422
- Metro
- Birmingham-Hoover, AL
- Population (ZIP)
- 8,953
- Household income
- $35,420
- Rent vs Own
- Severe rent burden
- 422.0
Population outlook (Jefferson County) Hauer SSP2
- Today (2025)
- 669,185 people
- By 2030
- 669,694 · +0.1%
- By 2040
- 661,388 · -1.2%
- By 2050
- 643,086 · -3.9%
- By 2075
- 577,267 · -13.7%
- By 2100
- 474,758 · -29.1%
Race, ethnicity, and origin ACS 2023
- Neighborhood character
- Predominantly Black (86%)
- Race & ethnicity
- Black 86% White 7% Hispanic / Latino 5% Two or more races 2%
- Foreign-born
- 3% · Canada
- Languages at home
- 94% English-only · Spanish 5%
Political lean MEDSL · Jefferson
- 2024 margin
- D (+10.4) · D 54.6% · R 44.2% · Other 1.2%
- 2008→2024 swing
- +5.4pp toward D · 2008: 5.1pp · 2024: 10.4pp
- All cycles
- 2024: D+10.4 2020: D+13.2 2016: D+7.2 2012: D+6.0 2008: D+5.1
Not yet ingested
- Civics
- —
Market trends
- HPI YoY
- ▲ 0.64%
- Current HPI
- 201.0777
- Rent YoY
- —
- Metro
- Birmingham-Hoover, AL
- State GDP YoY
- ▲ 2.94%
- F500 in state
- 4
Industry mix (Fortune 500 HQ in AL)
| Industry | F500 HQs | Revenue |
|---|---|---|
| Financial Services | 1 | $8B |
|
||
| Healthcare | 1 | $5B |
|
||
Price history
4 events — show timeline
- 2026-04-03 Pending — Greater Alabama MLS
- 2026-01-29 Relisted — Greater Alabama MLS
- 2026-01-29 Pending — Greater Alabama MLS
- 2025-10-29 Listed $75,000 Greater Alabama MLS
Property tax history
+4.0%/yrLatest (2025): $1,464 · +0.0% YoY. Source: county tax records.
Cash-flow waterfall
monthlySold comps — $/sqft
last 12 mo · ≤1 miLoading sold comps…