 Multi-family
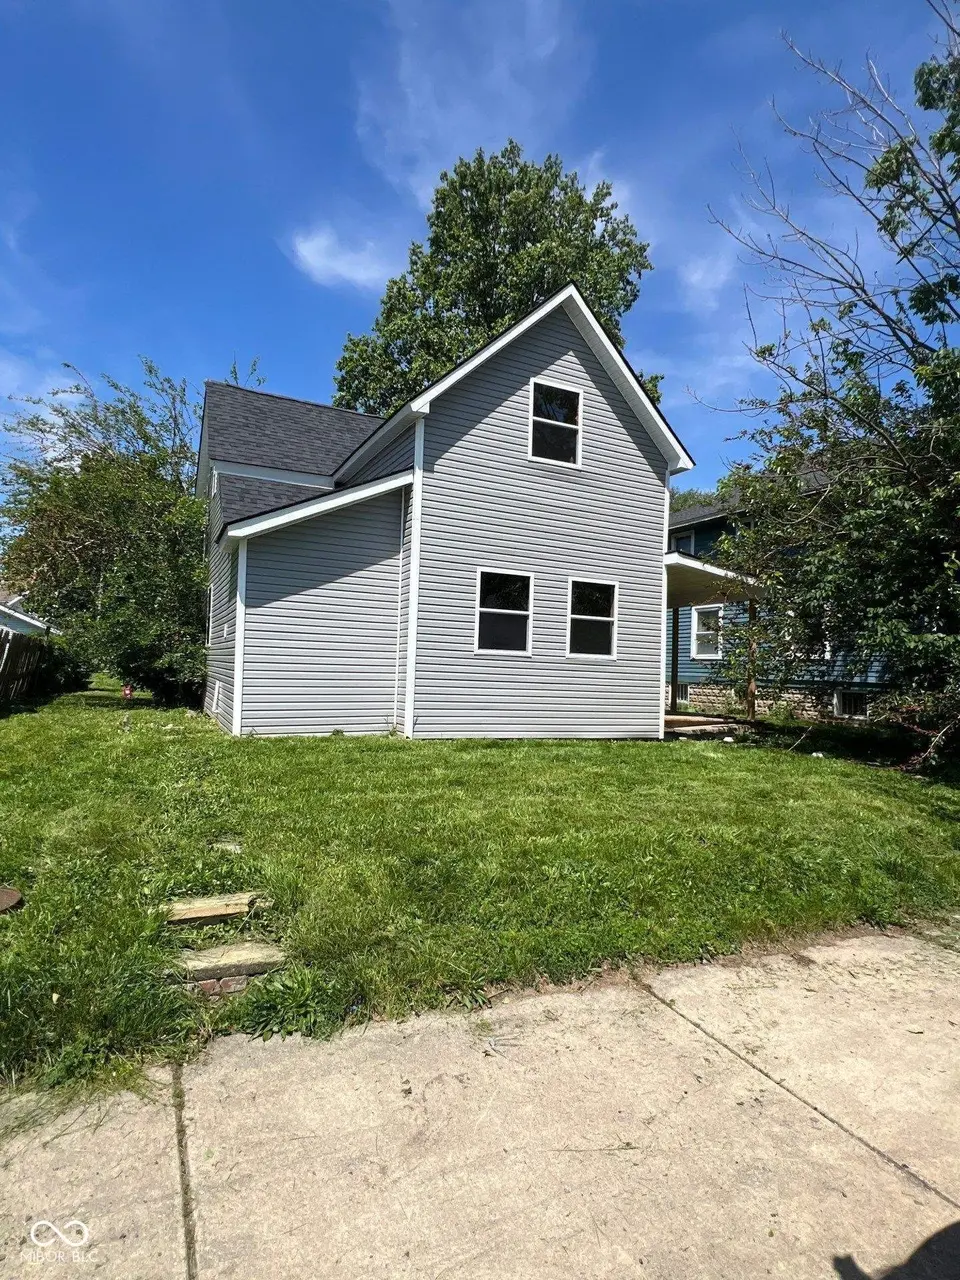
1325 S Main St · Kokomo, IN
Flood risk 1/10 · Minimal
- FEMA flood zone
- X (unshaded)
- Chance of flooding over 30 yrs
- 0.0%
- Est. flood insurance / yr
- $507 – $1,088
Fire risk 1/10 · Minimal
- Est. fire insurance / yr
- $717 – $1,331
Heat risk 3/10 · Minor
- Hot days now (above 102°F)
- 7 days/yr
- Hot days in 30 yrs
- 17 days/yr
Wind risk 2/10 · Minimal
- Chance of severe wind over 30 yrs
- —
Air-quality risk 3/10 · Minor
- Unhealthy air days now
- 2 days/yr
- Unhealthy air days in 30 yrs
- 3 days/yr
Risk factors via First Street. Map © Google.
Why this score? — see what drove the B- grade
The composite is a weighted blend of 9 inputs, each scored 0–100. Each bar is that input's sub-score; the figure is the points it added to the 100-point composite (weight × sub-score).
- Cash flow +30.0/30.0
- 1% rule +10.0/10.0
- DSCR +10.0/10.0
- ARV discount +7.5/15.0
- Livability +3.4/5.0
- Rent growth +3.0/5.0
- Condition / age +2.5/5.0
- Schools +2.1/10.0
- Appreciation +0.0/10.0
$49,900
🖨 Deal sheet 📄 Offer letter ✓ Due diligence
Multi-family units
County records classify this as Multi-Family (2-4 Unit). Listing-text estimate: 1 unit. estimate disagrees with records
Listing remarks
Fixer upper property in popular Kokomo, Indiana. This property has been cleaned up on the exterior and is ready for finishing touches. Interior has several options for the full remodel and is ready for the right buyer to make it beautiful again! Come see today
Key facts
- Full remodel options
- Cleaned up exterior
- 7,492 sq ft lot
Tags
Property features AI
Exterior
- Utilities: Public water; Municipal sewer connected
- Home design: Single-family residence; Two levels; Listed condition: fixer
- Construction: Vinyl siding; Crawl space foundation
- Exterior features: Lot under 1/4 acre (approximately 0.17 acre)
Interior
- Kitchen: No appliances included
- Bedrooms: Three bedrooms (one on the main level, two on the upper level)
- Bathrooms: Two full bathrooms (one on the main level, one on the upper level)
- Heating & cooling: Forced air heating; No central cooling
- Interior features: Attic access; Six total rooms
- Laundry & utility: Utility room on the main level (8x8)
Neighborhood map
What this means for you Summary
Snapshot
- This is a 3-bed/2.0-bath multifamily listed at $50k.
Deal economics
- At list price, monthly cash flow is $730 ($9k/yr) — positive.
- The deal already cash-flows at list — no discount required.
- Meets the 1% rule at list price ($1k rent vs $50k).
- Cap rate 23.9% vs local median 5.2% in Kokomo — top-decile yield for the area; either an underpriced asset or a hidden risk that comps aren't pricing in. Stress-test before assuming the spread holds.
Location & tenants
- Location reads 68/100 on livability (#227 in IN) — a middle-class / working-renter tenant base. Strengths: cost of living A+, housing A+, health & safety A; Watch: crime D, schools F, amenities F.
- Kokomo School Corporation (urban): math 22% / reading 30% proficiency, ranked #264 of 301 in IN (top 88%) — low school quality limits family demand, transient renter base, plan for 1-2y turnover; 62% free/reduced lunch — lower-income household profile, screen leases tightly.
- Market conditions: Rents rising (+1.8%/yr); 232 active listings in the ZIP; 194 units permitted in Howard County in 2024 (0 in 5+ unit buildings).
Forward outlook
- Local home prices are declining (-3.0%/yr); year-one equity from $345 of loan paydown is wiped out by about $1k of value loss. Plan a longer hold.
- Howard County population projected at -11% by 2050 — secular population decline; favor cash flow + early exit over multi-decade hold.
- At projected returns (-3.0% appreciation + 1.8% rent growth), your $14k cash investment doubles in ~2 years — after that, you're playing with house money.
Negotiation context
- Only 7 days on market — expect competitive offers; lowballing is unlikely to land.
Risks & watch-outs
- Watch-outs: built in 1914 — expect roof / HVAC / electrical / plumbing capex.
Questions for the listing agent
- Built in 1914 — when were the roof, HVAC, electrical panel, plumbing, and water heater last replaced?
- Is there a deadline driving the sale (1031 exchange, divorce, estate, relocation)? That informs how much negotiation room exists.
- Schools are F-rated, which usually means shorter tenancies and higher turnover. Who's the typical renter profile here, and what's been the actual vacancy rate?
- Crime grade is D in this area — have there been break-ins, vandalism, or insurance claims at this property in the last 3 years? What carrier currently insures it and at what premium?
- What's the average days-on-market for RENTAL listings here right now (not sales)? A rising rental-DOM trend means longer vacancies and softer asking-rent achievability than the comps imply.
- What's the recent tenant-quality profile in this submarket — average credit score on applications, eviction rate, late-payment / NSF rate, and stable-employment percentage? A property-management company in the area should have these aggregated.
- How much new apartment / multifamily construction is in the pipeline within 1–3 miles? Heavy new supply (>2% of stock underway) typically softens rents 12–24 months out; light construction supports rent growth.
Investment metrics
- 1% rule
- 2.77% ✓
- Cap rate
- 23.85%
- Cash-on-cash
- 62.71%
- DSCR
- 3.79
- GRM
- 3.0
CMA / ARV
- ARV (on-the-fly)
- $154,644
- Comps found
- 4
Show comp detail 4 sales within ~0.75 mi
| Address | Dist | Beds/Ba | Sqft | Sold | Price | $/sf | Match |
|---|---|---|---|---|---|---|---|
| 409 W State St | 0.24mi | 4/3.0 (+1) | 1,984 (+8%) | 19mo | $190,000 | $96 | 51 |
| 1728 S Bell St | 0.46mi | 4/3.0 (+1) | 1,894 (+3%) | 20mo | $145,000 | $77 | 49 |
| 720 S Union St | 0.56mi | 2/2.0 (-1) | 1,591 (-14%) | 4mo | $125,000 | $79 | 43 |
| 829 W State St | 0.54mi | 4/2.0 (+1) | 1,584 (-14%) | 15mo | $133,797 | $84 | 34 |
Match score weights: distance 35% · size 25% · config 20% · recency 20%. Top-matched comps best support the ARV.
Projected returns pro-forma
-3.0% appreciation · 1.8% rent growth · sell at horizon
- IRR
- 60.3%
- Equity multiple
- 3.63×
- Total profit
- $36,801
- Equity at exit
- $7,440
- IRR
- 64.6%
- Equity multiple
- 7.12×
- Total profit
- $85,451
- Equity at exit
- $4,314
Cash invested: $13,972 (down + closing). Projections, not guarantees.
Landlord ↔ Tenant lean methodology
- Overall (STATE)
- 90 Strongly Landlord-Friendly
- State Indiana
- 90 Strongly Landlord-Friendly · R+11
- County
- — inherits STATE
- City
- — inherits STATE
ZIP-level market 46902
- Home prices YoY
- -20.7%
- Rents YoY
- 1.8%
- Active inventory
- 232
- Price-to-rent
- 3.0×
Monthly cashflow live
- Estimated rent
- $1,381 medium interval (Pro) →
- Mortgage (P&I)
- −$262
- Tax from tax record
- −$79 /mo · $944/yr
- Insurance
- −$21
- HOA
- −$0
- Vacancy / Maint / Mgmt
- −$290
- Net cashflow
- $730
Break-even live
UW: 25.0% down · 7.5% · 30yr · 1.5% tax · 5.0% vac · 8.0% maint · 8.0% mgmt
Financing live
Cash to close
- Down payment
- $12,475
- Closing costs
- $1,497
- Reserves months
- —
- Total cash needed
- —
Loan-product check · same deal, 3 products live
Conventional
25% down · 7.5% · 30yr
- Down + closing
- —
- Monthly P&I
- —
- Monthly cashflow
- —
- DSCR
- —
- Eligible?
- —
Personal DTI + credit; lowest rate.
DSCR
20% down · 8.5% · 30yr
- Down + closing
- —
- Monthly P&I
- —
- Monthly cashflow
- —
- DSCR
- —
- Eligible?
- —
No personal income docs; deal must DSCR.
Hard money
10% down · 12.0% · 12mo
- Down + closing
- —
- Monthly P&I
- —
- Monthly cashflow
- —
- DSCR
- —
- Eligible?
- —
Short-term bridge; refi at stabilization.
Listing history 7 events
-
2026-06-19days on market $49,900 Active 7 DOM
-
2026-06-18days on market $49,900 Active 6 DOM
-
2026-06-17days on market $49,900 Active 5 DOM
-
2026-06-16days on market $49,900 Active 4 DOM
-
2026-06-15days on market $49,900 Active 3 DOM
-
2026-06-13remarks 261-char remark
-
2026-06-13$49,900 Active 1 DOM
ⓘ Source: listings_history table (triggers on properties + properties_extension) + one-shot
backfill from property_details.listing_events for pre-trigger history.
Tax reassessment forecast IN · Partial reset (capped growth)
- Current annual tax
- $944 · $79/mo
- Projected year-2 tax
- $944 · $79/mo
- Expected delta
- $0/yr ($0/mo · 0.0%)
ⓘ Screening estimate from a state-policy table — verify with the county assessor before closing.
Climate risk First Street
- Flood 1/10 Low FEMA zone X (unshaded) · 0% chance over 30 yrs
- Wildfire 1/10 Low
- Heat 3/10 Moderate 7 d/yr ≥102°F today · 17 d/yr by 30 yrs out
- Wind 2/10 Low
- Air quality 3/10 Moderate 2 unhealthy d/yr today · 3 by 30 yrs out
Nearby sold comps map
Loading sold comps map…
Walkable amenities ~0.75 mi
Loading nearby amenities…
Taxation est. · year 1
- Rental income
- $16,577
- − Mortgage interest
- −$2,795
- − Property taxes
- −$944
- − Insurance
- −$250
- − Repairs & maintenance
- −$1,326
- − Management
- −$1,326
- − Depreciation
- −$1,452
- Taxable income
- $8,484
- Est. tax owed @ 24.0%
- −$2,036
- After-tax cash flow
- $6,726/yr
For passive investors: Depreciation is non-cash, so a rental often shows a tax loss while cash-flowing — sheltering income. Rental losses are passive: they offset passive income freely, and up to $25,000/yr can offset ordinary (W-2) income if you actively participate and your MAGI is under $100k (phasing out to $0 by $150k); unused losses carry forward. On sale, claimed depreciation is recaptured at up to 25%, and gains may owe capital-gains tax (a 1031 exchange can defer both). Figures are a year-1 estimate at your 24.0% rate — not tax advice; consult a CPA.
Schools (NCES district)
- District
- Kokomo School Corporation
- NCES district ID
- 1805370
- Math proficiency
- 22% ▼ -8.00%
- Reading proficiency
- 30% ▼ -5.00%
- Median HH income
- $35,804
- Composite
- 21.5/100
- National rank
- #8325
- State rank
- #264 of 301 in IN
Livability — Kokomo
- Score
- 68/100
- State rank
- #227
- US rank
- #9912
Category grades
Schools grade is shown separately in the Schools card above.
Census & demographics
- Census place
- Kokomo, IN
- County
- Howard County · 75,099 people
- City population
- 75,099
- Metro
- Kokomo, IN
- Population (ZIP)
- 37,017
- Household income
- $62,126
- Rent vs Own
- Severe rent burden
- 1262.0
Population outlook (Howard County) Hauer SSP2
- Today (2025)
- 81,522 people
- By 2030
- 80,104 · -1.7%
- By 2040
- 76,708 · -5.9%
- By 2050
- 72,880 · -10.6%
- By 2075
- 64,016 · -21.5%
- By 2100
- 51,705 · -36.6%
Race, ethnicity, and origin ACS 2023
- Neighborhood character
- Predominantly White (81%)
- Race & ethnicity
- White 81% Black 9% Two or more races 5% Hispanic / Latino 4% Asian 3%
- Common ancestry
- Italian 2% Lithuanian 1% Slovak 1%
- Foreign-born
- 3% · Canada, Vietnam, China
- Languages at home
- 96% English-only · Vietnamese 1% Other Asian/Pacific 1% Spanish 1%
Political lean MEDSL · Howard
- 2024 margin
- Solid R (+35.3) · D 31.4% · R 66.7% · Other 1.8%
- 2008→2024 swing
- -29.1pp toward R · 2008: -6.2pp · 2024: -35.3pp
- All cycles
- 2024: R+35.3 2020: R+32.4 2016: R+33.9 2012: R+14.3 2008: R+6.2
Not yet ingested
- Civics
- —
Market trends
- HPI YoY
- ▼ -61.76%
- Current HPI
- 236.8237
- Rent YoY
- ▲ 1.80%
- Metro
- Kokomo, IN
- State GDP YoY
- ▲ 2.90%
- F500 in state
- 18
Industry mix (Fortune 500 HQ in IN)
| Industry | F500 HQs | Revenue |
|---|---|---|
| Industrial Machinery | 2 | $37B |
|
||
| Healthcare | 1 | $177B |
|
||
| Pharmaceuticals | 1 | $45B |
|
||
| Metals / Steel | 1 | $18B |
|
||
| Agriculture | 1 | $17B |
|
||
| Packaging | 1 | $12B |
|
||
Price history
1 event — show timeline
- 2026-06-12 Listed $49,900 MIBOR as Distributed by MLS Grid
Property tax history
+0.5%/yrLatest (2024): $944 · -12.3% YoY. Source: county tax records.
Cash-flow waterfall
monthlySold comps — $/sqft
last 12 mo · ≤1 miLoading sold comps…