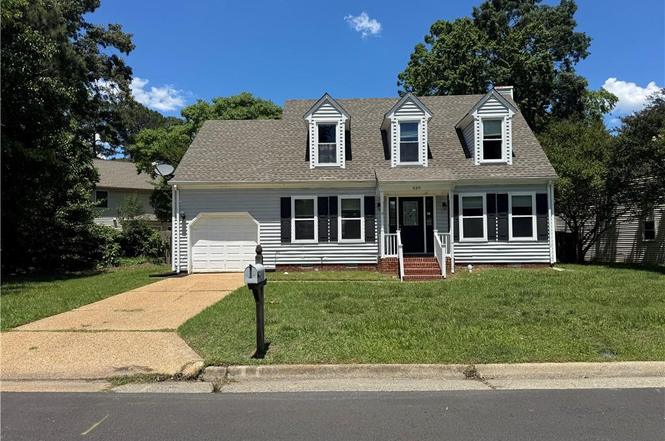
939 Coach Trl · Newport News, VA
Flood risk 3/10 · Minor
- FEMA flood zone
- X (unshaded)
- Chance of flooding over 30 yrs
- 0.1%
- Est. flood insurance / yr
- $507 – $1,088
Fire risk 3/10 · Minor
- Est. fire insurance / yr
- $666 – $1,236
Heat risk 9/10 · Severe
- Hot days now (above 105°F)
- 7 days/yr
- Hot days in 30 yrs
- 17 days/yr
Wind risk 8/10 · Major
- Chance of severe wind over 30 yrs
- 80.0%
Air-quality risk 2/10 · Minimal
- Unhealthy air days now
- 1 days/yr
- Unhealthy air days in 30 yrs
- 1 days/yr
Risk factors via First Street. Map © Google.
Why this score? — see what drove the D+ grade
The composite is a weighted blend of 9 inputs, each scored 0–100. Each bar is that input's sub-score; the figure is the points it added to the 100-point composite (weight × sub-score).
- ARV discount +15.0/15.0
- Cash flow +11.8/30.0
- Rent growth +4.2/5.0
- Schools +3.8/10.0
- Livability +3.8/5.0
- DSCR +3.5/10.0
- 1% rule +3.4/10.0
- Condition / age +2.5/5.0
- Appreciation +0.0/10.0
$299,900
🖨 Deal sheet (PDF) 📄 Offer letter ✓ Due diligence
Listing remarks
Short sale, cash only. Investors' dream. Significant damage due to water leak.
Key facts
- Garage
- Built 1988
- Listed 2 days
Property features AI
Finance
- Other: Property listed as fixer upper
- HOA & community: No HOA/POA fees
Exterior
- Parking: Attached 1-car garage; Driveway parking; Street parking
- Utilities: Public (city/county) water; Public (city/county) sewer; Gas water heater
- Home design: Detached Cape Cod; Two stories (2 living levels); Entry on main level
- Construction: Crawl foundation; Asphalt shingle roof
- Exterior features: Vinyl siding; Back privacy wood fence; Porch
Interior
- Kitchen: Electric range; Microwave; Dishwasher; Garbage disposal; Refrigerator; Pantry
- Bedrooms: Master bedroom with private bath; Additional bedroom
- Flooring: Carpet; Laminate; Vinyl
- Bathrooms: Two full bathrooms; One half bathroom
- Heating & cooling: Forced hot air heating (natural gas); Central air conditioning; Geothermal cooling
- Interior features: Wood-burning fireplace; Scuttle access; Walk-in attic; Finished room over garage; Attic
- Laundry & utility: Washer and dryer included; Washer and dryer hookups; Utility room; Utility closet
Neighborhood map
What this means for you Summary
Snapshot
- This is a 4-bed/2.5-bath single-family listed at $300k.
Deal economics
- At list price, monthly cash flow is $-81 ($-974/yr) — negative.
- To cash-flow at today's rent, offer at most $286k (4.8% below list).
- To meet the 1% rule (rent ≥ 1% of price), the offer needs to be $252k (15.9% below list).
- Recommended offer: $252k (15.9% below list) — sets the bar for 1% rule.
- Cap rate 6.0% vs local median 4.2% in Newport News — top-decile yield for the area; either an underpriced asset or a hidden risk that comps aren't pricing in. Stress-test before assuming the spread holds.
Location & tenants
- Location reads 75/100 on livability (#123 in VA, #4,018 nationally) — a middle-class / working-renter tenant base. Strengths: health & safety A+, cost of living A, housing A; Watch: crime F, commute F.
- Newport News City Public School District (urban): math 34% / reading 54% proficiency, ranked #112 of 131 in VA (top 86%) — families likely to look elsewhere, expect single-tenant / working-renter base with shorter leases.
- Zoned schools: Richneck Elementary (math 35% / reading 53%, grade F, #851 of 1,108 statewide, top 77%, 558 students, 90% FRL); Woodside High (math 54% / reading 86%, grade B+, #151 of 319 statewide, top 49%, 1,807 students, 88% FRL) — zoned schools average 89% FRL vs 55% district-wide (34 pts higher); higher-poverty schools than district average — tighter screening recommended.
- Zoned-school proficiency averages 57% at this address vs 44% district-wide (+13 pts) — the actual schools serving this property are materially stronger than the Newport News City Public School District average implies; a family-tenant draw the district grade alone would hide.
- Market conditions: Rents rising fast (+6.9%/yr); 215 active listings in the ZIP; 19 comparable units currently listed for rent nearby; rentals at typical pace (median 25d on market — plan ~3-4 weeks tenant-placement turnaround); 42% of comp listings sitting > 30 days — soft ceiling on asking rent; 522 units permitted in Newport News city in 2024 (458 in 5+ unit buildings).
- This rent runs 43% of the median local income ($71k/yr) — at the standard rent-burdened threshold; future hikes will face affordability resistance.
Forward outlook
- Local home prices are declining (-3.0%/yr); year-one equity from $2k of loan paydown is wiped out by about $9k of value loss. Plan a longer hold.
- Newport News County population projected to shrink 8% by 2050 — rents likely to lag national; underwrite the cash flow, not the appreciation.
Negotiation context
- Only 3 days on market — expect competitive offers; lowballing is unlikely to land.
- 5 sale attempts since 7y ago with the ask held roughly flat each time — persistent listings suggest the price (not the market) is what's stuck; bring a comps-based counter.
Risks & watch-outs
- Climate carrying-cost: severe wind risk, 80% chance of damaging wind over 30y; extreme-heat days projected 7→17/yr by 2055 (HVAC capex compounding) — expect insurance premiums to compound above CPI over the hold.
Questions for the listing agent
- What do current leases actually rent for vs. the listed asking? Can we see a recent rent roll and the last 12 months of T-12 income?
- Is there a deadline driving the sale (1031 exchange, divorce, estate, relocation)? That informs how much negotiation room exists.
- Schools are B-rated — typically a magnet for longer-tenancy family renters. What's the average tenant stay here, and is there a school-zone premium baked into asking?
- Crime grade is F in this area — have there been break-ins, vandalism, or insurance claims at this property in the last 3 years? What carrier currently insures it and at what premium?
- The area grade is low — what's the realistic commute time and amenity access for the typical tenant pool here? Any planned neighborhood developments (good or bad) we should know about?
- What's the average days-on-market for RENTAL listings here right now (not sales)? A rising rental-DOM trend means longer vacancies and softer asking-rent achievability than the comps imply.
- What's the recent tenant-quality profile in this submarket — average credit score on applications, eviction rate, late-payment / NSF rate, and stable-employment percentage? A property-management company in the area should have these aggregated.
- How much new for-sale + rental construction is in the pipeline within 1–3 miles? Heavy new supply typically softens prices + rents 12–24 months out; constrained supply supports both.
Investment metrics
- 1% rule
- 0.84% ✗
- Cap rate
- 5.97%
- Cash-on-cash
- -1.16%
- DSCR
- 0.95
- GRM
- 9.9
CMA / ARV
- ARV (on-the-fly)
- $388,674
- Comps found
- 12
Show comp detail 12 sales within ~0.75 mi
| Address | Dist | Beds/Ba | Sqft | Sold | Price | $/sf | Match |
|---|---|---|---|---|---|---|---|
| 935 Chartwell Dr | 0.10mi | 4/2.5 | 2,098 (+7%) | 2mo | $390,000 | $186 | 82 |
| 1415 Harwinton Ct | 0.25mi | 3/2.5 (-1) | 1,997 (+2%) | 1mo | $399,000 | $200 | 80 |
| 892 Belvoir Cir | 0.29mi | 4/3.5 | 1,900 (-3%) | 2mo | $377,000 | $198 | 76 |
| 1431 Independence Blvd | 0.18mi | 3/2.5 (-1) | 2,097 (+7%) | 1mo | $415,000 | $198 | 74 |
| 44 Gainsborough Pl | 0.41mi | 4/3.0 | 2,071 (+6%) | 1mo | $377,500 | $182 | 69 |
| 1515 Waltham Ln | 0.21mi | 4/2.5 | 2,243 (+14%) | 1mo | $498,900 | $222 | 66 |
| 306 Heacox Ln | 0.60mi | 4/2.5 | 1,871 (-5%) | 1mo | $191,171 | $102 | 63 |
| 907 Eastnor Ct | 0.26mi | 4/2.5 | 2,250 (+15%) | 1mo | $444,000 | $197 | 63 |
| 26 Ridgewood Pkwy | 0.62mi | 3/2.5 (-1) | 1,934 (-2%) | 1mo | $385,200 | $199 | 63 |
| 52 Gainsborough Pl | 0.45mi | 4/2.5 | 2,158 (+10%) | 1mo | $377,000 | $175 | 62 |
| 15 Fauquier Pl | 0.51mi | 3/2.5 (-1) | 1,759 (-10%) | 2mo | $374,000 | $213 | 52 |
| 804 Melrose Ter | 0.73mi | 3/2.5 (-1) | 2,188 (+12%) | 2mo | $395,000 | $181 | 40 |
Match score weights: distance 35% · size 25% · config 20% · recency 20%. Top-matched comps best support the ARV.
Projected returns pro-forma
-3.0% appreciation · 6.87% rent growth · sell at horizon
- IRR
- -14.0%
- Equity multiple
- 0.48×
- Total profit
- $-43,523
- Equity at exit
- $44,716
- IRR
- 0.1%
- Equity multiple
- 1.01×
- Total profit
- $951
- Equity at exit
- $25,930
Cash invested: $83,972 (down + closing). Projections, not guarantees.
Landlord ↔ Tenant lean methodology
- Overall (STATE)
- 55 Moderately Landlord-Leaning
- State Virginia
- 55 Moderately Landlord-Leaning · D+2
- County
- — inherits STATE
- City
- — inherits STATE
ZIP-level market 23608
- Home prices YoY
- -10.5%
- Rents YoY
- 6.9%
- Active inventory
- 215
- Price-to-rent
- 9.9×
Monthly cashflow live
- Estimated rent
- $2,522 high interval (Pro) →
- Mortgage (P&I)
- −$1,573
- Tax from tax record
- −$376 /mo · $4,514/yr
- Insurance
- −$125
- HOA
- −$0
- Vacancy / Maint / Mgmt
- −$530
- Net cashflow
- $-81
Break-even live
Sensitivity live
| Price | -10% $89 | -5% $4 | +0% $-81 | +5% $-166 | +10% $-251 |
|---|---|---|---|---|---|
| Rent | -10% $-280 | -5% $-181 | +0% $-81 | +5% $18 | +10% $118 |
| Rate | -1.0pp $70 | -0.5pp $-5 | base $-81 | +0.5pp $-159 | +1.0pp $-238 |
UW: 25.0% down · 7.5% · 30yr · 1.5% tax · 5.0% vac · 8.0% maint · 8.0% mgmt
Financing live
Cash to close
- Down payment
- $74,975
- Closing costs
- $8,997
- Reserves months
- —
- Total cash needed
- —
Loan-product check · same deal, 3 products live
Conventional
25% down · 7.5% · 30yr
- Down + closing
- —
- Monthly P&I
- —
- Monthly cashflow
- —
- DSCR
- —
- Eligible?
- —
Personal DTI + credit; lowest rate.
DSCR
20% down · 8.5% · 30yr
- Down + closing
- —
- Monthly P&I
- —
- Monthly cashflow
- —
- DSCR
- —
- Eligible?
- —
No personal income docs; deal must DSCR.
Hard money
10% down · 12.0% · 12mo
- Down + closing
- —
- Monthly P&I
- —
- Monthly cashflow
- —
- DSCR
- —
- Eligible?
- —
Short-term bridge; refi at stabilization.
Rent comps 19 comps
| Address | Beds | Baths | Sqft | Rent | $/sqft | DOM | Units | Dist |
|---|---|---|---|---|---|---|---|---|
| 1415 Waltham Ln Newport News, VA | 4.0 | 2.5 | 2400 | $2,995 | $1.25 | 17d | 1 | 0.16mi |
| 1510 Waltham Ln Newport News, VA | 3.0 | 2.5 | 2035 | $2,700 | $1.33 | 24d | 1 | 0.22mi |
| 1517 Auckland Ct Newport News, VA | 4.0 | 2.5 | 2100 | $2,465 | $1.17 | 44d | 1 | 0.23mi |
| 1512 Auckland Ct Yorktown, VA | 4.0 | 3.0 | 1900 | $2,450 | $1.29 | 44d | 1 | 0.24mi |
| 893 Henrico Ct Newport News, VA | 4.0 | 2.5 | 2125 | $2,950 | $1.39 | 44d | 1 | 0.41mi |
| 458 Warner Hall Pl Newport News, VA | 5.0 | 2.5 | 2048 | $2,900 | $1.42 | 24d | 1 | 0.43mi |
| 453 Waverly Pl Newport News, VA | 3.0 | 2.5 | 1952 | $2,800 | $1.43 | 24d | 1 | 0.53mi |
| 259 Windsor Castle Dr Newport News, VA | 3.0 | 2.5 | 1600 | $2,350 | $1.47 | 24d | 1 | 0.55mi |
| 259 Windsor Castle Dr Newport News, VA | 3.0 | 2.5 | 1572 | $2,250 | $1.43 | 17d | 1 | 0.55mi |
| 259 Windsor Castle Dr Newport News, VA | 3.0 | 2.5 | 1572 | $2,300 | $1.46 | 18d | 1 | 0.55mi |
| 259 Windsor Castle Dr Newport News, VA | 3.0 | 2.5 | 1572 | $2,300 | $1.46 | 44d | 1 | 0.55mi |
| 7 Friedman Pl Newport News, VA | 3.0 | 2.0 | 1537 | $2,250 | $1.46 | 11d | 1 | 0.62mi |
| 12750 Saint George St Newport News, VA | 3.0 | 2.5 | 1350 | $1,300 | $0.96 | 8d | 1 | 0.68mi |
| 811 Melrose Ter Newport News, VA | 4.0 | 3.0 | 2320 | $2,875 | $1.24 | 44d | 1 | 0.68mi |
| 15 Otsego Dr Newport News, VA | 3.0 | 1.5 | 1280 | $1,900 | $1.48 | 44d | 1 | 0.72mi |
| 205 Orkney Pl Newport News, VA | 3.0 | 1.5 | 2072 | $2,300 | $1.11 | 24d | 1 | 0.81mi |
| 104 Landmark Ct Newport News, VA | 1.0–3.0 | 1.0–2.0 | 1020 | $1,802 | $1.77 | 3d | 1 | 1.00mi |
| 722 Emerald Ct Newport News, VA | 3.0 | 2.5 | 1488 | $2,400 | $1.61 | 44d | 1 | 1.01mi |
| 713 Emerald Ct Newport News, VA | 3.0 | 2.5 | 1455 | $2,300 | $1.58 | 44d | 1 | 1.01mi |
Listing history 3 events
-
2026-06-21days on market $299,900 Active 3 DOM
-
2026-06-19remarks 78-char remark
-
2026-06-19$299,900 Active 1 DOM
ⓘ Source: listings_history table (triggers on properties + properties_extension) + one-shot
backfill from property_details.listing_events for pre-trigger history.
Tax reassessment forecast VA · Resets to sale price
- Current annual tax
- $4,514 · $376/mo
- Projected year-2 tax
- $4,514 · $376/mo
- Expected delta
- $0/yr ($0/mo · 0.0%)
ⓘ Screening estimate from a state-policy table — verify with the county assessor before closing.
Climate risk First Street
- Flood 3/10 Moderate FEMA zone X (unshaded) · 10% chance over 30 yrs
- Wildfire 3/10 Moderate
- Heat 9/10 Extreme 7 d/yr ≥105°F today · 17 d/yr by 30 yrs out
- Wind 8/10 Severe 80% chance of damaging wind over 30 yrs
- Air quality 2/10 Low 1 unhealthy d/yr today · 1 by 30 yrs out
Nearby sold comps map
Loading sold comps map…
Walkable amenities ~0.75 mi
Loading nearby amenities…
Taxation est. · year 1
- Rental income
- $30,269
- − Mortgage interest
- −$16,799
- − Property taxes
- −$4,514
- − Insurance
- −$1,500
- − Repairs & maintenance
- −$2,421
- − Management
- −$2,421
- − Depreciation
- −$8,724
- Taxable loss
- −$6,111
- Est. tax savings @ 24.0%
- +$1,467
- After-tax cash flow
- $493/yr
For passive investors: Depreciation is non-cash, so a rental often shows a tax loss while cash-flowing — sheltering income. Rental losses are passive: they offset passive income freely, and up to $25,000/yr can offset ordinary (W-2) income if you actively participate and your MAGI is under $100k (phasing out to $0 by $150k); unused losses carry forward. On sale, claimed depreciation is recaptured at up to 25%, and gains may owe capital-gains tax (a 1031 exchange can defer both). Figures are a year-1 estimate at your 24.0% rate — not tax advice; consult a CPA.
Schools (NCES district)
- District
- Newport News City Public School District
- NCES district ID
- 5102640
- Math proficiency
- 34% ▼ -37.00%
- Reading proficiency
- 54% ▼ -10.00%
- Median HH income
- $49,644
- Composite
- 37.7/100
- National rank
- #4360
- State rank
- #112 of 131 in VA
Livability — Newport News
- Score
- 75/100
- State rank
- #123
- US rank
- #4018
Category grades
Schools grade is shown separately in the Schools card above.
Census & demographics
- Census place
- Newport News, VA
- County
- Newport News City · 178,950 people
- City population
- 178,950
- Metro
- Virginia Beach-Norfolk-Newport News, VA-NC
- Population (ZIP)
- 43,641
- Household income
- $71,126
- Rent vs Own
- Severe rent burden
- 2094.0
Population outlook (Newport News County) Hauer SSP2
- Today (2025)
- 181,076 people
- By 2030
- 179,683 · -0.8%
- By 2040
- 174,649 · -3.5%
- By 2050
- 167,407 · -7.5%
- By 2075
- 147,597 · -18.5%
- By 2100
- 122,144 · -32.5%
Race, ethnicity, and origin ACS 2023
- Neighborhood character
- Diverse neighborhood (Simpson 0.70)
- Race & ethnicity
- Black 40% White 36% Hispanic / Latino 12% Two or more races 11% Asian 6%
- Hispanic origin (detail)
- Mexican 5% Puerto Rican 4%
- Common ancestry
- Slovak 2% Italian 1% Romanian 1%
- Foreign-born
- 11% · Canada, South Korea, Vietnam
- Languages at home
- 87% English-only · Spanish 7% Other Indo-European 1% Arabic 1%
Political lean MEDSL · Newport News
- 2024 margin
- Strong D (+28.8) · D 63.7% · R 34.9% · Other 1.4%
- 2008→2024 swing
- +0.1pp no change · 2008: 28.7pp · 2024: 28.8pp
- All cycles
- 2024: D+28.8 2020: D+32.9 2016: D+25.4 2012: D+30.0 2008: D+28.7
Not yet ingested
- Civics
- —
Market trends
- HPI YoY
- ▼ -34.79%
- Current HPI
- 297.7465
- Rent YoY
- ▲ 6.87%
- Metro
- Virginia Beach-Norfolk-Newport News, VA-NC
- State GDP YoY
- ▲ 2.40%
- F500 in state
- 50
Industry mix (Fortune 500 HQ in VA)
| Industry | F500 HQs | Revenue |
|---|---|---|
| Aerospace / Defense | 4 | $236B |
|
||
| Technology / Defense | 3 | $32B |
|
||
| Financial Services | 2 | $176B |
|
||
| Utilities | 2 | $27B |
|
||
| Insurance | 2 | $25B |
|
||
| Technology | 2 | $15B |
|
||
Price history
-37.5% since first listed15 events — show timeline
- 2026-06-16 Listed $299,900 REINMLS
- 2026-01-02 Listing Removed — REINMLS
- 2025-09-16 Listing Removed — REINMLS
- 2025-09-16 Listed $359,900 REINMLS
- 2025-07-17 Listed $364,900 REINMLS
- 2022-03-23 Sold (Public Records) $325,000 Public Records
- 2022-02-25 Pending — REINMLS
- 2022-02-20 Contingent — REINMLS
- 2022-02-18 Listed $320,000 REINMLS
- 2019-05-24 Sold (Public Records) $249,900 Public Records
- 2019-05-03 Pending — REINMLS
- 2019-04-14 Listed $249,900 REINMLS
- 2003-09-02 Sold (Public Records) $162,000 Public Records
- 1988-03-08 Sold (Public Records) $104,900 Public Records
- 1986-11-06 Sold (Public Records) $480,000 Public Records
Property tax history
+4.5%/yrLatest (2026): $4,514 · +7.4% YoY. Source: county tax records.
Cash-flow waterfall
monthlySold comps — $/sqft
last 12 mo · ≤1 miLoading sold comps…