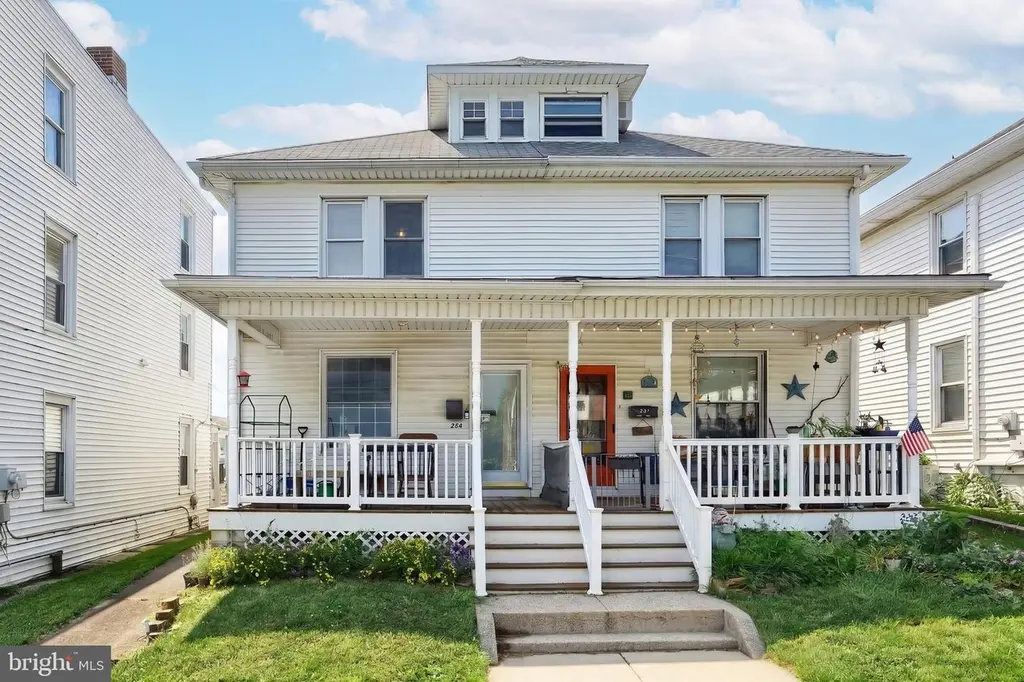
229 W High St · Red Lion, PA
Flood risk 1/10 · Minimal
- FEMA flood zone
- X (unshaded)
- Chance of flooding over 30 yrs
- 0.0%
- Est. flood insurance / yr
- $473 – $860
Fire risk 1/10 · Minimal
- Est. fire insurance / yr
- $511 – $949
Heat risk 5/10 · Moderate
- Hot days now (above 100°F)
- 7 days/yr
- Hot days in 30 yrs
- 15 days/yr
Wind risk 4/10 · Minor
- Chance of severe wind over 30 yrs
- 12.0%
Air-quality risk 3/10 · Minor
- Unhealthy air days now
- 2 days/yr
- Unhealthy air days in 30 yrs
- 5 days/yr
Risk factors via First Street. Map © Google.
Why this score? — see what drove the C- grade
The composite is a weighted blend of 9 inputs, each scored 0–100. Each bar is that input's sub-score; the figure is the points it added to the 100-point composite (weight × sub-score).
- Cash flow +15.3/30.0
- ARV discount +15.0/15.0
- DSCR +4.7/10.0
- 1% rule +4.0/10.0
- Livability +3.9/5.0
- Schools +3.8/10.0
- Rent growth +2.5/5.0
- Condition / age +2.5/5.0
- Appreciation +0.0/10.0
$189,900
🖨 Deal sheet (PDF) 📄 Offer letter ✓ Due diligence
Listing remarks MLS
Really nice and affordable semi detached home located in Red Lion Borough. Fenced private rear yard and detached 1 car garage with off street parking. Finished lower level with bar and office. Some new interior paint. 1st floor full bath and laundry. Full bath on 2nd floor with three nice sized bedrooms. Additional room on 2nd floor for storage or nursery. Full attic could be finished for another bedroom. Window unit air cond. not included.
Key facts
- Bar area
- Classic front porch
- Finished lower level
Tags
Property features AI
Exterior
- Parking: Detached rear-entry garage (1 garage space); One off-street parking space; On-street parking available; Total of 2 parking spaces
- Security: Window screens
- Utilities: Public water; Public sewer; Natural gas hot water; Heating fuel: natural gas and electric
- Home design: Semi-detached property; Fee simple ownership; Not in a federal flood zone
- Construction: Vinyl and aluminum siding; Block foundation; Architectural shingle roof; Garage structure present; Building not winterized
- Exterior features: Exterior lighting; Sidewalks; Porch(es); Wood fencing
Interior
- Kitchen: Electric range/oven; Dishwasher; Eat-in kitchen
- Bedrooms: Three bedrooms on the upper level; Rooms include: Master Bedroom, Bedroom 2, Bedroom 3 (plus additional listed bedrooms)
- Flooring: Hardwood; Vinyl; Carpet
- Bathrooms: Two full bathrooms (one on main level, one on upper level)
- Heating & cooling: Forced air heating; Electric baseboard heating
- Interior features: Attic; Tub shower and stall shower; Ceiling fans; Crown moldings; Dining area; Eat-in kitchen; Wood floors
- Laundry & utility: Washer (laundry on main floor)
Neighborhood map
What this means for you Summary
Snapshot
- This is a 3-bed/2.0-bath townhouse listed at $190k.
Deal economics
- At list price, monthly cash flow is $69 ($824/yr) — positive.
- The deal already cash-flows at list — no discount required.
- To meet the 1% rule (rent ≥ 1% of price), the offer needs to be $171k (10.0% below list).
- Recommended offer: $171k (10.0% below list) — sets the bar for 1% rule.
- Cap rate 6.7% vs local median 4.5% in Red Lion — top-decile yield for the area; either an underpriced asset or a hidden risk that comps aren't pricing in. Stress-test before assuming the spread holds.
Location & tenants
- Location reads 77/100 on livability (#349 in PA, #3,056 nationally) — a middle-class / working-renter tenant base. Strengths: cost of living A+, housing A+, health & safety A+; Watch: amenities D, commute F.
- Red Lion Area SD (suburban): math 36% / reading 50% proficiency, ranked #282 of 539 in PA (top 52%) — families likely to look elsewhere, expect single-tenant / working-renter base with shorter leases.
- Zoned schools: Mazie Gable El Sch (math 23% / reading 39%, grade F, #1,116 of 1,518 statewide, top 74%, 523 students, 73% FRL); Red Lion Area Jhs (math 23% / reading 49%, grade F, #313 of 512 statewide, top 62%, 813 students, 50% FRL); Red Lion Area Shs (math 63% / reading 24%, grade F, #211 of 437 statewide, top 48%, 1,432 students, 44% FRL) — zoned schools average 56% FRL vs 28% district-wide (27 pts higher); higher-poverty schools than district average — tighter screening recommended.
- Market conditions: 147 active listings in the ZIP; 8 comparable units currently listed for rent nearby; rentals at typical pace (median 23d on market — plan ~3-4 weeks tenant-placement turnaround); solid renter incomes; 1,328 units permitted in York County in 2024 (338 in 5+ unit buildings).
Forward outlook
- Local home prices are declining (-3.0%/yr); year-one equity from $1k of loan paydown is wiped out by about $6k of value loss. Plan a longer hold.
Negotiation context
- Only 3 days on market — expect competitive offers; lowballing is unlikely to land.
- 2 sale attempts since 7y ago with the ask held roughly flat each time — persistent listings suggest the price (not the market) is what's stuck; bring a comps-based counter.
- Current owner paid $110k; list at $190k implies a 73% gain — meaningful room to come down on a strong offer.
Risks & watch-outs
- Watch-outs: built in 1928 — expect roof / HVAC / electrical / plumbing capex.
- Climate carrying-cost: extreme-heat days projected 7→15/yr by 2055 (HVAC capex compounding) — expect insurance premiums to compound above CPI over the hold.
Questions for the listing agent
- Built in 1928 — when were the roof, HVAC, electrical panel, plumbing, and water heater last replaced?
- Is there a deadline driving the sale (1031 exchange, divorce, estate, relocation)? That informs how much negotiation room exists.
- What's the average days-on-market for RENTAL listings here right now (not sales)? A rising rental-DOM trend means longer vacancies and softer asking-rent achievability than the comps imply.
- What's the recent tenant-quality profile in this submarket — average credit score on applications, eviction rate, late-payment / NSF rate, and stable-employment percentage? A property-management company in the area should have these aggregated.
- How much new for-sale + rental construction is in the pipeline within 1–3 miles? Heavy new supply typically softens prices + rents 12–24 months out; constrained supply supports both.
Investment metrics
- 1% rule
- 0.90% ✗
- Cap rate
- 6.73%
- Cash-on-cash
- 1.55%
- DSCR
- 1.07
- GRM
- 9.3
CMA / ARV
- ARV (on-the-fly)
- $282,880
- Comps found
- 12
Show comp detail 12 sales within ~0.75 mi
| Address | Dist | Beds/Ba | Sqft | Sold | Price | $/sf | Match |
|---|---|---|---|---|---|---|---|
| 116 S Franklin St | 0.44mi | 3/1.5 | 1,632 (-2%) | 5mo | $201,250 | $123 | 70 |
| 274 N Main St | 0.29mi | 3/1.0 | 1,837 (+10%) | 1mo | $202,000 | $110 | 64 |
| 327 1st Ave | 0.33mi | 4/2.0 (+1) | 1,471 (-12%) | 1mo | $205,000 | $139 | 60 |
| 316 W Broadway | 0.35mi | 3/1.0 | 1,478 (-11%) | 3mo | $202,500 | $137 | 59 |
| 337 Winners Cir | 0.47mi | 2/2.0 (-1) | 1,504 (-10%) | 3mo | $290,000 | $193 | 54 |
| 121 Furlong Way #121 | 0.47mi | 2/2.0 (-1) | 1,504 (-10%) | 4mo | $265,000 | $176 | 54 |
| 240 Palomino Way | 0.57mi | 2/2.0 (-1) | 1,520 (-9%) | 3mo | $259,000 | $170 | 52 |
| 11 E Lancaster St | 0.61mi | 4/1.5 (+1) | 1,523 (-8%) | 4mo | $192,500 | $126 | 48 |
| 214 Equine Cv #214 | 0.53mi | 2/2.0 (-1) | 1,472 (-12%) | 4mo | $255,000 | $173 | 48 |
| 218 Equine Cv | 0.56mi | 2/2.0 (-1) | 1,472 (-12%) | 4mo | $265,000 | $180 | 46 |
| 200 Jutland Way #251 | 0.67mi | 2/2.0 (-1) | 1,500 (-10%) | 1mo | $295,000 | $197 | 46 |
| 156 Country Ridge Dr | 0.75mi | 4/2.5 (+1) | 1,912 (+15%) | 0mo | $265,000 | $139 | 33 |
Match score weights: distance 35% · size 25% · config 20% · recency 20%. Top-matched comps best support the ARV.
Projected returns pro-forma
-3.0% appreciation · 3.0% rent growth · sell at horizon
- IRR
- -13.8%
- Equity multiple
- 0.50×
- Total profit
- $-26,394
- Equity at exit
- $28,315
- IRR
- -5.0%
- Equity multiple
- 0.67×
- Total profit
- $-17,326
- Equity at exit
- $16,419
Cash invested: $53,172 (down + closing). Projections, not guarantees.
Landlord ↔ Tenant lean methodology
- Overall (STATE)
- 62 Landlord-Friendly
- State Pennsylvania
- 62 Landlord-Friendly · EVEN
- County
- — inherits STATE
- City
- — inherits STATE
ZIP-level market 17356
- Home prices YoY
- -21.0%
- Active inventory
- 147
- Price-to-rent
- 9.3×
Monthly cashflow live
- Estimated rent
- $1,710 high interval (Pro) →
- Mortgage (P&I)
- −$996
- Tax from tax record
- −$207 /mo · $2,484/yr
- Insurance
- −$79
- HOA
- −$0
- Vacancy / Maint / Mgmt
- −$359
- Net cashflow
- $69
Break-even live
Sensitivity live
| Price | -10% $176 | -5% $122 | +0% $69 | +5% $15 | +10% $-39 |
|---|---|---|---|---|---|
| Rent | -10% $-66 | -5% $1 | +0% $69 | +5% $136 | +10% $204 |
| Rate | -1.0pp $164 | -0.5pp $117 | base $69 | +0.5pp $19 | +1.0pp $-31 |
UW: 25.0% down · 7.5% · 30yr · 1.5% tax · 5.0% vac · 8.0% maint · 8.0% mgmt
Financing live
Cash to close
- Down payment
- $47,475
- Closing costs
- $5,697
- Reserves months
- —
- Total cash needed
- —
Loan-product check · same deal, 3 products live
Conventional
25% down · 7.5% · 30yr
- Down + closing
- —
- Monthly P&I
- —
- Monthly cashflow
- —
- DSCR
- —
- Eligible?
- —
Personal DTI + credit; lowest rate.
DSCR
20% down · 8.5% · 30yr
- Down + closing
- —
- Monthly P&I
- —
- Monthly cashflow
- —
- DSCR
- —
- Eligible?
- —
No personal income docs; deal must DSCR.
Hard money
10% down · 12.0% · 12mo
- Down + closing
- —
- Monthly P&I
- —
- Monthly cashflow
- —
- DSCR
- —
- Eligible?
- —
Short-term bridge; refi at stabilization.
Rent comps 8 comps
| Address | Beds | Baths | Sqft | Rent | $/sqft | DOM | Units | Dist |
|---|---|---|---|---|---|---|---|---|
| 16 W High St Red Lion, PA | 3.0 | 1.0 | 1075 | $1,075 | $1.00 | 23d | 1 | 0.25mi |
| 705 Country Club Rd Red Lion, PA | 3.0 | 2.5 | 1660 | $1,695 | $1.02 | 45d | 1 | 0.46mi |
| 703 Country Club Rd Red Lion, PA | 3.0 | 2.5 | 1540 | $1,795 | $1.17 | 45d | 1 | 0.47mi |
| 520 S Pine St Red Lion, PA | 4.0 | 3.0 | 2088 | $2,295 | $1.10 | 15d | 1 | 0.82mi |
| 201 Burrows Rd Red Lion, PA | 3.0 | 2.5 | 1485 | $1,924 | $1.30 | 15d | 1 | 0.88mi |
| 571 S Main St Red Lion, PA | 2.0 | 1.0 | 2152 | $1,500 | $0.70 | 23d | 1 | 0.96mi |
| 306 Orchard Ct Red Lion, PA | 2.0 | 1.5 | 1300 | $1,495 | $1.15 | 23d | 1 | 1.28mi |
| 21 Windsor Way Red Lion, PA | 3.0 | 2.0–2.5 | 1385 | $2,150 | $1.55 | 15d | 8 | 1.34mi |
Listing history 7 events
-
2026-05-22$189,900 Active
-
2019-12-05soldstatus $109,900
-
2019-12-02soldstatus $109,900 Closed 444-char remark
Show marketing remark (444 chars)
Really nice and affordable semi detached home located in Red Lion Borough. Fenced private rear yard and detached 1 car garage with off street parking. Finished lower level with bar and office. Some new interior paint. 1st floor full bath and laundry. Full bath on 2nd floor with three nice sized bedrooms. Additional room on 2nd floor for storage or nursery. Full attic could be finished for another bedroom. Window unit air cond. not included.
-
2019-10-16status Pending 444-char remark
Show marketing remark (444 chars)
Really nice and affordable semi detached home located in Red Lion Borough. Fenced private rear yard and detached 1 car garage with off street parking. Finished lower level with bar and office. Some new interior paint. 1st floor full bath and laundry. Full bath on 2nd floor with three nice sized bedrooms. Additional room on 2nd floor for storage or nursery. Full attic could be finished for another bedroom. Window unit air cond. not included.
-
2019-09-23$109,900 Active 444-char remark
Show marketing remark (444 chars)
Really nice and affordable semi detached home located in Red Lion Borough. Fenced private rear yard and detached 1 car garage with off street parking. Finished lower level with bar and office. Some new interior paint. 1st floor full bath and laundry. Full bath on 2nd floor with three nice sized bedrooms. Additional room on 2nd floor for storage or nursery. Full attic could be finished for another bedroom. Window unit air cond. not included.
-
1997-10-17soldstatus $72,500
-
1996-05-22soldstatus $30,000
ⓘ Source: listings_history table (triggers on properties + properties_extension) + one-shot
backfill from property_details.listing_events for pre-trigger history.
Tax reassessment forecast PA · Partial reset (capped growth)
- Current annual tax
- $2,484 · $207/mo
- Projected year-2 tax
- $2,742 · $229/mo
- Expected delta
- +$258/yr (+$22/mo · 10.4%)
ⓘ Screening estimate from a state-policy table — verify with the county assessor before closing.
Climate risk First Street
- Flood 1/10 Low FEMA zone X (unshaded) · 0% chance over 30 yrs
- Wildfire 1/10 Low
- Heat 5/10 Major 7 d/yr ≥100°F today · 15 d/yr by 30 yrs out
- Wind 4/10 Moderate 12% chance of damaging wind over 30 yrs
- Air quality 3/10 Moderate 2 unhealthy d/yr today · 5 by 30 yrs out
Nearby sold comps map
Loading sold comps map…
Walkable amenities ~0.75 mi
Loading nearby amenities…
Taxation est. · year 1
- Rental income
- $20,516
- − Mortgage interest
- −$10,637
- − Property taxes
- −$2,484
- − Insurance
- −$950
- − Repairs & maintenance
- −$1,641
- − Management
- −$1,641
- − Depreciation
- −$5,524
- Taxable loss
- −$2,362
- Est. tax savings @ 24.0%
- +$567
- After-tax cash flow
- $1,390/yr
For passive investors: Depreciation is non-cash, so a rental often shows a tax loss while cash-flowing — sheltering income. Rental losses are passive: they offset passive income freely, and up to $25,000/yr can offset ordinary (W-2) income if you actively participate and your MAGI is under $100k (phasing out to $0 by $150k); unused losses carry forward. On sale, claimed depreciation is recaptured at up to 25%, and gains may owe capital-gains tax (a 1031 exchange can defer both). Figures are a year-1 estimate at your 24.0% rate — not tax advice; consult a CPA.
Schools (NCES district)
- District
- Red Lion Area SD
- NCES district ID
- 4220100
- Math proficiency
- 36% ▼ -10.00%
- Reading proficiency
- 50% ▼ -10.00%
- Median HH income
- $60,225
- Composite
- 37.91/100
- National rank
- #4313
- State rank
- #282 of 539 in PA
Livability — Red Lion
- Score
- 77/100
- State rank
- #349
- US rank
- #3056
Category grades
Schools grade is shown separately in the Schools card above.
Census & demographics
- Census place
- Red Lion, PA
- County
- York County · 278,806 people
- City population
- 22,869
- Metro
- York-Hanover, PA
- Population (ZIP)
- 22,869
- Household income
- $86,561
- Rent vs Own
- Severe rent burden
- 559.0
Population outlook (York County) Hauer SSP2
- Today (2025)
- 454,205 people
- By 2030
- 457,407 · +0.7%
- By 2040
- 457,529 · +0.7%
- By 2050
- 448,261 · -1.3%
- By 2075
- 427,388 · -5.9%
- By 2100
- 384,218 · -15.4%
Race, ethnicity, and origin ACS 2023
- Neighborhood character
- Predominantly White (89%)
- Race & ethnicity
- White 89% Black 4% Two or more races 4% Asian 2% Hispanic / Latino 2%
- Common ancestry
- Romanian 3% Slovak 3% Serbian 2%
- Foreign-born
- 4% · China
- Languages at home
- 95% English-only · Russian/Polish/Slavic 1% Chinese 1% Other Indo-European 1%
Political lean MEDSL · York
- 2024 margin
- Strong R (+25.3) · D 36.9% · R 62.1%
- 2008→2024 swing
- -11.7pp toward R · 2008: -13.6pp · 2024: -25.3pp
- All cycles
- 2024: R+25.3 2020: R+24.6 2016: R+29.3 2012: R+21.2 2008: R+13.6
Not yet ingested
- Civics
- —
Market trends
- HPI YoY
- ▼ -69.16%
- Current HPI
- 259.7294
- Rent YoY
- —
- Metro
- York-Hanover, PA
- State GDP YoY
- ▲ 1.68%
- F500 in state
- 34
Industry mix (Fortune 500 HQ in PA)
| Industry | F500 HQs | Revenue |
|---|---|---|
| Healthcare | 2 | $309B |
|
||
| Insurance | 2 | $27B |
|
||
| Telecommunications / Media | 1 | $124B |
|
||
| Industrial Distribution | 1 | $22B |
|
||
| Financial Services | 1 | $20B |
|
||
| Chemicals / Materials | 1 | $18B |
|
||
Price history
+533.0% since first listed7 events — show timeline
- 2026-05-22 Listed $189,900 BRIGHT MLS
- 2019-12-05 Sold (Public Records) $109,900 Public Records
- 2019-12-02 Sold (MLS) $109,900 BRIGHT MLS
- 2019-10-16 Pending — BRIGHT MLS
- 2019-09-23 Listed $109,900 BRIGHT MLS
- 1997-10-17 Sold (Public Records) $72,500 Public Records
- 1996-05-22 Sold (Public Records) $30,000 Public Records
Property tax history
+0.9%/yrLatest (2025): $2,484 · +3.0% YoY. Source: county tax records.
Cash-flow waterfall
monthlySold comps — $/sqft
last 12 mo · ≤1 miLoading sold comps…