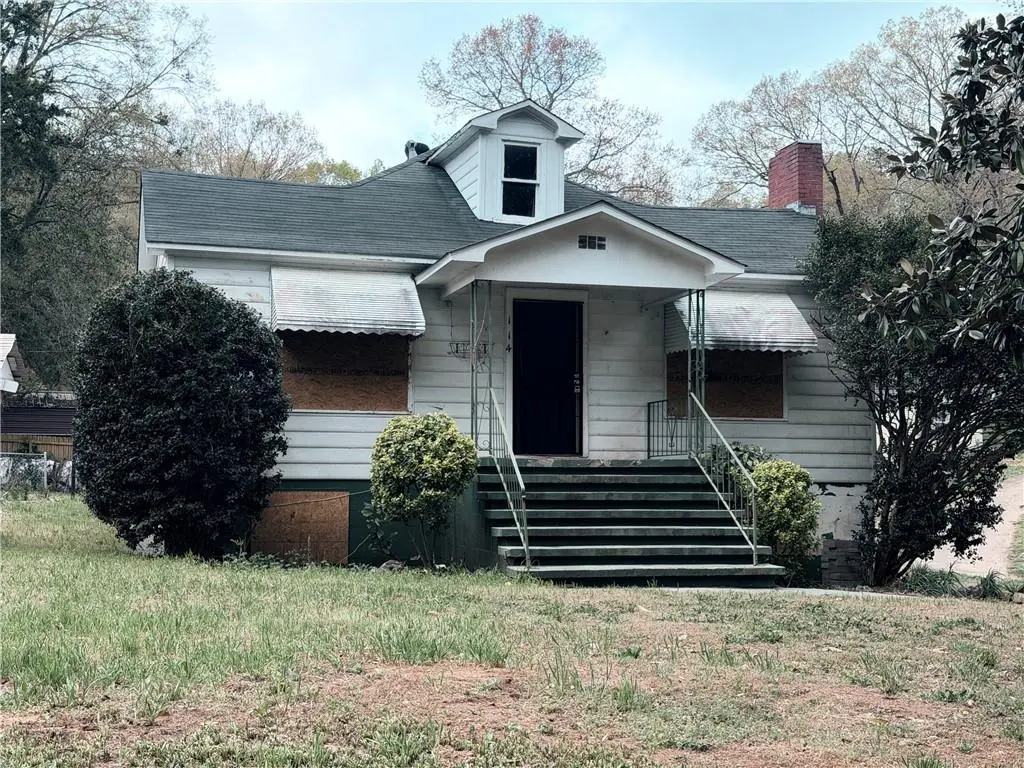
114 Teat St SE · Lindale, GA
Flood risk 1/10 · Minimal
- FEMA flood zone
- X (unshaded)
- Chance of flooding over 30 yrs
- 0.0%
- Est. flood insurance / yr
- $507 – $1,088
Fire risk 4/10 · Minor
- Est. fire insurance / yr
- $963 – $1,789
Heat risk 5/10 · Moderate
- Hot days now (above 104°F)
- 7 days/yr
- Hot days in 30 yrs
- 17 days/yr
Wind risk 4/10 · Minor
- Chance of severe wind over 30 yrs
- 18.0%
Air-quality risk 2/10 · Minimal
- Unhealthy air days now
- 2 days/yr
- Unhealthy air days in 30 yrs
- 2 days/yr
Risk factors via First Street. Map © Google.
Why this score? — see what drove the B- grade
The composite is a weighted blend of 9 inputs, each scored 0–100. Each bar is that input's sub-score; the figure is the points it added to the 100-point composite (weight × sub-score).
- Cash flow +30.0/30.0
- 1% rule +10.0/10.0
- DSCR +10.0/10.0
- ARV discount +7.5/15.0
- Schools +3.5/10.0
- Livability +3.0/5.0
- Rent growth +2.5/5.0
- Condition / age +2.5/5.0
- Appreciation +0.0/10.0
$89,900
🖨 Deal sheet 📄 Offer letter ✓ Due diligence
Listing remarks MLS
Investors wanted. This home has been cleaned out and ready for a straightforward easy rehab. Make your offer today! Perfect for fix & flip investors looking to increase the value. It would be a nice addition to a buy-&-hold portfolio. Sold As-Is. NO BLIND OFFERS. Must use seller’s closing attorney
Key facts
- 0.26 acre lot
- 2 parking spots
- Built 1950
Neighborhood map
What this means for you Summary
Snapshot
- This is a 3-bed/2.0-bath single-family listed at $90k.
Deal economics
- At list price, monthly cash flow is $991 ($12k/yr) — positive.
- The deal already cash-flows at list — no discount required.
- Meets the 1% rule at list price ($2k rent vs $90k).
- Recommended offer: $87k (3.0% below list) — sets the bar for market timing.
- Cap rate 19.5% vs local median 3.2% in Lindale — top-decile yield for the area; either an underpriced asset or a hidden risk that comps aren't pricing in. Stress-test before assuming the spread holds.
Location & tenants
- Location reads 59/100 on livability (#411 in GA) — a working-class tenant base; expect higher turnover. Strengths: cost of living A+, housing A+; Watch: crime C-, schools F, amenities F.
- Floyd County (rural): math 41% / reading 40% proficiency, ranked #45 of 174 in GA (top 26%) — families likely to look elsewhere, expect single-tenant / working-renter base with shorter leases.
- Market conditions: 39 active listings in the ZIP; 3 comparable units currently listed for rent nearby; rentals lingering (median 44d on market — plan ~5-8 weeks vacancy on turnover, expect pricing pressure); 67% of comp listings sitting > 30 days — soft ceiling on asking rent; 355 units permitted in Floyd County in 2024 (0 in 5+ unit buildings).
Forward outlook
- Local home prices are declining (-3.0%/yr); year-one equity from $622 of loan paydown is wiped out by about $3k of value loss. Plan a longer hold.
- Floyd County population projected to shrink 6% by 2050 — rents likely to lag national; underwrite the cash flow, not the appreciation.
- At projected returns (-3.0% appreciation + 3.0% rent growth), your $25k cash investment doubles in ~3 years — after that, you're playing with house money.
Negotiation context
- It's been on market 46 days — a 3% lower offer ($87k) is reasonable based on typical stale-listing flexibility.
- 3 sale attempts since 12y ago with the ask held roughly flat each time — persistent listings suggest the price (not the market) is what's stuck; bring a comps-based counter.
- Current owner paid $45k; list at $90k implies a 100% gain — meaningful room to come down on a strong offer.
Risks & watch-outs
- Watch-outs: built in 1950 — expect roof / HVAC / electrical / plumbing capex.
- Climate carrying-cost: extreme-heat days projected 7→17/yr by 2055 (HVAC capex compounding) — expect insurance premiums to compound above CPI over the hold.
Questions for the listing agent
- It's been on market 46 days. Have you received any prior offers? Is the seller open to a 3% concession, seller financing, or rate buy-down credit?
- Built in 1950 — when were the roof, HVAC, electrical panel, plumbing, and water heater last replaced?
- Is there a deadline driving the sale (1031 exchange, divorce, estate, relocation)? That informs how much negotiation room exists.
- Schools are F-rated, which usually means shorter tenancies and higher turnover. Who's the typical renter profile here, and what's been the actual vacancy rate?
- What's the average days-on-market for RENTAL listings here right now (not sales)? A rising rental-DOM trend means longer vacancies and softer asking-rent achievability than the comps imply.
- What's the recent tenant-quality profile in this submarket — average credit score on applications, eviction rate, late-payment / NSF rate, and stable-employment percentage? A property-management company in the area should have these aggregated.
- How much new for-sale + rental construction is in the pipeline within 1–3 miles? Heavy new supply typically softens prices + rents 12–24 months out; constrained supply supports both.
Investment metrics
- 1% rule
- 2.28% ✓
- Cap rate
- 19.53%
- Cash-on-cash
- 47.26%
- DSCR
- 3.10
- GRM
- 3.7
CMA / ARV
- ARV (median comp)
- $191,174
- List price
- $89,900
- Delta
- -52.97%
- Verdict
- UNDERPRICED
- Comps
- 20 within 1.0 mi
Show comp detail 11 sales within ~0.75 mi
| Address | Dist | Beds/Ba | Sqft | Sold | Price | $/sf | Match |
|---|---|---|---|---|---|---|---|
| 114 Teat St SE | 0.00mi | 3/2.0 | 1,536 (0%) | 0mo | $75,000 | $49 | 100 |
| 14 Summit Dr SE | 0.16mi | 3/2.0 | 1,596 (+4%) | 19mo | $309,000 | $194 | 70 |
| 333 Alfred Ave SE | 0.53mi | 3/2.0 | 1,479 (-4%) | 3mo | $170,000 | $115 | 66 |
| 105 Hooper Ave | 0.36mi | 3/2.0 | 1,459 (-5%) | 14mo | $240,000 | $164 | 63 |
| 3010 Maple Rd SE | 0.45mi | 3/2.0 | 1,619 (+5%) | 14mo | $243,000 | $150 | 58 |
| 3014 Maple Rd SE | 0.42mi | 2/1.5 (-1) | 1,669 (+9%) | 4mo | $210,000 | $126 | 55 |
| 7 Old Rockmart Rd SE | 0.71mi | 3/2.0 | 1,547 (+1%) | 13mo | $321,000 | $207 | 55 |
| 7 Old Rockmart Rd SE | 0.69mi | 3/2.0 | 1,547 (+1%) | 18mo | $170,000 | $110 | 51 |
| 327 Flora Ave SE | 0.61mi | 4/2.0 (+1) | 1,425 (-7%) | 7mo | $225,000 | $158 | 48 |
| 332 Flora Ave SE | 0.60mi | 3/1.0 | 1,378 (-10%) | 9mo | $208,000 | $151 | 43 |
| 124 Avenue D SE | 0.71mi | 3/1.0 | 1,306 (-15%) | 24mo | $120,000 | $92 | 18 |
Match score weights: distance 35% · size 25% · config 20% · recency 20%. Top-matched comps best support the ARV.
Projected returns pro-forma
-3.0% appreciation · 3.0% rent growth · sell at horizon
- IRR
- 44.6%
- Equity multiple
- 2.93×
- Total profit
- $48,607
- Equity at exit
- $13,404
- IRR
- 50.6%
- Equity multiple
- 5.92×
- Total profit
- $123,773
- Equity at exit
- $7,773
Cash invested: $25,172 (down + closing). Projections, not guarantees.
Landlord ↔ Tenant lean methodology
- Overall (STATE)
- 90 Strongly Landlord-Friendly
- State Georgia
- 90 Strongly Landlord-Friendly · R+3
- County
- — inherits STATE
- City
- — inherits STATE
ZIP-level market 30147
- Home prices YoY
- -14.3%
- Active inventory
- 39
- Price-to-rent
- 3.7×
Monthly cashflow live
- Estimated rent
- $2,051 medium interval (Pro) →
- Mortgage (P&I)
- −$471
- Tax from tax record
- −$120 /mo · $1,438/yr
- Insurance
- −$37
- HOA
- −$0
- Vacancy / Maint / Mgmt
- −$431
- Net cashflow
- $991
Break-even live
UW: 25.0% down · 7.5% · 30yr · 1.5% tax · 5.0% vac · 8.0% maint · 8.0% mgmt
Financing live
Cash to close
- Down payment
- $22,475
- Closing costs
- $2,697
- Reserves months
- —
- Total cash needed
- —
Loan-product check · same deal, 3 products live
Conventional
25% down · 7.5% · 30yr
- Down + closing
- —
- Monthly P&I
- —
- Monthly cashflow
- —
- DSCR
- —
- Eligible?
- —
Personal DTI + credit; lowest rate.
DSCR
20% down · 8.5% · 30yr
- Down + closing
- —
- Monthly P&I
- —
- Monthly cashflow
- —
- DSCR
- —
- Eligible?
- —
No personal income docs; deal must DSCR.
Hard money
10% down · 12.0% · 12mo
- Down + closing
- —
- Monthly P&I
- —
- Monthly cashflow
- —
- DSCR
- —
- Eligible?
- —
Short-term bridge; refi at stabilization.
Rent comps 3 comps
| Address | Beds | Baths | Sqft | Rent | $/sqft | DOM | Units | Dist |
|---|---|---|---|---|---|---|---|---|
| 109 Chateau Dr SE Rome, GA | 4.0 | 3.0 | 1911 | $2,400 | $1.26 | 43d | 1 | 1.19mi |
| 50 Chateau Dr SE Rome, GA | 2.0–3.0 | 1.5–2.0 | 1255 | $1,599 | $1.27 | 2d | 4 | 1.25mi |
| 48 Chateau Dr SE Rome, GA | 1.0–2.0 | 1.0–1.5 | 802 | $2,200 | $2.74 | 43d | 5 | 1.33mi |
Listing history 12 events
-
2026-06-10statusdays on market $89,900 Under Contract 46 DOM
-
2026-05-19status Pending 318-char remark
Show marketing remark (318 chars)
Investors wanted. This home has been cleaned out and ready for a straightforward easy rehab. Make your offer today! Perfect for fix & flip investors looking to increase the value. It would be a nice addition to a buy-&-hold portfolio. Sold As-Is. NO BLIND OFFERS. Must use seller’s closing attorney
-
2026-04-02$89,900 Active 318-char remark
Show marketing remark (312 chars)
Investors wanted. This home has been cleaned out and ready for a straightforward easy rehab. Make your offer today! Perfect for fix & flip investors looking to increase the value. It would be a nice addition to a buy-&-hold portfolio. Sold As-Is. NO BLIND OFFERS. Must use seller's closing attorney
-
2026-04-02$89,900 New 312-char remark
Show marketing remark (312 chars)
Investors wanted. This home has been cleaned out and ready for a straightforward easy rehab. Make your offer today! Perfect for fix & flip investors looking to increase the value. It would be a nice addition to a buy-&-hold portfolio. Sold As-Is. NO BLIND OFFERS. Must use seller's closing attorney
-
2018-07-23soldstatus $45,000
-
2014-06-07price $58,900
-
2014-05-27soldstatus $58,900
-
2014-05-23historical
-
2014-05-22soldstatus $58,900 Sold
-
2014-04-17status Under Contract
-
2014-04-17price $59,900
-
2014-03-10$59,900 New
ⓘ Source: listings_history table (triggers on properties + properties_extension) + one-shot
backfill from property_details.listing_events for pre-trigger history.
Tax reassessment forecast GA · Resets to sale price
- Current annual tax
- $1,438 · $120/mo
- Projected year-2 tax
- $1,438 · $120/mo
- Expected delta
- $0/yr ($0/mo · 0.0%)
ⓘ Screening estimate from a state-policy table — verify with the county assessor before closing.
Climate risk First Street
- Flood 1/10 Low FEMA zone X (unshaded) · 0% chance over 30 yrs
- Wildfire 4/10 Moderate
- Heat 5/10 Major 7 d/yr ≥104°F today · 17 d/yr by 30 yrs out
- Wind 4/10 Moderate 18% chance of damaging wind over 30 yrs
- Air quality 2/10 Low 2 unhealthy d/yr today · 2 by 30 yrs out
Nearby sold comps map
Loading sold comps map…
Walkable amenities ~0.75 mi
Loading nearby amenities…
Taxation est. · year 1
- Rental income
- $24,609
- − Mortgage interest
- −$5,036
- − Property taxes
- −$1,438
- − Insurance
- −$450
- − Repairs & maintenance
- −$1,969
- − Management
- −$1,969
- − Depreciation
- −$2,615
- Taxable income
- $11,133
- Est. tax owed @ 24.0%
- −$2,672
- After-tax cash flow
- $9,224/yr
For passive investors: Depreciation is non-cash, so a rental often shows a tax loss while cash-flowing — sheltering income. Rental losses are passive: they offset passive income freely, and up to $25,000/yr can offset ordinary (W-2) income if you actively participate and your MAGI is under $100k (phasing out to $0 by $150k); unused losses carry forward. On sale, claimed depreciation is recaptured at up to 25%, and gains may owe capital-gains tax (a 1031 exchange can defer both). Figures are a year-1 estimate at your 24.0% rate — not tax advice; consult a CPA.
Schools (NCES district)
- District
- Floyd County
- NCES district ID
- 1302190
- Math proficiency
- 41% ▼ -5.00%
- Reading proficiency
- 40% ▼ -4.00%
- Median HH income
- $47,083
- Composite
- 34.64/100
- National rank
- #5143
- State rank
- #45 of 174 in GA
Livability — Lindale
- Score
- 59/100
- State rank
- #411
- US rank
- #20340
Category grades
Schools grade is shown separately in the Schools card above.
Census & demographics
- Census place
- Lindale, GA
- Population (ZIP)
- 4,855
Population outlook (Floyd County) Hauer SSP2
- Today (2025)
- 96,321 people
- By 2030
- 95,532 · -0.8%
- By 2040
- 93,332 · -3.1%
- By 2050
- 90,850 · -5.7%
- By 2075
- 84,989 · -11.8%
- By 2100
- 76,097 · -21.0%
Race, ethnicity, and origin ACS 2023
- Neighborhood character
- Predominantly White (93%)
- Race & ethnicity
- White 93% Hispanic / Latino 5% Two or more races 2%
- Hispanic origin (detail)
- Mexican 4%
- Common ancestry
- Serbian 2% Italian 1% Romanian 1%
- Foreign-born
- 2% · Canada
- Languages at home
- 96% English-only · Spanish 4%
Political lean MEDSL · Floyd
- 2024 margin
- Solid R (+42.0) · D 28.8% · R 70.7%
- 2008→2024 swing
- -5.6pp toward R · 2008: -36.4pp · 2024: -42.0pp
- All cycles
- 2024: R+42.0 2020: R+41.1 2016: R+43.5 2012: R+39.9 2008: R+36.4
Not yet ingested
- Civics
- —
Market trends
- HPI YoY
- ▼ -45.07%
- Current HPI
- 269.7475
- Rent YoY
- —
- Metro
- —
- State GDP YoY
- ▲ 2.66%
- F500 in state
- 28
Industry mix (Fortune 500 HQ in GA)
| Industry | F500 HQs | Revenue |
|---|---|---|
| Paper / Packaging | 2 | $29B |
|
||
| Retail | 1 | $160B |
|
||
| Transportation / Logistics | 1 | $91B |
|
||
| Airlines | 1 | $62B |
|
||
| Consumer Goods | 1 | $47B |
|
||
| Utilities | 1 | $25B |
|
||
Price history
+50.1% since first listed11 events — show timeline
- 2026-05-19 Pending — FMLS
- 2026-04-02 Listed $89,900 GAMLS
- 2026-04-02 Listed $89,900 FMLS
- 2018-07-23 Sold (Public Records) $45,000 Public Records
- 2014-06-07 Price Changed $58,900 GAMLS
- 2014-05-27 Sold (Public Records) $58,900 Public Records
- 2014-05-23 Listing Removed — GAMLS
- 2014-05-22 Sold (MLS) $58,900 GAMLS
- 2014-04-17 Pending — GAMLS
- 2014-04-17 Price Changed $59,900 GAMLS
- 2014-03-10 Listed $59,900 GAMLS
Property tax history
+10.8%/yrLatest (2025): $1,438 · +40.5% YoY. Source: county tax records.
Cash-flow waterfall
monthlySold comps — $/sqft
last 12 mo · ≤1 miLoading sold comps…