 🏷️ Likely Rental
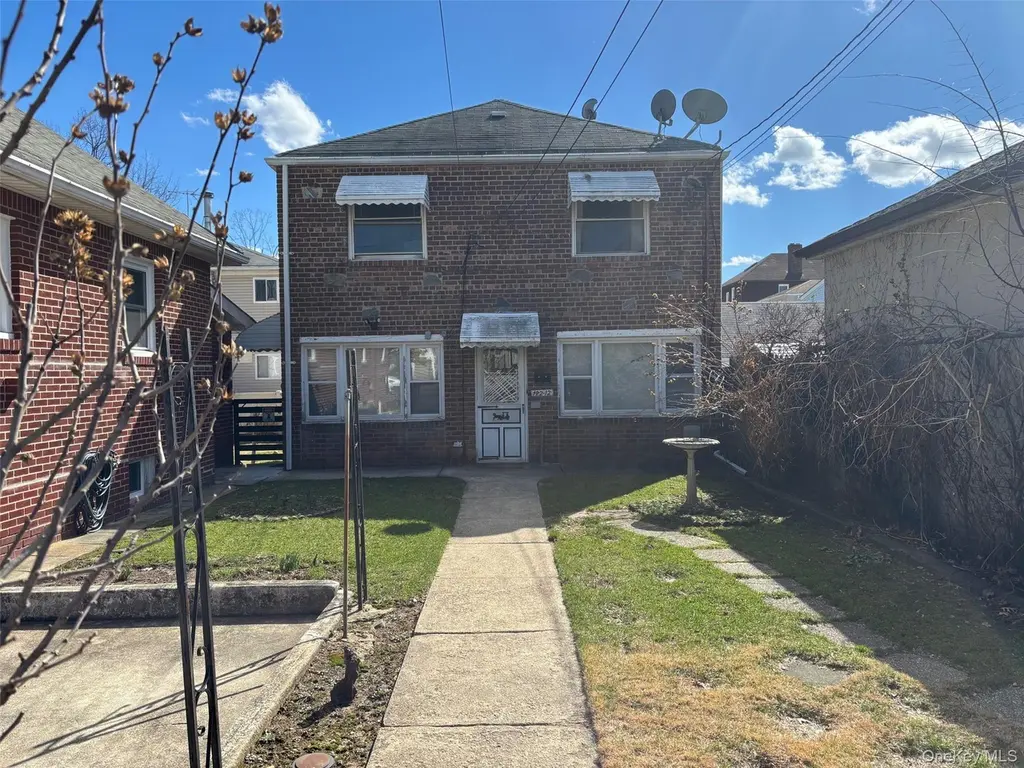
12212 6th Ave · New York, NY
Flood risk 1/10 · Minimal
- FEMA flood zone
- X (unshaded)
- Chance of flooding over 30 yrs
- 0.0%
- Est. flood insurance / yr
- $507 – $1,088
Fire risk 1/10 · Minimal
- Est. fire insurance / yr
- $691 – $1,283
Heat risk 6/10 · Moderate
- Hot days now (above 99°F)
- 7 days/yr
- Hot days in 30 yrs
- 15 days/yr
Wind risk 6/10 · Moderate
- Chance of severe wind over 30 yrs
- 27.0%
Air-quality risk 4/10 · Minor
- Unhealthy air days now
- 6 days/yr
- Unhealthy air days in 30 yrs
- 6 days/yr
Risk factors via First Street. Map © Google.
Why this score? — see what drove the D+ grade
The composite is a weighted blend of 9 inputs, each scored 0–100. Each bar is that input's sub-score; the figure is the points it added to the 100-point composite (weight × sub-score).
- ARV discount +15.0/15.0
- Cash flow +11.3/30.0
- Rent growth +5.0/5.0
- Schools +5.0/10.0
- Livability +3.8/5.0
- DSCR +3.3/10.0
- 1% rule +2.9/10.0
- Condition / age +2.5/5.0
- Appreciation +0.0/10.0
$679,999
🖨 Deal sheet 📄 Offer letter ✓ Due diligence
Multi-family units
County records classify this as Multi-Family (2-4 Unit). Listing-text estimate: 2 units. confirmed
Listing remarks
Detached Brick 2-family. 1st floor tenant occupied, 2nd floor vacant, no basement. House needs updating.
Key facts
- 2,500 sq ft lot
- 4 parking spots
- Built 1935
Property features AI
Exterior
- Parking: Private off-street parking accessed via driveway (4 parking spaces total); No carport
- Utilities: Con Edison electric service; Natural gas connected; Cable available; Public sewer
- Home design: Duplex; Fixer condition
- Construction: Brick construction; Slab foundation
- Exterior features: Garden; Mailbox
Interior
- Kitchen: Eat-in kitchen (appliances not specified)
- Bedrooms: Two 2-bedroom units
- Flooring: Hardwood floors
- Bathrooms: Two full bathrooms
- Heating & cooling: Hot water heating; No central cooling
- Interior features: First-floor bedroom; Eat-in kitchen; Natural woodwork; Patio
- Laundry & utility: No basement (no lower-level utility space listed)
Neighborhood map
What this means for you Summary
Snapshot
- This is a 2 × 2-bed/1.0-bath units multifamily listed at $680k.
Deal economics
- At list price, monthly cash flow is $-250 ($-3k/yr) — negative. Per door: $-125/mo.
- To cash-flow at today's rent, offer at most $636k (6.5% below list).
- To meet the 1% rule (rent ≥ 1% of price), the offer needs to be $534k (21.5% below list).
- Recommended offer: $534k (21.5% below list) — sets the bar for 1% rule.
- Cap rate 5.9% vs local median 2.6% in New York — top-decile yield for the area; either an underpriced asset or a hidden risk that comps aren't pricing in. Stress-test before assuming the spread holds.
Location & tenants
- Location reads 75/100 on livability (#268 in NY, #4,188 nationally) — a middle-class / working-renter tenant base. Strengths: amenities A+, commute A+, health & safety A; Watch: crime F, cost of living F.
- Market conditions: Rents rising fast (+12.1%/yr); 132 active listings in the ZIP; 4 comparable units currently listed for rent nearby; rentals at typical pace (median 25d on market — plan ~3-4 weeks tenant-placement turnaround); solid renter incomes; 5,302 units permitted in Queens County in 2024 (4,918 in 5+ unit buildings).
- At $5,340/mo this rent would consume 74% of the median local household income ($87k/yr) (locally 1545% of renters already pay >50% of income on rent) — very limited rent-growth headroom before tenants either downsize or default.
Forward outlook
- Local home prices are declining (-3.0%/yr); year-one equity from $5k of loan paydown is wiped out by about $20k of value loss. Plan a longer hold.
- Queens County population projected at +16% by 2050 — long-run rental-demand tailwind backs the buy-and-hold thesis.
Negotiation context
- It's been on market 45 days — a 3% lower offer ($660k) is reasonable based on typical stale-listing flexibility.
Risks & watch-outs
- Watch-outs: built in 1935 — expect roof / HVAC / electrical / plumbing capex.
- Climate carrying-cost: major wind risk, 27% chance of damaging wind over 30y; extreme-heat days projected 7→15/yr by 2055 (HVAC capex compounding) — expect insurance premiums to compound above CPI over the hold.
Questions for the listing agent
- What do current leases actually rent for vs. the listed asking? Can we see a recent rent roll and the last 12 months of T-12 income?
- It's been on market 45 days. Have you received any prior offers? Is the seller open to a 21% concession, seller financing, or rate buy-down credit?
- Can we see the unit-by-unit rent roll, current vacancy, and any below-market leases? What's the average tenancy length?
- What capital expenditures (roof, boiler, parking lot, exteriors) have been made in the last 5 years, and what's planned in the next 2?
- Built in 1935 — when were the roof, HVAC, electrical panel, plumbing, and water heater last replaced?
- Is there a deadline driving the sale (1031 exchange, divorce, estate, relocation)? That informs how much negotiation room exists.
- Schools are B-rated — typically a magnet for longer-tenancy family renters. What's the average tenant stay here, and is there a school-zone premium baked into asking?
- Crime grade is F in this area — have there been break-ins, vandalism, or insurance claims at this property in the last 3 years? What carrier currently insures it and at what premium?
- The area grade is low — what's the realistic commute time and amenity access for the typical tenant pool here? Any planned neighborhood developments (good or bad) we should know about?
- What's the average days-on-market for RENTAL listings here right now (not sales)? A rising rental-DOM trend means longer vacancies and softer asking-rent achievability than the comps imply.
- What's the recent tenant-quality profile in this submarket — average credit score on applications, eviction rate, late-payment / NSF rate, and stable-employment percentage? A property-management company in the area should have these aggregated.
- How much new apartment / multifamily construction is in the pipeline within 1–3 miles? Heavy new supply (>2% of stock underway) typically softens rents 12–24 months out; light construction supports rent growth.
Investment metrics
- 1% rule
- 0.79% ✗
- Cap rate
- 5.85%
- Cash-on-cash
- -1.58%
- DSCR
- 0.93
- GRM
- 10.6
CMA / ARV
- ARV (on-the-fly)
- $911,088
- Comps found
- 2
Show comp detail 2 sales within ~0.75 mi
| Address | Dist | Beds/Ba | Sqft | Sold | Price | $/sf | Match |
|---|---|---|---|---|---|---|---|
| 125-13 6th Ave | 0.15mi | 4/2.0 | 1,252 (-3%) | 0mo | $880,000 | $703 | 87 |
| 123-13 13th Ave | 0.31mi | 4/2.0 | 1,296 (0%) | 10mo | $900,000 | $694 | 78 |
Match score weights: distance 35% · size 25% · config 20% · recency 20%. Top-matched comps best support the ARV.
Projected returns pro-forma
-3.0% appreciation · 8.0% rent growth · sell at horizon
- IRR
- -13.7%
- Equity multiple
- 0.49×
- Total profit
- $-97,954
- Equity at exit
- $101,390
- IRR
- 1.4%
- Equity multiple
- 1.12×
- Total profit
- $22,393
- Equity at exit
- $58,794
Cash invested: $190,400 (down + closing). Projections, not guarantees.
Landlord ↔ Tenant lean methodology
- Overall (CITY)
- 0 Strongly Tenant-Friendly
- State New York
- 15 Strongly Tenant-Friendly · D+10
- County
- — inherits STATE
- City New York
- 0 Strongly Tenant-Friendly · D+34
ZIP-level market 11356
- Home prices YoY
- -28.9%
- Rents YoY
- 12.1%
- Active inventory
- 132
- Price-to-rent
- 21.2×
Monthly cashflow live
- Estimated rent
- $5,340 medium interval (Pro) →
- Mortgage (P&I)
- −$3,566
- Tax from tax record
- −$619 /mo · $7,432/yr
- Insurance
- −$283
- HOA
- −$0
- Vacancy / Maint / Mgmt
- −$1,121
- Net cashflow
- $-250
Break-even live
2-unit breakdown (identical units grouped — click to expand)
| Units | Beds | Baths | Est. rent |
|---|---|---|---|
| 2× units | 2 | 1 | $5,340 |
| #1 | 2 | 1 | $2,670 |
| #2 | 2 | 1 | $2,670 |
| Total (2 units) | $5,340 | ||
UW: 25.0% down · 7.5% · 30yr · 1.5% tax · 5.0% vac · 8.0% maint · 8.0% mgmt
Financing live
Cash to close
- Down payment
- $170,000
- Closing costs
- $20,400
- Reserves months
- —
- Total cash needed
- —
Loan-product check · same deal, 3 products live
Conventional
25% down · 7.5% · 30yr
- Down + closing
- —
- Monthly P&I
- —
- Monthly cashflow
- —
- DSCR
- —
- Eligible?
- —
Personal DTI + credit; lowest rate.
DSCR
20% down · 8.5% · 30yr
- Down + closing
- —
- Monthly P&I
- —
- Monthly cashflow
- —
- DSCR
- —
- Eligible?
- —
No personal income docs; deal must DSCR.
Hard money
10% down · 12.0% · 12mo
- Down + closing
- —
- Monthly P&I
- —
- Monthly cashflow
- —
- DSCR
- —
- Eligible?
- —
Short-term bridge; refi at stabilization.
Rent comps 4 comps
| Address | Beds | Baths | Sqft | Rent | $/sqft | DOM | Units | Dist |
|---|---|---|---|---|---|---|---|---|
| 1332 130th St College Point, NY | 3.0 | 1.0 | 1388 | $3,000 | $2.16 | 15d | 1 | 0.47mi |
| 1332 130th St College Point, NY | 3.0 | 1.0 | 1388 | $2,850 | $2.05 | 25d | 1 | 0.47mi |
| 114-09 Taipei Ct Unit 2fl Flushing, NY | 3.0 | 2.5 | 1600 | $3,500 | $2.19 | 25d | 1 | 0.52mi |
| 7 Dune Ct Unit 1 Bronx, NY | 4.0 | 2.5 | 1600 | $4,300 | $2.69 | 25d | 1 | 1.37mi |
Listing history 3 events
-
2026-05-04status Pending
-
2026-03-21$679,999 Active
-
2026-03-18historical $679,999
ⓘ Source: listings_history table (triggers on properties + properties_extension) + one-shot
backfill from property_details.listing_events for pre-trigger history.
Tax reassessment forecast NY · Partial reset (capped growth)
- Current annual tax
- $7,432 · $619/mo
- Projected year-2 tax
- $9,462 · $788/mo
- Expected delta
- +$2,030/yr (+$169/mo · 27.3%)
ⓘ Screening estimate from a state-policy table — verify with the county assessor before closing.
Climate risk First Street
- Flood 1/10 Low FEMA zone X (unshaded) · 0% chance over 30 yrs
- Wildfire 1/10 Low
- Heat 6/10 Major 7 d/yr ≥99°F today · 15 d/yr by 30 yrs out
- Wind 6/10 Major 27% chance of damaging wind over 30 yrs
- Air quality 4/10 Moderate 6 unhealthy d/yr today · 6 by 30 yrs out
Nearby sold comps map
Loading sold comps map…
Walkable amenities ~0.75 mi
Loading nearby amenities…
Taxation est. · year 1
- Rental income
- $64,080
- − Mortgage interest
- −$38,091
- − Property taxes
- −$7,432
- − Insurance
- −$3,400
- − Repairs & maintenance
- −$5,126
- − Management
- −$5,126
- − Depreciation
- −$19,782
- Taxable loss
- −$14,877
- Est. tax savings @ 24.0%
- +$3,570
- After-tax cash flow
- $570/yr
For passive investors: Depreciation is non-cash, so a rental often shows a tax loss while cash-flowing — sheltering income. Rental losses are passive: they offset passive income freely, and up to $25,000/yr can offset ordinary (W-2) income if you actively participate and your MAGI is under $100k (phasing out to $0 by $150k); unused losses carry forward. On sale, claimed depreciation is recaptured at up to 25%, and gains may owe capital-gains tax (a 1031 exchange can defer both). Figures are a year-1 estimate at your 24.0% rate — not tax advice; consult a CPA.
Schools (NCES district)
No district data.
Livability — New York
- Score
- 75/100
- State rank
- #268
- US rank
- #4188
Category grades
Schools grade is shown separately in the Schools card above.
Census & demographics
- Census place
- New York, NY
- County
- Queens County · 1,914,869 people
- City population
- 7,731,280
- Metro
- New York-Newark-Jersey City, NY-NJ-PA
- Population (ZIP)
- 25,824
- Household income
- $86,730
- Rent vs Own
- Severe rent burden
- 1545.0
Population outlook (Queens County) Hauer SSP2
- Today (2025)
- 2,546,320 people
- By 2030
- 2,643,059 · +3.8%
- By 2040
- 2,815,563 · +10.6%
- By 2050
- 2,944,423 · +15.6%
- By 2075
- 3,123,338 · +22.7%
- By 2100
- 3,098,688 · +21.7%
Race, ethnicity, and origin ACS 2023
- Neighborhood character
- Diverse neighborhood (Simpson 0.66)
- Race & ethnicity
- Hispanic / Latino 42% Asian 35% White 21% Two or more races 8%
- Hispanic origin (detail)
- Mexican 3% Puerto Rican 5% Dominican 8%
- Common ancestry
- Romanian 1%
- Foreign-born
- 53% · Canada, China, South Korea
- Languages at home
- 26% English-only · Spanish 35% Chinese 23% Other Indo-European 8%
Political lean MEDSL · Queens
- 2024 margin
- Strong D (+24.6) · D 62.3% · R 37.7%
- 2008→2024 swing
- -26.2pp toward R · 2008: 50.8pp · 2024: 24.6pp
- All cycles
- 2024: D+24.6 2020: D+45.2 2016: D+53.4 2012: D+58.5 2008: D+50.8
Not yet ingested
- Civics
- —
Market trends
- HPI YoY
- ▼ -95.50%
- Current HPI
- 235.1217
- Rent YoY
- ▲ 12.13%
- Metro
- New York-Newark-Jersey City, NY-NJ-PA
- State GDP YoY
- ▲ 2.60%
- F500 in state
- 92
Industry mix (Fortune 500 HQ in NY)
| Industry | F500 HQs | Revenue |
|---|---|---|
| Financial Services | 10 | $950B |
|
||
| Consumer Goods | 9 | $162B |
|
||
| Insurance | 4 | $225B |
|
||
| Telecommunications | 2 | $144B |
|
||
| Pharmaceuticals | 2 | $112B |
|
||
| Media / Entertainment | 2 | $69B |
|
||
Price history
+0.0% since first listed3 events — show timeline
- 2026-05-04 Pending — OneKey® MLS as Distributed by MLS Grid
- 2026-03-21 Listed $679,999 OneKey® MLS as Distributed by MLS Grid
- 2026-03-18 Coming Soon $679,999 OneKey® MLS as Distributed by MLS Grid
Property tax history
+5.4%/yrLatest (2025): $7,432 · +3.4% YoY. Source: county tax records.
Cash-flow waterfall
monthlySold comps — $/sqft
last 12 mo · ≤1 miLoading sold comps…