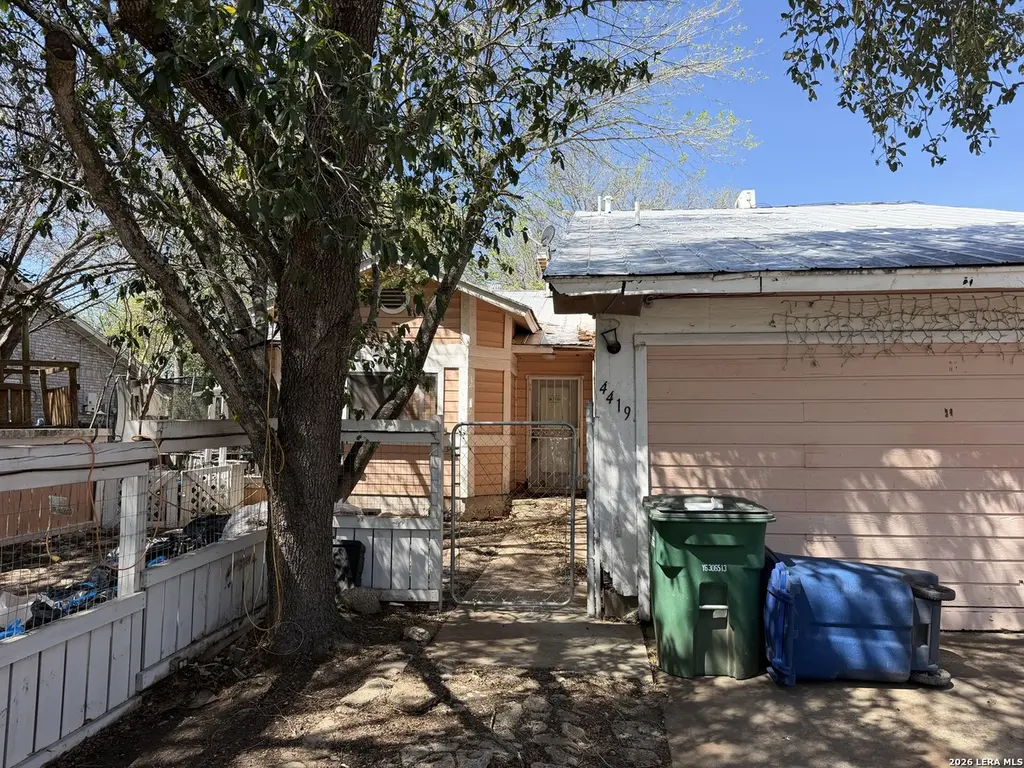
4419 Misty Spg · San Antonio, TX
Flood risk 1/10 · Minimal
- FEMA flood zone
- X (unshaded)
- Chance of flooding over 30 yrs
- 0.0%
- Est. flood insurance / yr
- $507 – $1,088
Fire risk 3/10 · Minor
- Est. fire insurance / yr
- $1,222 – $2,270
Heat risk 8/10 · Major
- Hot days now (above 108°F)
- 7 days/yr
- Hot days in 30 yrs
- 22 days/yr
Wind risk 8/10 · Major
- Chance of severe wind over 30 yrs
- 80.0%
Air-quality risk 2/10 · Minimal
- Unhealthy air days now
- 0 days/yr
- Unhealthy air days in 30 yrs
- 1 days/yr
Risk factors via First Street. Map © Google.
Why this score? — see what drove the C- grade
The composite is a weighted blend of 9 inputs, each scored 0–100. Each bar is that input's sub-score; the figure is the points it added to the 100-point composite (weight × sub-score).
- ARV discount +15.0/15.0
- Cash flow +14.5/30.0
- 1% rule +6.4/10.0
- DSCR +4.4/10.0
- Livability +4.0/5.0
- Rent growth +2.7/5.0
- Condition / age +2.5/5.0
- Schools +2.4/10.0
- Appreciation +0.0/10.0
$150,000
🖨 Deal sheet 📄 Offer letter ✓ Due diligence
Listing remarks MLS
This is an Investor Special. It has a nice lot and privacy in the back.
Key facts
- Generous lot
- Outdoor space
- Dining
Tags
Neighborhood map
What this means for you Summary
Snapshot
- This is a 3-bed/2.0-bath single-family listed at $150k.
Deal economics
- At list price, monthly cash flow is $33 ($399/yr) — positive.
- The deal already cash-flows at list — no discount required.
- Meets the 1% rule at list price ($2k rent vs $150k).
- Recommended offer: $141k (6.0% below list) — sets the bar for market timing.
- Cap rate 6.6% vs local median 3.8% in San Antonio — top-decile yield for the area; either an underpriced asset or a hidden risk that comps aren't pricing in. Stress-test before assuming the spread holds.
Location & tenants
- Location reads 80/100 on livability (#31 in TX, #1,616 nationally) — a professional / high-income tenant draw. Strengths: amenities A+, commute A+, cost of living A+; Watch: schools C-, crime F.
- Judson ISD (suburban): math 21% / reading 33% proficiency, ranked #660 of 826 in TX (top 80%) — low school quality limits family demand, transient renter base, plan for 1-2y turnover.
- Market conditions: Rents flat; 187 active listings in the ZIP; 40 comparable units currently listed for rent nearby; rentals at typical pace (median 24d on market — plan ~3-4 weeks tenant-placement turnaround); 8,308 units permitted in Bexar County in 2024 (2,506 in 5+ unit buildings).
Forward outlook
- Local home prices are declining (-3.0%/yr); year-one equity from $1k of loan paydown is wiped out by about $4k of value loss. Plan a longer hold.
- Bexar County population projected at +50% by 2050 — long-run rental-demand tailwind backs the buy-and-hold thesis.
Negotiation context
- It's been on market 84 days — a 6% lower offer ($141k) is reasonable based on typical stale-listing flexibility.
- 2 sale attempts since 19y ago with the ask held roughly flat each time — persistent listings suggest the price (not the market) is what's stuck; bring a comps-based counter.
Risks & watch-outs
- Watch-outs: property tax is 3.7% of price.
- Climate carrying-cost: severe wind risk, 80% chance of damaging wind over 30y; extreme-heat days projected 7→22/yr by 2055 (HVAC capex compounding) — expect insurance premiums to compound above CPI over the hold.
Questions for the listing agent
- It's been on market 84 days. Have you received any prior offers? Is the seller open to a 6% concession, seller financing, or rate buy-down credit?
- Property tax is high relative to price — has the assessment been appealed recently, and will the sale trigger a re-assessment?
- Why hasn't it sold? Are there any deal-killer items the seller is aware of (foundation, flood, title, zoning, code violations)?
- Is there a deadline driving the sale (1031 exchange, divorce, estate, relocation)? That informs how much negotiation room exists.
- Crime grade is F in this area — have there been break-ins, vandalism, or insurance claims at this property in the last 3 years? What carrier currently insures it and at what premium?
- What's the average days-on-market for RENTAL listings here right now (not sales)? A rising rental-DOM trend means longer vacancies and softer asking-rent achievability than the comps imply.
- What's the recent tenant-quality profile in this submarket — average credit score on applications, eviction rate, late-payment / NSF rate, and stable-employment percentage? A property-management company in the area should have these aggregated.
- How much new for-sale + rental construction is in the pipeline within 1–3 miles? Heavy new supply typically softens prices + rents 12–24 months out; constrained supply supports both.
Investment metrics
- 1% rule
- 1.14% ✓
- Cap rate
- 6.56%
- Cash-on-cash
- 0.95%
- DSCR
- 1.04
- GRM
- 7.3
CMA / ARV
- ARV (median comp)
- $213,599
- List price
- $150,000
- Delta
- -29.77%
- Verdict
- UNDERPRICED
- Comps
- 20 within 1.0 mi
Show comp detail 12 sales within ~0.75 mi
| Address | Dist | Beds/Ba | Sqft | Sold | Price | $/sf | Match |
|---|---|---|---|---|---|---|---|
| 4335 Misty Spgs | 0.07mi | 4/2.0 (+1) | 2,040 (+5%) | 8mo | $224,000 | $110 | 76 |
| 4415 Misty Springs Dr | 0.01mi | 4/2.0 (+1) | 2,007 (+3%) | 16mo | $210,000 | $105 | 76 |
| 5826 Ivans Farm | 0.23mi | 3/2.5 | 2,010 (+4%) | 11mo | $250,000 | $124 | 73 |
| 4938 Ballot Park | 0.36mi | 3/2.0 | 1,851 (-5%) | 12mo | $295,000 | $159 | 65 |
| 5726 Ivans Farm | 0.18mi | 3/2.0 | 1,705 (-12%) | 8mo | $234,995 | $138 | 65 |
| 5146 Fountain Hl | 0.42mi | 4/2.0 (+1) | 1,835 (-6%) | 5mo | $245,000 | $134 | 62 |
| 4710 Acacia Hl | 0.38mi | 4/2.0 (+1) | 1,853 (-5%) | 18mo | $244,995 | $132 | 55 |
| 5202 Fountain Hl | 0.41mi | 3/2.5 | 2,185 (+12%) | 14mo | $254,995 | $117 | 46 |
| 5019 Braden Gate | 0.46mi | 4/2.5 (+1) | 2,110 (+9%) | 14mo | $265,000 | $126 | 46 |
| 5419 Eclipse St | 0.62mi | 4/3.0 (+1) | 1,871 (-4%) | 14mo | $219,990 | $118 | 44 |
| 3703 Autumn Ln | 0.75mi | 3/2.0 | 1,688 (-13%) | 7mo | $219,900 | $130 | 38 |
| 6122 Joes Farm | 0.61mi | 4/2.0 (+1) | 1,707 (-12%) | 14mo | $221,000 | $129 | 34 |
Match score weights: distance 35% · size 25% · config 20% · recency 20%. Top-matched comps best support the ARV.
Projected returns pro-forma
-3.0% appreciation · 0.75% rent growth · sell at horizon
- IRR
- -17.9%
- Equity multiple
- 0.39×
- Total profit
- $-25,768
- Equity at exit
- $22,365
- IRR
- -16.5%
- Equity multiple
- 0.20×
- Total profit
- $-33,721
- Equity at exit
- $12,969
Cash invested: $42,000 (down + closing). Projections, not guarantees.
Landlord ↔ Tenant lean methodology
- Overall (STATE)
- 87 Strongly Landlord-Friendly
- State Texas
- 87 Strongly Landlord-Friendly · R+5
- County
- — inherits STATE
- City
- — inherits STATE
ZIP-level market 78244
- Home prices YoY
- -4.4%
- Rents YoY
- 0.8%
- Active inventory
- 187
- Price-to-rent
- 7.3×
Monthly cashflow live
- Estimated rent
- $1,704 high interval (Pro) →
- Mortgage (P&I)
- −$787
- Tax from tax record
- −$464 /mo · $5,569/yr
- Insurance
- −$62
- HOA
- −$0
- Vacancy / Maint / Mgmt
- −$358
- Net cashflow
- $33
Break-even live
UW: 25.0% down · 7.5% · 30yr · 1.5% tax · 5.0% vac · 8.0% maint · 8.0% mgmt
Financing live
Cash to close
- Down payment
- $37,500
- Closing costs
- $4,500
- Reserves months
- —
- Total cash needed
- —
Loan-product check · same deal, 3 products live
Conventional
25% down · 7.5% · 30yr
- Down + closing
- —
- Monthly P&I
- —
- Monthly cashflow
- —
- DSCR
- —
- Eligible?
- —
Personal DTI + credit; lowest rate.
DSCR
20% down · 8.5% · 30yr
- Down + closing
- —
- Monthly P&I
- —
- Monthly cashflow
- —
- DSCR
- —
- Eligible?
- —
No personal income docs; deal must DSCR.
Hard money
10% down · 12.0% · 12mo
- Down + closing
- —
- Monthly P&I
- —
- Monthly cashflow
- —
- DSCR
- —
- Eligible?
- —
Short-term bridge; refi at stabilization.
Rent comps 40 comps
| Address | Beds | Baths | Sqft | Rent | $/sqft | DOM | Units | Dist |
|---|---|---|---|---|---|---|---|---|
| 4439 Misty Springs Dr San Antonio, TX | 3.0 | 2.5 | 1591 | $1,495 | $0.94 | 12d | 1 | 0.06mi |
| 5727 Jones Fall Dr San Antonio, TX | 3.0 | 2.0 | 1544 | $1,495 | $0.97 | 23d | 1 | 0.11mi |
| 5719 Country Sun Dr San Antonio, TX | 3.0 | 2.0 | 1485 | $1,400 | $0.94 | 23d | 1 | 0.14mi |
| 5742 Summer Fest Dr San Antonio, TX | 4.0 | 2.5 | 2278 | $1,800 | $0.79 | 3d | 1 | 0.28mi |
| 4203 Misty Springs Dr San Antonio, TX | 3.0 | 2.5 | 1525 | $1,495 | $0.98 | 23d | 1 | 0.30mi |
| 4918 Ballot Park San Antonio, TX | 4.0 | 2.5 | 2276 | $1,900 | $0.83 | 43d | 1 | 0.32mi |
| 5818 Summer Fest Dr San Antonio, TX | 4.0 | 2.5 | 2278 | $1,795 | $0.79 | 1d | 1 | 0.35mi |
| 4614 Jeffs Farm San Antonio, TX | 4.0 | 3.0 | 2243 | $1,925 | $0.86 | 43d | 1 | 0.41mi |
| 5146 Fountain Hl San Antonio, TX | 4.0 | 2.0 | 1835 | $1,550 | $0.84 | 23d | 1 | 0.41mi |
| 4919 Celtic Cor San Antonio, TX | 4.0 | 2.5 | 2110 | $1,950 | $0.92 | 23d | 1 | 0.43mi |
| 4618 Todds Farm San Antonio, TX | 3.0 | 2.0 | 1752 | $1,750 | $1.00 | 10d | 1 | 0.46mi |
| 4922 Celtic Cor San Antonio, TX | 3.0 | 2.0 | 1610 | $1,550 | $0.96 | 23d | 1 | 0.47mi |
| 6102 Jackies Farm San Antonio, TX | 4.0 | 3.0 | 2321 | $1,895 | $0.82 | 43d | 1 | 0.47mi |
| 4162 Frontier Sun San Antonio, TX | 3.0 | 2.5 | 1246 | $1,400 | $1.12 | 43d | 1 | 0.49mi |
| 5910 Summer Fest Dr San Antonio, TX | 3.0 | 2.5 | 1812 | $2,150 | $1.19 | 43d | 1 | 0.54mi |
| 5990 Catalina Sunrise Dr San Antonio, TX | 4.0 | 3.0 | 1600 | $1,600 | $1.00 | 1d | 1 | 0.69mi |
| 4122 Alaskian Sunrise San Antonio, TX | 3.0 | 2.0 | 1454 | $1,495 | $1.03 | 43d | 1 | 0.72mi |
| 5212 Vinecrest Cir San Antonio, TX | 3.0 | 2.5 | 1421 | $2,100 | $1.48 | 43d | 1 | 0.73mi |
| 3707 Autumn Ln San Antonio, TX | 3.0 | 2.0 | 1340 | $1,500 | $1.12 | 43d | 1 | 0.75mi |
| 5022 Coral Flounder San Antonio, TX | 3.0 | 2.5 | 2138 | $1,800 | $0.84 | 4d | 1 | 0.77mi |
| 5840 Glacier Sun Dr San Antonio, TX | 3.0 | 2.0 | 1344 | $1,749 | $1.30 | 1d | 1 | 0.80mi |
| 5414 Stoneshire San Antonio, TX | 3.0 | 2.0 | 1469 | $2,000 | $1.36 | 10d | 1 | 0.81mi |
| 3669 Candlehead Ln San Antonio, TX | 3.0 | 2.5 | 1294 | $1,700 | $1.31 | 43d | 1 | 0.86mi |
| 6222 Fieldrun San Antonio, TX | 3.0 | 2.5 | 1831 | $2,000 | $1.09 | 23d | 1 | 0.88mi |
| 5019 Starfire St San Antonio, TX | 3.0 | 2.0 | 1532 | $2,100 | $1.37 | 43d | 1 | 0.88mi |
| 6234 Fieldrun San Antonio, TX | 4.0 | 3.0 | 2029 | $1,950 | $0.96 | 12d | 1 | 0.90mi |
| 6234 Fieldrun San Antonio, TX | 4.0 | 3.0 | 2029 | $1,950 | $0.96 | 23d | 1 | 0.90mi |
| 4001 Colonial Sun Dr San Antonio, TX | 3.0 | 2.0 | 1344 | $1,400 | $1.04 | 43d | 1 | 0.91mi |
| 6210 Eddie Way Unit 1 San Antonio, TX | 3.0 | 2.5 | 1225 | $1,350 | $1.10 | 43d | 1 | 0.92mi |
| 6210 Eddie Way Unit 1 San Antonio, TX | 3.0 | 2.5 | 1225 | $1,350 | $1.10 | 2d | 1 | 0.92mi |
| 6214 Eddie Way San Antonio, TX | 3.0 | 2.5 | 1225 | $1,600 | $1.31 | 20d | 1 | 0.92mi |
| 6214 Eddie Way Unit 2 San Antonio, TX | 3.0 | 2.5 | 1225 | $1,600 | $1.31 | 21d | 1 | 0.92mi |
| 6206 Eddie Way Unit 2 San Antonio, TX | 3.0 | 2.5 | 1225 | $1,350 | $1.10 | 23d | 1 | 0.92mi |
| 6206 Eddie Way Unit 2 San Antonio, TX | 3.0 | 2.5 | 1225 | $1,350 | $1.10 | 2d | 1 | 0.92mi |
| 6222 Eddie Way Unit 2 San Antonio, TX | 3.0 | 2.5 | 1225 | $1,350 | $1.10 | 3d | 1 | 0.93mi |
| 5003 Starfire St San Antonio, TX | 3.0 | 2.0 | 1277 | $1,650 | $1.29 | 4d | 1 | 0.93mi |
| 6222 Eddie Way San Antonio, TX | 3.0 | 2.5 | 1225 | $1,350 | $1.10 | 23d | 1 | 0.93mi |
| 6315 Miners Hl San Antonio, TX | 3.0 | 2.0 | 2187 | $1,650 | $0.75 | 43d | 1 | 0.93mi |
| 6230 Eddie Way San Antonio, TX | 3.0 | 2.5 | 1225 | $1,350 | $1.10 | 23d | 1 | 0.93mi |
| 3643 Cameron Spgs San Antonio, TX | 3.0 | 1.5 | 1501 | $1,180 | $0.79 | 2d | 1 | 0.93mi |
Listing history 19 events
-
2026-06-18days on market $150,000 Active 84 DOM
-
2026-06-17days on market $150,000 Active 83 DOM
-
2026-06-16days on market $150,000 Active 82 DOM
-
2026-06-15days on market $150,000 Active 81 DOM
-
2026-06-13days on market $150,000 Active 79 DOM
-
2026-06-09days on market $150,000 Active 75 DOM
-
2026-06-08days on market $150,000 Active 74 DOM
-
2026-06-07days on market $150,000 Active 73 DOM
-
2026-06-04days on market $150,000 Active 70 DOM
-
2026-06-03days on market $150,000 Active 69 DOM
-
2026-06-02days on market $150,000 Active 68 DOM
-
2026-06-01days on market $150,000 Active 67 DOM
-
2026-05-31days on market $150,000 Active 66 DOM
-
2026-03-26$150,000 New 71-char remark
Show marketing remark (71 chars)
This is an Investor Special. It has a nice lot and privacy in the back.
-
2007-05-24soldstatus
-
2007-05-22soldstatus 436-char remark
Show marketing remark (436 chars)
Light and cheerful, this 1942 sf home has 4 bedrooms, 3 full bath with plenty of room for that growing family. Large kitchen, 2 eating areas and a large family room with fireplace. Inside utility rm, Garage has been converted into 4th bedroom, or can be used as a study or play room. Above ground pool is decked all around with 10 x 15 pool room and storage shed. Backyard backs up to greenbelt. Trees galore. Thanks for showing.
-
2007-05-14historical 436-char remark
Show marketing remark (436 chars)
Light and cheerful, this 1942 sf home has 4 bedrooms, 3 full bath with plenty of room for that growing family. Large kitchen, 2 eating areas and a large family room with fireplace. Inside utility rm, Garage has been converted into 4th bedroom, or can be used as a study or play room. Above ground pool is decked all around with 10 x 15 pool room and storage shed. Backyard backs up to greenbelt. Trees galore. Thanks for showing.
-
2007-01-20$109,900 436-char remark
Show marketing remark (436 chars)
Light and cheerful, this 1942 sf home has 4 bedrooms, 3 full bath with plenty of room for that growing family. Large kitchen, 2 eating areas and a large family room with fireplace. Inside utility rm, Garage has been converted into 4th bedroom, or can be used as a study or play room. Above ground pool is decked all around with 10 x 15 pool room and storage shed. Backyard backs up to greenbelt. Trees galore. Thanks for showing.
-
1991-02-01soldstatus
ⓘ Source: listings_history table (triggers on properties + properties_extension) + one-shot
backfill from property_details.listing_events for pre-trigger history.
Tax reassessment forecast TX · Resets to sale price
- Current annual tax
- $5,569 · $464/mo
- Projected year-2 tax
- $5,569 · $464/mo
- Expected delta
- $0/yr ($0/mo · 0.0%)
ⓘ Screening estimate from a state-policy table — verify with the county assessor before closing.
Climate risk First Street
- Flood 1/10 Low FEMA zone X (unshaded) · 0% chance over 30 yrs
- Wildfire 3/10 Moderate
- Heat 8/10 Severe 7 d/yr ≥108°F today · 22 d/yr by 30 yrs out
- Wind 8/10 Severe 80% chance of damaging wind over 30 yrs
- Air quality 2/10 Low 0 unhealthy d/yr today · 1 by 30 yrs out
Nearby sold comps map
Loading sold comps map…
Walkable amenities ~0.75 mi
Loading nearby amenities…
Taxation est. · year 1
- Rental income
- $20,452
- − Mortgage interest
- −$8,402
- − Property taxes
- −$5,569
- − Insurance
- −$750
- − Repairs & maintenance
- −$1,636
- − Management
- −$1,636
- − Depreciation
- −$4,364
- Taxable loss
- −$1,905
- Est. tax savings @ 24.0%
- +$457
- After-tax cash flow
- $856/yr
For passive investors: Depreciation is non-cash, so a rental often shows a tax loss while cash-flowing — sheltering income. Rental losses are passive: they offset passive income freely, and up to $25,000/yr can offset ordinary (W-2) income if you actively participate and your MAGI is under $100k (phasing out to $0 by $150k); unused losses carry forward. On sale, claimed depreciation is recaptured at up to 25%, and gains may owe capital-gains tax (a 1031 exchange can defer both). Figures are a year-1 estimate at your 24.0% rate — not tax advice; consult a CPA.
Schools (NCES district)
- District
- Judson ISD
- NCES district ID
- 4824990
- Math proficiency
- 21% ▼ -21.00%
- Reading proficiency
- 33% ▼ -7.00%
- Median HH income
- $57,542
- Composite
- 24.39/100
- National rank
- #7689
- State rank
- #660 of 826 in TX
Livability — San Antonio
- Score
- 80/100
- State rank
- #31
- US rank
- #1616
Category grades
Schools grade is shown separately in the Schools card above.
Census & demographics
- Census place
- San Antonio, TX
- County
- Bexar County · 1,990,555 people
- City population
- 1,806,925
- Metro
- San Antonio-New Braunfels, TX
- Population (ZIP)
- 38,092
- Household income
- $71,128
- Rent vs Own
- Severe rent burden
- 677.0
Population outlook (Bexar County) Hauer SSP2
- Today (2025)
- 2,336,851 people
- By 2030
- 2,560,728 · +9.6%
- By 2040
- 3,020,569 · +29.3%
- By 2050
- 3,493,522 · +49.5%
- By 2075
- 4,668,459 · +99.8%
- By 2100
- 5,533,242 · +136.8%
Race, ethnicity, and origin ACS 2023
- Neighborhood character
- Diverse neighborhood (Simpson 0.68)
- Race & ethnicity
- Hispanic / Latino 46% Black 27% Two or more races 24% White 20% Asian 2%
- Hispanic origin (detail)
- Mexican 38% Puerto Rican 2% Cuban 2%
- Common ancestry
- Slovak 2% Lithuanian 1% Italian 1%
- Foreign-born
- 14% · Canada, Vietnam
- Languages at home
- 68% English-only · Spanish 28% Vietnamese 1% Tagalog/Filipino 1%
Political lean MEDSL · Bexar
- 2024 margin
- Lean D (+9.8) · D 54.3% · R 44.6% · Other 1.1%
- 2008→2024 swing
- +4.2pp toward D · 2008: 5.6pp · 2024: 9.8pp
- All cycles
- 2024: D+9.8 2020: D+18.2 2016: D+13.5 2012: D+4.6 2008: D+5.6
Not yet ingested
- Civics
- —
Market trends
- HPI YoY
- ▼ -11.42%
- Current HPI
- 249.3834
- Rent YoY
- ▲ 0.75%
- Metro
- San Antonio-New Braunfels, TX
- State GDP YoY
- ▲ 3.95%
- F500 in state
- 110
Industry mix (Fortune 500 HQ in TX)
| Industry | F500 HQs | Revenue |
|---|---|---|
| Energy | 16 | $1,198B |
|
||
| Technology | 5 | $198B |
|
||
| Engineering / Construction | 4 | $72B |
|
||
| Energy Services | 3 | $60B |
|
||
| Utilities | 3 | $41B |
|
||
| Healthcare | 2 | $330B |
|
||
Price history
+36.5% since first listed6 events — show timeline
- 2026-03-26 Listed $150,000 LERA
- 2007-05-24 Sold (Public Records) — Public Records
- 2007-05-22 Sold (MLS) — LERA
- 2007-05-14 Listing Removed — LERA
- 2007-01-20 Listed $109,900 LERA
- 1991-02-01 Sold (Public Records) — Public Records
Property tax history
+14.2%/yrLatest (2025): $5,569 · -1.8% YoY. Source: county tax records.
Cash-flow waterfall
monthlySold comps — $/sqft
last 12 mo · ≤1 miLoading sold comps…