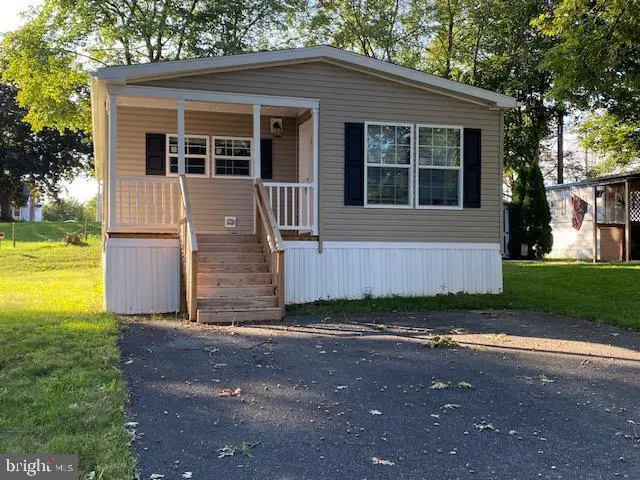
9 Hollar Dr S · Shippensburg, PA
Flood risk 1/10 · Minimal
- FEMA flood zone
- X (unshaded)
- Chance of flooding over 30 yrs
- 0.0%
- Est. flood insurance / yr
- $507 – $1,088
Fire risk 1/10 · Minimal
- Est. fire insurance / yr
- $511 – $949
Heat risk 5/10 · Moderate
- Hot days now (above 100°F)
- 7 days/yr
- Hot days in 30 yrs
- 16 days/yr
Wind risk 2/10 · Minimal
- Chance of severe wind over 30 yrs
- 3.0%
Air-quality risk 2/10 · Minimal
- Unhealthy air days now
- 1 days/yr
- Unhealthy air days in 30 yrs
- 2 days/yr
Risk factors via First Street. Map © Google.
Why this score? — see what drove the C+ grade
The composite is a weighted blend of 9 inputs, each scored 0–100. Each bar is that input's sub-score; the figure is the points it added to the 100-point composite (weight × sub-score).
- Cash flow +26.4/30.0
- DSCR +9.0/10.0
- ARV discount +7.5/15.0
- 1% rule +7.1/10.0
- Condition / age +4.0/5.0
- Schools +3.5/10.0
- Livability +3.5/5.0
- Rent growth +2.5/5.0
- Appreciation +0.0/10.0
$126,900
🖨 Deal sheet 📄 Offer letter ✓ Due diligence
Listing remarks MLS
Make this new 3 Bedroom 2 bath home your own, equipped with new appliances, ceiling fans and recessed lighting. The master bath has a double sink and a walk in showing. It has a utility room for your washer and dryer. Great stater home or to downsize!
Key facts
- Utility room
- Ceiling fans
- Double sink
Tags
Neighborhood map
What this means for you Summary
Snapshot
- This is a 3-bed/2.0-bath single-family listed at $127k. Condition is rated good.
Deal economics
- At list price, monthly cash flow is $332 ($4k/yr) — positive.
- The deal already cash-flows at list — no discount required.
- Meets the 1% rule at list price ($2k rent vs $127k).
- Recommended offer: $112k (12.0% below list) — sets the bar for market timing.
- Cap rate 9.4% vs local median 3.5% in Shippensburg — top-decile yield for the area; either an underpriced asset or a hidden risk that comps aren't pricing in. Stress-test before assuming the spread holds.
Location & tenants
- Location reads 70/100 on livability (#741 in PA) — a middle-class / working-renter tenant base. Strengths: crime A+, cost of living A+, health & safety A; Watch: employment D+, amenities F, commute F.
- Shippensburg Area SD (town): math 31% / reading 52% proficiency, ranked #335 of 539 in PA (top 62%) — families likely to look elsewhere, expect single-tenant / working-renter base with shorter leases.
- Market conditions: 161 active listings in the ZIP; 8 comparable units currently listed for rent nearby; rentals at typical pace (median 24d on market — plan ~3-4 weeks tenant-placement turnaround); 1,052 units permitted in Cumberland County in 2024 (310 in 5+ unit buildings).
Forward outlook
- Local home prices are declining (-3.0%/yr); year-one equity from $877 of loan paydown is wiped out by about $4k of value loss. Plan a longer hold.
- Cumberland County population projected at +17% by 2050 — long-run rental-demand tailwind backs the buy-and-hold thesis.
- At projected returns (-3.0% appreciation + 3.0% rent growth), your $36k cash investment doubles in ~10 years — after that, you're playing with house money.
Negotiation context
- It's been on market 650 days — a 12% lower offer ($112k) is reasonable based on typical stale-listing flexibility.
Risks & watch-outs
- Climate carrying-cost: extreme-heat days projected 7→16/yr by 2055 (HVAC capex compounding) — expect insurance premiums to compound above CPI over the hold.
Questions for the listing agent
- It's been on market 650 days. Have you received any prior offers? Is the seller open to a 12% concession, seller financing, or rate buy-down credit?
- Why hasn't it sold? Are there any deal-killer items the seller is aware of (foundation, flood, title, zoning, code violations)?
- Is there a deadline driving the sale (1031 exchange, divorce, estate, relocation)? That informs how much negotiation room exists.
- What's the average days-on-market for RENTAL listings here right now (not sales)? A rising rental-DOM trend means longer vacancies and softer asking-rent achievability than the comps imply.
- What's the recent tenant-quality profile in this submarket — average credit score on applications, eviction rate, late-payment / NSF rate, and stable-employment percentage? A property-management company in the area should have these aggregated.
- How much new for-sale + rental construction is in the pipeline within 1–3 miles? Heavy new supply typically softens prices + rents 12–24 months out; constrained supply supports both.
Investment metrics
- 1% rule
- 1.21% ✓
- Cap rate
- 9.43%
- Cash-on-cash
- 11.22%
- DSCR
- 1.50
- GRM
- 6.9
CMA / ARV
- ARV (median comp)
- $44,250
- List price
- $126,900
- Delta
- 186.78%
- Verdict
- OVERPRICED
- Comps
- 20 within 1.0 mi
Show comp detail 8 sales within ~0.75 mi
| Address | Dist | Beds/Ba | Sqft | Sold | Price | $/sf | Match |
|---|---|---|---|---|---|---|---|
| 104 Shippensburg Mobile Est | 0.18mi | 3/2.0 | 1,232 (-2%) | 12mo | $55,000 | $45 | 78 |
| 101 Shippensburg Mobile Est | 0.18mi | 3/2.0 | 1,078 (-14%) | 10mo | $47,500 | $44 | 60 |
| 315 Amberleigh Ln | 0.57mi | 3/2.0 | 1,276 (+2%) | 14mo | $335,000 | $263 | 60 |
| 304 Amberleigh Ln | 0.52mi | 3/2.0 | 1,385 (+10%) | 2mo | $379,900 | $274 | 57 |
| 215 Shippensburg Mobile Est | 0.29mi | 3/2.0 | 1,078 (-14%) | 13mo | $52,900 | $49 | 52 |
| 124 Shippensburg Mobile Est | 0.16mi | 3/1.5 | 1,084 (-14%) | 23mo | $24,500 | $23 | 48 |
| 400 Bronwyn Ln | 0.60mi | 3/2.0 | 1,385 (+10%) | 14mo | $355,500 | $257 | 43 |
| 313 Amberleigh Ln | 0.55mi | 3/2.0 | 1,363 (+8%) | 21mo | $354,900 | $260 | 42 |
Match score weights: distance 35% · size 25% · config 20% · recency 20%. Top-matched comps best support the ARV.
Projected returns pro-forma
-3.0% appreciation · 3.0% rent growth · sell at horizon
- IRR
- 0.5%
- Equity multiple
- 1.02×
- Total profit
- $619
- Equity at exit
- $18,921
- IRR
- 10.1%
- Equity multiple
- 1.78×
- Total profit
- $27,878
- Equity at exit
- $10,972
Cash invested: $35,532 (down + closing). Projections, not guarantees.
Landlord ↔ Tenant lean methodology
- Overall (STATE)
- 62 Landlord-Friendly
- State Pennsylvania
- 62 Landlord-Friendly · EVEN
- County
- — inherits STATE
- City
- — inherits STATE
ZIP-level market 17257
- Home prices YoY
- -17.3%
- Active inventory
- 161
- Price-to-rent
- 6.9×
Monthly cashflow live
- Estimated rent
- $1,531 high interval (Pro) →
- Mortgage (P&I)
- −$665
- Tax est. 1.5%
- −$159 /mo · $1,904/yr
- Insurance
- −$53
- HOA
- −$0
- Vacancy / Maint / Mgmt
- −$321
- Net cashflow
- $332
Break-even live
UW: 25.0% down · 7.5% · 30yr · 1.5% tax · 5.0% vac · 8.0% maint · 8.0% mgmt
Financing live
Cash to close
- Down payment
- $31,725
- Closing costs
- $3,807
- Reserves months
- —
- Total cash needed
- —
Loan-product check · same deal, 3 products live
Conventional
25% down · 7.5% · 30yr
- Down + closing
- —
- Monthly P&I
- —
- Monthly cashflow
- —
- DSCR
- —
- Eligible?
- —
Personal DTI + credit; lowest rate.
DSCR
20% down · 8.5% · 30yr
- Down + closing
- —
- Monthly P&I
- —
- Monthly cashflow
- —
- DSCR
- —
- Eligible?
- —
No personal income docs; deal must DSCR.
Hard money
10% down · 12.0% · 12mo
- Down + closing
- —
- Monthly P&I
- —
- Monthly cashflow
- —
- DSCR
- —
- Eligible?
- —
Short-term bridge; refi at stabilization.
Rent comps 8 comps
| Address | Beds | Baths | Sqft | Rent | $/sqft | DOM | Units | Dist |
|---|---|---|---|---|---|---|---|---|
| 100 Deerfield Ln Shippensburg, PA | 3.0 | 2.0 | 1264 | $1,595 | $1.26 | 23d | 1 | 0.34mi |
| 735 E King St Shippensburg, PA | 3.0 | 2.0 | 1664 | $1,850 | $1.11 | 43d | 1 | 0.44mi |
| 14 Kenneth Ave Shippensburg, PA | 1.0–4.0 | 2.0 | 745 | $1,630 | $2.19 | 14d | 1 | 0.84mi |
| 401 E Neff St Shippensburg, PA | 2.0 | 1.0 | 1400 | $1,295 | $0.93 | 21d | 1 | 0.93mi |
| 353 Farmington Dr Shippensburg, PA | 3.0–4.0 | 2.0 | 1675 | $1,900 | $1.13 | 14d | 1 | 1.32mi |
| 9 E Burd St Unit 1 Shippensburg, PA | 3.0 | 1.0 | 1400 | $1,400 | $1.00 | 43d | 1 | 1.36mi |
| 34 N Earl St Unit 2 Shippensburg, PA | 3.0 | 1.0 | 1550 | $1,350 | $0.87 | 23d | 1 | 1.42mi |
| 100 Bard Dr Shippensburg, PA | 2.0–4.0 | 1.0–2.5 | 1116 | $1,522 | $1.36 | 14d | 6 | 1.50mi |
Listing history 16 events
-
2026-06-18days on market $126,900 Active 650 DOM
-
2026-06-17days on market $126,900 Active 649 DOM
-
2026-06-16days on market $126,900 Active 648 DOM
-
2026-06-15days on market $126,900 Active 647 DOM
-
2026-06-14days on market $126,900 Active 645 DOM
-
2026-06-13days on market $126,900 Active 644 DOM
-
2026-06-10days on market $126,900 Active 642 DOM
-
2026-06-09days on market $126,900 Active 641 DOM
-
2026-06-08days on market $126,900 Active 640 DOM
-
2026-06-07days on market $126,900 Active 639 DOM
-
2026-06-03days on market $126,900 Active 635 DOM
-
2026-06-02days on market $126,900 Active 634 DOM
-
2026-06-01days on market $126,900 Active 633 DOM
-
2026-05-31days on market $126,900 Active 632 DOM
-
2026-05-31days on market $126,900 Active 631 DOM
-
2024-09-06$126,900 Active 251-char remark
Show marketing remark (251 chars)
Make this new 3 Bedroom 2 bath home your own, equipped with new appliances, ceiling fans and recessed lighting. The master bath has a double sink and a walk in showing. It has a utility room for your washer and dryer. Great stater home or to downsize!
ⓘ Source: listings_history table (triggers on properties + properties_extension) + one-shot
backfill from property_details.listing_events for pre-trigger history.
Climate risk First Street
- Flood 1/10 Low FEMA zone X (unshaded) · 0% chance over 30 yrs
- Wildfire 1/10 Low
- Heat 5/10 Major 7 d/yr ≥100°F today · 16 d/yr by 30 yrs out
- Wind 2/10 Low 3% chance of damaging wind over 30 yrs
- Air quality 2/10 Low 1 unhealthy d/yr today · 2 by 30 yrs out
Nearby sold comps map
Loading sold comps map…
Walkable amenities ~0.75 mi
Loading nearby amenities…
Taxation est. · year 1
- Rental income
- $18,367
- − Mortgage interest
- −$7,108
- − Property taxes
- −$1,904
- − Insurance
- −$634
- − Repairs & maintenance
- −$1,469
- − Management
- −$1,469
- − Depreciation
- −$3,692
- Taxable income
- $2,091
- Est. tax owed @ 24.0%
- −$502
- After-tax cash flow
- $3,485/yr
For passive investors: Depreciation is non-cash, so a rental often shows a tax loss while cash-flowing — sheltering income. Rental losses are passive: they offset passive income freely, and up to $25,000/yr can offset ordinary (W-2) income if you actively participate and your MAGI is under $100k (phasing out to $0 by $150k); unused losses carry forward. On sale, claimed depreciation is recaptured at up to 25%, and gains may owe capital-gains tax (a 1031 exchange can defer both). Figures are a year-1 estimate at your 24.0% rate — not tax advice; consult a CPA.
Condition & rehab AI · 5 photos
This 3-bedroom, 2-bath home is in good condition with recent updates, making it a great starter home or downsizing option.
Value-add opportunities
- Both Paint interior walls — Fresh paint enhances curb appeal and interior aesthetics
- Both Replace carpet with hardwood — Hardwood flooring is more durable and adds value
- Both Install smart home devices — Smart home devices improve convenience and energy efficiency
Renovation cost estimate screening
Value-add ROI direction
- Both Paint interior walls — Fresh paint enhances curb appeal and interior aesthetics ↑
- Both Replace carpet with hardwood — Hardwood flooring is more durable and adds value ↑
- Both Install smart home devices — Smart home devices improve convenience and energy efficiency ↑
ⓘ Cost ranges are severity-bucket heuristics (US national rule-of-thumb). Get contractor quotes + a written scope before underwriting a rehab budget.
Schools (NCES district)
- District
- Shippensburg Area SD
- NCES district ID
- 4221570
- Math proficiency
- 31% ▼ -21.00%
- Reading proficiency
- 52% ▼ -14.00%
- Median HH income
- $47,585
- Composite
- 35.42/100
- National rank
- #4938
- State rank
- #335 of 539 in PA
Livability — Shippensburg
- Score
- 70/100
- State rank
- #741
- US rank
- #7436
Category grades
Schools grade is shown separately in the Schools card above.
Census & demographics
- County
- Cumberland County · 257,673 people
- City population
- 29,204
- Metro
- Harrisburg-Carlisle, PA
- Population (ZIP)
- 29,204
- Household income
- $71,181
- Rent vs Own
- Severe rent burden
- 855.0
Population outlook (Cumberland County) Hauer SSP2
- Today (2025)
- 267,950 people
- By 2030
- 278,105 · +3.8%
- By 2040
- 296,552 · +10.7%
- By 2050
- 312,937 · +16.8%
- By 2075
- 349,233 · +30.3%
- By 2100
- 361,875 · +35.1%
Race, ethnicity, and origin ACS 2023
- Neighborhood character
- Predominantly White (89%)
- Race & ethnicity
- White 89% Black 4% Two or more races 3% Hispanic / Latino 3% Asian 2%
- Common ancestry
- Romanian 2% Slovak 2% Serbian 1%
- Foreign-born
- 4% · Canada, China
- Languages at home
- 90% English-only · German/W. Germanic 5% Spanish 2% Other Indo-European 1%
Political lean MEDSL · Cumberland
- 2024 margin
- Lean R (+9.4) · D 44.6% · R 54.1% · Other 1.3%
- 2008→2024 swing
- +4.2pp toward D · 2008: -13.6pp · 2024: -9.4pp
- All cycles
- 2024: R+9.4 2020: R+10.6 2016: R+18.6 2012: R+18.5 2008: R+13.6
Not yet ingested
- Civics
- —
Market trends
- HPI YoY
- ▼ -62.12%
- Current HPI
- 297.1586
- Rent YoY
- —
- Metro
- Harrisburg-Carlisle, PA
- State GDP YoY
- ▲ 1.68%
- F500 in state
- 34
Industry mix (Fortune 500 HQ in PA)
| Industry | F500 HQs | Revenue |
|---|---|---|
| Healthcare | 2 | $309B |
|
||
| Insurance | 2 | $27B |
|
||
| Telecommunications / Media | 1 | $124B |
|
||
| Industrial Distribution | 1 | $22B |
|
||
| Financial Services | 1 | $20B |
|
||
| Chemicals / Materials | 1 | $18B |
|
||
Price history
1 event — show timeline
- 2024-09-06 Listed $126,900 BRIGHT MLS
Cash-flow waterfall
monthlySold comps — $/sqft
last 12 mo · ≤1 miLoading sold comps…