3755 Fieldstone Blvd #1208 · Vineyards, FL
Flood risk 1/10 · Minimal
- FEMA flood zone
- X (unshaded)
- Chance of flooding over 30 yrs
- 0.0%
- Est. flood insurance / yr
- $507 – $1,088
Fire risk 2/10 · Minimal
- Est. fire insurance / yr
- $947 – $1,759
Heat risk 10/10 · Severe
- Hot days now (above 107°F)
- 7 days/yr
- Hot days in 30 yrs
- 29 days/yr
Wind risk 10/10 · Severe
- Chance of severe wind over 30 yrs
- 99.0%
Air-quality risk 2/10 · Minimal
- Unhealthy air days now
- 2 days/yr
- Unhealthy air days in 30 yrs
- 2 days/yr
Risk factors via First Street. Map © Google.
Why this score? — see what drove the C grade
The composite is a weighted blend of 9 inputs, each scored 0–100. Each bar is that input's sub-score; the figure is the points it added to the 100-point composite (weight × sub-score).
- Cash flow +19.5/30.0
- ARV discount +7.5/15.0
- 1% rule +7.4/10.0
- DSCR +6.2/10.0
- Appreciation +5.1/10.0
- Schools +5.0/10.0
- Livability +3.2/5.0
- Rent growth +2.7/5.0
- Condition / age +2.5/5.0
$309,000
🖨 Deal sheet 📄 Offer letter ✓ Due diligence
Listing remarks
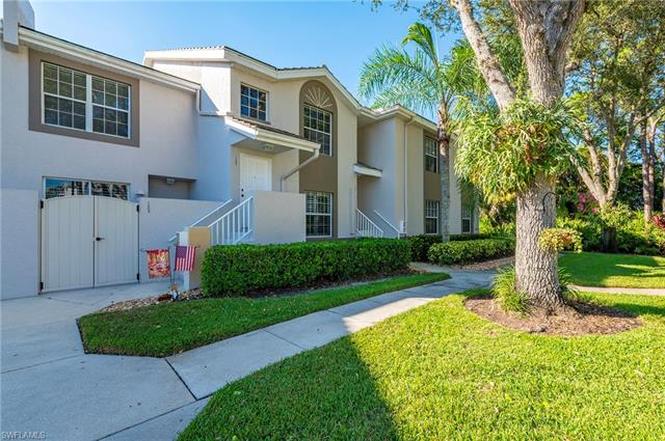
Welcome to this charming second-floor end-unit nestled in the highly sought-after gated community of Wilshire Lakes. Located in Fieldstone Village, this two-bedroom, two-bathroom condominium offers a serene retreat with private western views overlooking a lush, fully landscaped area. Interior highlights include open floor plan tiled and wood flooring throughout for easy maintenance, split-bedroom layout ensures privacy for guests or family. The well-appointed kitchen feature wood flooring, stainless steel appliances, movable center island with granite countertop. Adjacent to the kitchen you will discover the cozy den with a built-in bookcase. Perfect spot to sip your coffee while enjoying a
Key facts
- Open floor plan
- Split-bedroom layout
- $813 HOA
Tags
Property features AI
Finance
- Other: 2 units per floor in building; 8 units in building; 104 units in complex; 2 floors in building
- Financial info: Total annual recurring HOA fees reported; Total one-time fees reported
- HOA & community: Mandatory HOA; Master HOA fee charged quarterly; Condo fee charged quarterly; Professional management; HOA maintenance covers cable, insurance, internet/Wi-Fi, irrigation water, lawn/land maintenance, legal/accounting, exterior pest control, recreation facilities, reserves, security, sewer, street lights, street maintenance, and trash removal; Community amenities include pool, community room, spa/hot tub, exercise room, sidewalks, streetlights, tennis court, and underground utilities; Community is gated and has tennis facilities
Exterior
- Parking: 1 assigned parking space; Guest parking; Detached 1-car carport
- Security: Gated community with guard at gate
- Utilities: Central water; Central sewer; Cable available
- Home design: Residential property; Low-rise building (1–3 stories); Built in 1995; Part of Wilshire Lakes development (Fieldstone Village sub-condo)
- Construction: Concrete block construction
- Exterior features: Stucco exterior; Tile roof; Single-hung and sliding windows; Landscaped area view; Central irrigation; Zero lot line; Corner location; Rear exposure faces west
Interior
- Kitchen: Island; Breakfast bar/dining at living area; Cooktop; Self-cleaning oven; Microwave; Dishwasher; Disposal; Refrigerator/ice maker
- Bedrooms: 2 bedrooms plus den; Split bedroom floor plan
- Flooring: Tile flooring
- Bathrooms: 2 full bathrooms; Master bath with dual sinks and separate tub and shower
- Heating & cooling: Central electric heat; Central electric air conditioning; Ceiling fans
- Interior features: Cable prewire and high-speed internet available; Smoke detectors; Window coverings; Den/Study; Screened lanai/porch; Negotiable furnishings
- Laundry & utility: Washer and dryer in residence; Laundry in residence
Neighborhood map
What this means for you Summary
Snapshot
- This is a 2-bed/2.0-bath condo listed at $309k.
Deal economics
- At list price, monthly cash flow is $353 ($4k/yr) — positive.
- The deal already cash-flows at list — no discount required.
- Meets the 1% rule at list price ($4k rent vs $309k).
- Recommended offer: $272k (12.0% below list) — sets the bar for market timing.
Location & tenants
- Location reads 64/100 on livability (#679 in FL) — a middle-class / working-renter tenant base. Strengths: crime A+, employment A+, housing A-; Watch: health & safety D, amenities F, commute F.
- Collier (suburban): math 60% / reading 56% proficiency, ranked #16 of 73 in FL (top 22%) — acceptable for families but not a draw, mixed tenant base, ~2y average lease.
- Zoned schools: Vineyards Elementary School (math 79% / reading 75%, grade A, #170 of 2,144 statewide, top 9%, 845 students, 27% FRL); Barron Collier High School (math 62% / reading 68%, grade B, #76 of 667 statewide, top 11%, 1,650 students, 26% FRL) — zoned schools average 26% FRL vs 55% district-wide (29 pts lower); this property's tenant base skews higher-income than the district average.
- Zoned-school proficiency averages 71% at this address vs 58% district-wide (+13 pts) — the actual schools serving this property are materially stronger than the Collier average implies; a family-tenant draw the district grade alone would hide.
- Market conditions: Rents flat; 424 active listings in the ZIP; 40 comparable units currently listed for rent nearby; rentals at typical pace (median 23d on market — plan ~3-4 weeks tenant-placement turnaround); solid renter incomes; 3,520 units permitted in Collier County in 2024 (959 in 5+ unit buildings).
- At $3,845/mo this rent would consume 50% of the median local household income ($92k/yr) (locally 1712% of renters already pay >50% of income on rent) — very limited rent-growth headroom before tenants either downsize or default.
Forward outlook
- In year one you build about $3k of equity ($2k loan paydown + $911 appreciation (0.3% local appreciation)).
- Collier County population projected at +30% by 2050 — long-run rental-demand tailwind backs the buy-and-hold thesis.
- By year 9, paydown + projected appreciation supports a ~$33k cash-out refi (75% LTV) — recoverable capital for the next deal without selling this one.
Negotiation context
- It's been on market 164 days — a 12% lower offer ($272k) is reasonable based on typical stale-listing flexibility.
Risks & watch-outs
- Watch-outs: HOA is 21% of rent.
- Climate carrying-cost: severe wind risk, 99% chance of damaging wind over 30y; extreme-heat days projected 7→29/yr by 2055 (HVAC capex compounding) — expect insurance premiums to compound above CPI over the hold.
Questions for the listing agent
- It's been on market 164 days. Have you received any prior offers? Is the seller open to a 12% concession, seller financing, or rate buy-down credit?
- What does the HOA fee cover, when was the last increase, and are there any pending special assessments or reserve-fund shortfalls?
- Any open or pending special assessments — roof, HVAC, plumbing, elevator, façade? What's the per-unit balance and payoff schedule, and is the seller paying it off at close or rolling it to the buyer?
- Why hasn't it sold? Are there any deal-killer items the seller is aware of (foundation, flood, title, zoning, code violations)?
- Is there a deadline driving the sale (1031 exchange, divorce, estate, relocation)? That informs how much negotiation room exists.
- What's the average days-on-market for RENTAL listings here right now (not sales)? A rising rental-DOM trend means longer vacancies and softer asking-rent achievability than the comps imply.
- What's the recent tenant-quality profile in this submarket — average credit score on applications, eviction rate, late-payment / NSF rate, and stable-employment percentage? A property-management company in the area should have these aggregated.
- How much new apartment / multifamily construction is in the pipeline within 1–3 miles? Heavy new supply (>2% of stock underway) typically softens rents 12–24 months out; light construction supports rent growth.
Investment metrics
- 1% rule
- 1.24% ✓
- Cap rate
- 7.67%
- Cash-on-cash
- 4.90%
- DSCR
- 1.22
- GRM
- 6.7
CMA / ARV
No comps found within radius.
Projected returns pro-forma
0.29% appreciation · 0.92% rent growth · sell at horizon
- IRR
- 2.5%
- Equity multiple
- 1.12×
- Total profit
- $10,291
- Equity at exit
- $94,307
- IRR
- 5.9%
- Equity multiple
- 1.62×
- Total profit
- $53,994
- Equity at exit
- $117,087
Cash invested: $86,520 (down + closing). Projections, not guarantees.
Landlord ↔ Tenant lean methodology
- Overall (STATE)
- 87 Strongly Landlord-Friendly
- State Florida
- 87 Strongly Landlord-Friendly · R+3
- County
- — inherits STATE
- City
- — inherits STATE
ZIP-level market 34109
- Home prices YoY
- 0.1%
- Rents YoY
- 0.9%
- Active inventory
- 424
- Price-to-rent
- 6.7×
Monthly cashflow live
- Estimated rent
- $3,845 high interval (Pro) →
- Mortgage (P&I)
- −$1,620
- Tax from tax record
- −$122 /mo · $1,460/yr
- Insurance
- −$129
- HOA
- −$813
- Vacancy / Maint / Mgmt
- −$807
- Net cashflow
- $353
Break-even live
UW: 25.0% down · 7.5% · 30yr · 1.5% tax · 5.0% vac · 8.0% maint · 8.0% mgmt
Financing live
Cash to close
- Down payment
- $77,250
- Closing costs
- $9,270
- Reserves months
- —
- Total cash needed
- —
Loan-product check · same deal, 3 products live
Conventional
25% down · 7.5% · 30yr
- Down + closing
- —
- Monthly P&I
- —
- Monthly cashflow
- —
- DSCR
- —
- Eligible?
- —
Personal DTI + credit; lowest rate.
DSCR
20% down · 8.5% · 30yr
- Down + closing
- —
- Monthly P&I
- —
- Monthly cashflow
- —
- DSCR
- —
- Eligible?
- —
No personal income docs; deal must DSCR.
Hard money
10% down · 12.0% · 12mo
- Down + closing
- —
- Monthly P&I
- —
- Monthly cashflow
- —
- DSCR
- —
- Eligible?
- —
Short-term bridge; refi at stabilization.
Rent comps 40 comps
| Address | Beds | Baths | Sqft | Rent | $/sqft | DOM | Units | Dist |
|---|---|---|---|---|---|---|---|---|
| 3745 Fieldstone Blvd Unit 107 Naples, FL | 2.0 | 2.0 | 1310 | $3,800 | $2.90 | 13d | 1 | 0.02mi |
| 3740 Fieldstone Blvd Unit 104 Naples, FL | 3.0 | 2.0 | 1456 | $2,300 | $1.58 | 13d | 1 | 0.03mi |
| 3775 Fieldstone Blvd Unit 102 Naples, FL | 2.0 | 2.0 | 1281 | $4,700 | $3.67 | 13d | 1 | 0.04mi |
| 3780 Fieldstone Blvd #301 Naples, FL | 3.0 | 2.0 | 1500 | $2,800 | $1.87 | 13d | 1 | 0.05mi |
| 3511 Vanderbilt Beach Rd Naples, FL | 1.0–2.0 | 1.0–2.0 | 968 | $2,976 | $3.07 | 13d | 12 | 0.10mi |
| 3320 Bermuda Isle Cir Naples, FL | 1.0–3.0 | 1.0–2.0 | 1134 | $2,390 | $2.11 | 13d | 45 | 0.38mi |
| 2729 Branch Ln Naples, FL | 3.0 | 2.0 | 1800 | $3,650 | $2.03 | 23d | 1 | 0.60mi |
| 4681 Rio Poco Ct Naples, FL | 3.0 | 2.0 | 1547 | $3,000 | $1.94 | 23d | 1 | 0.62mi |
| 7822 Gardner Dr Unit 6-101 Naples, FL | 2.0 | 2.0 | 1607 | $2,500 | $1.56 | 23d | 1 | 0.65mi |
| 3664 El Segundo Ct Naples, FL | 2.0 | 2.0 | 1680 | $5,500 | $3.27 | 23d | 1 | 0.70mi |
| 3687 El Segundo Ct Naples, FL | 2.0 | 2.0 | 1680 | $5,000 | $2.98 | 23d | 1 | 0.71mi |
| 1156 Oakes Blvd Naples, FL | 3.0 | 2.0 | 1554 | $7,500 | $4.83 | 23d | 1 | 0.80mi |
| 6325 Wilshire Pines Cir #308 Naples, FL | 3.0 | 2.0 | 1577 | $5,000 | $3.17 | 13d | 1 | 0.82mi |
| 7762 Gardner Dr #102 Naples, FL | 2.0 | 2.0 | 1607 | $6,000 | $3.73 | 23d | 1 | 0.86mi |
| 6215 Wilshire Pines Cir #1601 Naples, FL | 3.0 | 2.0 | 1592 | $4,500 | $2.83 | 23d | 1 | 0.87mi |
| 3049 Driftwood Way #3806 Naples, FL | 3.0 | 2.5 | 1818 | $4,700 | $2.59 | 23d | 1 | 0.87mi |
| 3037 Driftwood Way #3505 Naples, FL | 2.0 | 2.0 | 1248 | $2,500 | $2.00 | 23d | 1 | 0.88mi |
| 3062 Driftwood Way #4301 Naples, FL | 3.0 | 2.0 | 1573 | $6,500 | $4.13 | 23d | 1 | 0.90mi |
| 3057 Driftwood Way #4004 Naples, FL | 3.0 | 2.5 | 1818 | $6,400 | $3.52 | 23d | 1 | 0.91mi |
| 3029 Driftwood Way #3303 Naples, FL | 2.0 | 2.0 | 1248 | $4,000 | $3.21 | 23d | 1 | 0.93mi |
| 3025 Driftwood Way #3203 Naples, FL | 2.0 | 2.0 | 1248 | $3,900 | $3.12 | 23d | 1 | 0.93mi |
| 3017 Driftwood Way #3001 Naples, FL | 3.0 | 2.0 | 1385 | $5,000 | $3.61 | 23d | 1 | 0.95mi |
| 2585 Old Groves Rd Unit L203 Naples, FL | 2.0 | 2.0 | 1448 | $5,500 | $3.80 | 13d | 1 | 0.97mi |
| 3009 Driftwood Way #2802 Naples, FL | 3.0 | 2.0 | 1399 | $2,000 | $1.43 | 23d | 1 | 0.97mi |
| 2748 Tiburon Blvd E Unit C202 Naples, FL | 2.0 | 2.5 | 1865 | $15,000 | $8.04 | 13d | 1 | 1.00mi |
| 2748 Tiburon Blvd E Unit C-301 Naples, FL | 1.0 | 2.0 | 1160 | $7,200 | $6.21 | 13d | 1 | 1.00mi |
| 3015 Horizon Ln #2702 Naples, FL | 3.0 | 2.0 | 1399 | $1,790 | $1.28 | 23d | 1 | 1.02mi |
| 2516 Orchid Bay Dr #203 Naples, FL | 2.0 | 2.0 | 1360 | $4,750 | $3.49 | 23d | 1 | 1.05mi |
| 7518 Silver Trumpet Ln Unit Q102 Naples, FL | 2.0 | 2.0 | 1300 | $2,600 | $2.00 | 13d | 1 | 1.05mi |
| 2728 Tiburon Blvd E Naples, FL | 2.0–3.0 | 2.5–3.5 | 2425 | $4,500 | $1.86 | 13d | 3 | 1.06mi |
| 2728 Tiburon Blvd E Unit A-104 Naples, FL | 2.0 | 2.0 | 1465 | $12,500 | $8.53 | 13d | 1 | 1.06mi |
| 2728 Tiburon Blvd E Unit A204 Naples, FL | 2.0 | 2.0 | 1470 | $8,500 | $5.78 | 13d | 1 | 1.06mi |
| 2728 Tiburon Blvd E Unit A-203 Naples, FL | 2.0 | 2.0 | 1465 | $11,000 | $7.51 | 13d | 1 | 1.06mi |
| 2864 Mizzen Way Unit Y106 Naples, FL | 2.0 | 2.0 | 1350 | $5,200 | $3.85 | 13d | 1 | 1.07mi |
| 1710 Tarpon Bay Dr S Unit 4 Naples, FL | 2.0 | 2.0 | 1537 | $2,200 | $1.43 | 13d | 1 | 1.07mi |
| 2885 Citrus Lake Dr Unit N103 Naples, FL | 2.0 | 2.0 | 1249 | $5,250 | $4.20 | 13d | 1 | 1.07mi |
| 3051 Horizon Ln #1803 Naples, FL | 2.0 | 2.0 | 1482 | $5,100 | $3.44 | 23d | 1 | 1.09mi |
| 3048 Horizon Ln #1104 Naples, FL | 3.0 | 2.5 | 1818 | $5,150 | $2.83 | 23d | 1 | 1.09mi |
| 2738 Tiburon Blvd E Unit B405 Naples, FL | 2.0 | 2.5 | 1865 | $12,000 | $6.43 | 13d | 1 | 1.10mi |
| 2835 Mizzen Way Naples, FL | 3.0 | 2.0 | 1641 | $2,900 | $1.77 | 23d | 1 | 1.12mi |
HOA detail condo
- Monthly dues
- $813 · $9,756/yr
- Likely covers
- security
- Assessments
- None detected in remarks — confirm with the listing agent.
Listing history 2 events
-
2026-06-03remarks 699-char remark
-
2026-06-03$309,000 Pending 164 DOM
ⓘ Source: listings_history table (triggers on properties + properties_extension) + one-shot
backfill from property_details.listing_events for pre-trigger history.
Tax reassessment forecast FL · Resets to sale price
- Current annual tax
- $1,460 · $122/mo
- Projected year-2 tax
- $2,565 · $214/mo
- Expected delta
- +$1,104/yr (+$92/mo · 75.6%)
ⓘ Screening estimate from a state-policy table — verify with the county assessor before closing.
Climate risk First Street
- Flood 1/10 Low FEMA zone X (unshaded) · 0% chance over 30 yrs
- Wildfire 2/10 Low
- Heat 10/10 Extreme 7 d/yr ≥107°F today · 29 d/yr by 30 yrs out
- Wind 10/10 Extreme 99% chance of damaging wind over 30 yrs
- Air quality 2/10 Low 2 unhealthy d/yr today · 2 by 30 yrs out
Nearby sold comps map
Loading sold comps map…
Walkable amenities ~0.75 mi
Loading nearby amenities…
Taxation est. · year 1
- Rental income
- $46,136
- − Mortgage interest
- −$17,309
- − Property taxes
- −$1,460
- − Insurance
- −$1,545
- − Repairs & maintenance
- −$3,691
- − Management
- −$3,691
- − HOA
- −$9,756
- − Depreciation
- −$8,989
- Taxable loss
- −$305
- Est. tax savings @ 24.0%
- +$73
- After-tax cash flow
- $4,314/yr
For passive investors: Depreciation is non-cash, so a rental often shows a tax loss while cash-flowing — sheltering income. Rental losses are passive: they offset passive income freely, and up to $25,000/yr can offset ordinary (W-2) income if you actively participate and your MAGI is under $100k (phasing out to $0 by $150k); unused losses carry forward. On sale, claimed depreciation is recaptured at up to 25%, and gains may owe capital-gains tax (a 1031 exchange can defer both). Figures are a year-1 estimate at your 24.0% rate — not tax advice; consult a CPA.
Schools (NCES district)
- District
- Collier
- NCES district ID
- 1200330
- Math proficiency
- 60% ▼ -4.00%
- Reading proficiency
- 56% ▼ -2.00%
- Median HH income
- $58,275
- Composite
- 50.23/100
- National rank
- #1892
- State rank
- #16 of 73 in FL
Livability — Vineyards
- Score
- 64/100
- State rank
- #679
- US rank
- #14101
Category grades
Schools grade is shown separately in the Schools card above.
Census & demographics
- County
- Collier County · 396,295 people
- Metro
- Naples-Marco Island, FL
- Population (ZIP)
- 27,273
- Household income
- $92,259
- Rent vs Own
- Severe rent burden
- 1712.0
Population outlook (Collier County) Hauer SSP2
- Today (2025)
- 420,858 people
- By 2030
- 450,054 · +6.9%
- By 2040
- 502,232 · +19.3%
- By 2050
- 544,932 · +29.5%
- By 2075
- 627,203 · +49.0%
- By 2100
- 659,015 · +56.6%
Race, ethnicity, and origin ACS 2023
- Neighborhood character
- Predominantly White (78%)
- Race & ethnicity
- White 78% Hispanic / Latino 11% Two or more races 9% Black 4% Asian 4%
- Hispanic origin (detail)
- Mexican 1% Puerto Rican 1% Cuban 3%
- Common ancestry
- Romanian 5% Scotch-Irish 3% Lithuanian 2%
- Foreign-born
- 20% · Canada, Jamaica, Vietnam
- Languages at home
- 77% English-only · Spanish 10% Other Indo-European 5% Russian/Polish/Slavic 3%
Political lean MEDSL · Collier
- 2024 margin
- Solid R (+33.1) · D 33.1% · R 66.2%
- 2008→2024 swing
- -10.6pp toward R · 2008: -22.5pp · 2024: -33.1pp
- All cycles
- 2024: R+33.1 2020: R+24.7 2016: R+26.0 2012: R+30.1 2008: R+22.5
Not yet ingested
- Civics
- —
Market trends
- HPI YoY
- ▲ 0.29%
- Current HPI
- 279.357
- Rent YoY
- ▲ 0.92%
- Metro
- Naples-Marco Island, FL
- State GDP YoY
- ▲ 3.28%
- F500 in state
- 36
Industry mix (Fortune 500 HQ in FL)
| Industry | F500 HQs | Revenue |
|---|---|---|
| Industrial Technology | 2 | $29B |
|
||
| Insurance | 2 | $17B |
|
||
| Retail | 1 | $60B |
|
||
| Technology Distribution | 1 | $58B |
|
||
| Homebuilding | 1 | $35B |
|
||
| Technology Manufacturing | 1 | $35B |
|
||
Price history
+70.6% since first listed10 events — show timeline
- 2026-06-03 Sold (MLS) $302,000 NAPLESMLS
- 2026-04-27 Pending — NAPLESMLS
- 2026-04-19 Pending — NAPLESMLS
- 2026-04-13 Price Changed $309,000 NAPLESMLS
- 2026-02-11 Price Changed $319,000 NAPLESMLS
- 2026-01-11 Price Changed $335,000 NAPLESMLS
- 2025-11-06 Listed $350,000 NAPLESMLS
- 2013-09-19 Sold (Public Records) $151,000 Public Records
- 2005-04-25 Sold (Public Records) $299,900 Public Records
- 2004-04-12 Sold (Public Records) $177,000 Public Records
Property tax history
+1.0%/yrLatest (2025): $1,460 · +2.6% YoY. Source: county tax records.
Cash-flow waterfall
monthlySold comps — $/sqft
last 12 mo · ≤1 miLoading sold comps…