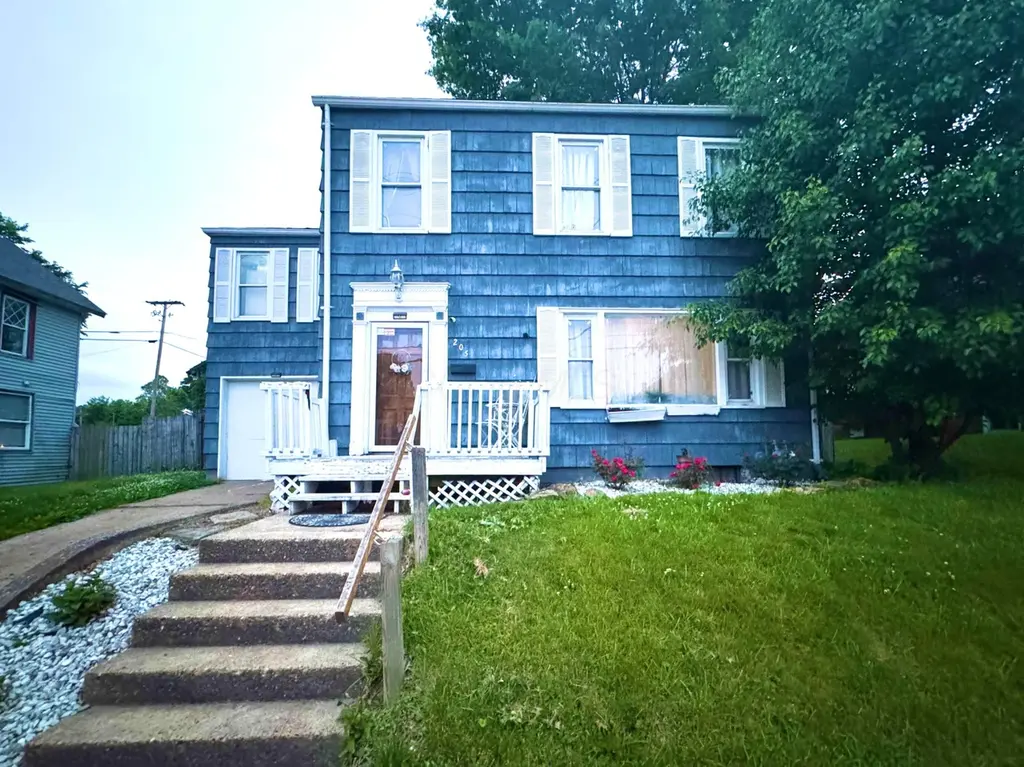
205 N Main St · Roseville, OH
Flood risk 1/10 · Minimal
- FEMA flood zone
- X (unshaded)
- Chance of flooding over 30 yrs
- 0.0%
- Est. flood insurance / yr
- $473 – $860
Fire risk 3/10 · Minor
- Est. fire insurance / yr
- $713 – $1,323
Heat risk 4/10 · Minor
- Hot days now (above 98°F)
- 7 days/yr
- Hot days in 30 yrs
- 19 days/yr
Wind risk 2/10 · Minimal
- Chance of severe wind over 30 yrs
- 0.0%
Air-quality risk 2/10 · Minimal
- Unhealthy air days now
- 0 days/yr
- Unhealthy air days in 30 yrs
- 1 days/yr
Risk factors via First Street. Map © Google.
Why this score? — see what drove the C- grade
The composite is a weighted blend of 9 inputs, each scored 0–100. Each bar is that input's sub-score; the figure is the points it added to the 100-point composite (weight × sub-score).
- Cash flow +18.5/30.0
- ARV discount +7.5/15.0
- Appreciation +6.6/10.0
- DSCR +5.8/10.0
- Schools +4.4/10.0
- 1% rule +4.0/10.0
- Livability +3.2/5.0
- Rent growth +2.5/5.0
- Condition / age +2.5/5.0
$145,000
🖨 Deal sheet (PDF) 📄 Offer letter ✓ Due diligence
Listing remarks MLS
Large 4 bedroom home with an excellent opportunity for those needing a larger home, or looking to invest in a rental property. Affordable and located on a nice lot with detached garage. Wont last long- great price!
Key facts
- 0.36 acre lot
- Garage
- Built 1901
Property features AI
Exterior
- Parking: Attached garage (1 space)
- Utilities: Public water; Public sewer
- Home design: Single family residence; Two levels; Built in 1901; No shared/common walls
- Construction: Block and poured foundation
- Exterior features: Patio; Deck; Fenced yard
Interior
- Flooring: Wood; Laminate; Carpet; Ceramic/Porcelain; Vinyl
- Bathrooms: 3 full bathrooms
- Heating & cooling: Forced air heating; Central air conditioning
- Interior features: Partial basement; One fireplace; Insulated windows
Neighborhood map
What this means for you Summary
Snapshot
- This is a 4-bed/3.0-bath single-family listed at $145k.
Deal economics
- At list price, monthly cash flow is $139 ($2k/yr) — positive.
- The deal already cash-flows at list — no discount required.
- To meet the 1% rule (rent ≥ 1% of price), the offer needs to be $131k (10.0% below list).
- Recommended offer: $131k (10.0% below list) — sets the bar for 1% rule.
Location & tenants
- Location reads 63/100 on livability (#816 in OH) — a middle-class / working-renter tenant base. Strengths: cost of living A+, housing A+, crime A; Watch: health & safety C-, schools D, employment D.
- Franklin Local (rural): math 49% / reading 54% proficiency, ranked #428 of 656 in OH (top 65%) — acceptable for families but not a draw, mixed tenant base, ~2y average lease.
- Market conditions: 20 active listings in the ZIP; 140 units permitted in Muskingum County in 2024 (100 in 5+ unit buildings).
Forward outlook
- In year one you build about $6k of equity ($1k loan paydown + $5k appreciation (3.1% local appreciation)).
- Muskingum County population projected at -10% by 2050 — secular population decline; favor cash flow + early exit over multi-decade hold.
- At projected returns (3.1% appreciation + 3.0% rent growth), your $41k cash investment doubles in ~5 years — after that, you're playing with house money.
- By year 7, paydown + projected appreciation supports a ~$35k cash-out refi (75% LTV) — recoverable capital for the next deal without selling this one.
Negotiation context
- It's been on market 23 days — a 2% lower offer ($143k) is reasonable based on typical stale-listing flexibility.
- 4 sale attempts since 16y ago; this cycle's ask is 81% above the opening price — seller raised mid-cycle; expect resistance to lowballs.
- Current owner paid $80k; list at $145k implies a 81% gain — meaningful room to come down on a strong offer.
Risks & watch-outs
- Watch-outs: built in 1901 — expect roof / HVAC / electrical / plumbing capex.
Questions for the listing agent
- Built in 1901 — when were the roof, HVAC, electrical panel, plumbing, and water heater last replaced?
- Is there a deadline driving the sale (1031 exchange, divorce, estate, relocation)? That informs how much negotiation room exists.
- Schools are D-rated, which usually means shorter tenancies and higher turnover. Who's the typical renter profile here, and what's been the actual vacancy rate?
- What's the average days-on-market for RENTAL listings here right now (not sales)? A rising rental-DOM trend means longer vacancies and softer asking-rent achievability than the comps imply.
- What's the recent tenant-quality profile in this submarket — average credit score on applications, eviction rate, late-payment / NSF rate, and stable-employment percentage? A property-management company in the area should have these aggregated.
- How much new for-sale + rental construction is in the pipeline within 1–3 miles? Heavy new supply typically softens prices + rents 12–24 months out; constrained supply supports both.
Investment metrics
- 1% rule
- 0.90% ✗
- Cap rate
- 7.44%
- Cash-on-cash
- 4.10%
- DSCR
- 1.18
- GRM
- 9.3
CMA / ARV
No comps found within radius.
Projected returns pro-forma
3.12% appreciation · 3.0% rent growth · sell at horizon
- IRR
- 11.6%
- Equity multiple
- 1.67×
- Total profit
- $27,206
- Equity at exit
- $66,205
- IRR
- 13.7%
- Equity multiple
- 3.05×
- Total profit
- $83,250
- Equity at exit
- $102,820
Cash invested: $40,600 (down + closing). Projections, not guarantees.
Landlord ↔ Tenant lean methodology
- Overall (STATE)
- 73 Landlord-Friendly
- State Ohio
- 73 Landlord-Friendly · R+6
- County
- — inherits STATE
- City
- — inherits STATE
ZIP-level market 43777
- Home prices YoY
- 1.2%
- Active inventory
- 20
- Price-to-rent
- 9.3×
Monthly cashflow live
- Estimated rent
- $1,306 medium interval (Pro) →
- Mortgage (P&I)
- −$760
- Tax from tax record
- −$72 /mo · $861/yr
- Insurance
- −$60
- HOA
- −$0
- Vacancy / Maint / Mgmt
- −$274
- Net cashflow
- $139
Break-even live
Sensitivity live
| Price | -10% $221 | -5% $180 | +0% $139 | +5% $98 | +10% $57 |
|---|---|---|---|---|---|
| Rent | -10% $36 | -5% $87 | +0% $139 | +5% $190 | +10% $242 |
| Rate | -1.0pp $212 | -0.5pp $176 | base $139 | +0.5pp $101 | +1.0pp $63 |
UW: 25.0% down · 7.5% · 30yr · 1.5% tax · 5.0% vac · 8.0% maint · 8.0% mgmt
Financing live
Cash to close
- Down payment
- $36,250
- Closing costs
- $4,350
- Reserves months
- —
- Total cash needed
- —
Loan-product check · same deal, 3 products live
Conventional
25% down · 7.5% · 30yr
- Down + closing
- —
- Monthly P&I
- —
- Monthly cashflow
- —
- DSCR
- —
- Eligible?
- —
Personal DTI + credit; lowest rate.
DSCR
20% down · 8.5% · 30yr
- Down + closing
- —
- Monthly P&I
- —
- Monthly cashflow
- —
- DSCR
- —
- Eligible?
- —
No personal income docs; deal must DSCR.
Hard money
10% down · 12.0% · 12mo
- Down + closing
- —
- Monthly P&I
- —
- Monthly cashflow
- —
- DSCR
- —
- Eligible?
- —
Short-term bridge; refi at stabilization.
Listing history 29 events
-
2026-06-19days on market $145,000 Active 23 DOM
-
2026-06-18days on market $145,000 Active 22 DOM
-
2026-06-17days on market $145,000 Active 21 DOM
-
2026-06-16days on market $145,000 Active 20 DOM
-
2026-06-15days on market $145,000 Active 19 DOM
-
2026-06-14days on market $145,000 Active 17 DOM
-
2026-06-12days on market $145,000 Active 16 DOM
-
2026-06-09days on market $145,000 Active 13 DOM
-
2026-06-08days on market $145,000 Active 12 DOM
-
2026-06-07days on market $145,000 Active 11 DOM
-
2026-06-05days on market $145,000 Active 8 DOM
-
2026-06-02days on market $145,000 Active 6 DOM
-
2026-06-01days on market $145,000 Active 5 DOM
-
2026-05-31days on market $145,000 Active 4 DOM
-
2026-05-30days on market $145,000 Active 3 DOM
-
2026-05-22historical $145,000
-
2021-01-28soldstatus $80,000
-
2021-01-21soldstatus $80,000
-
2020-09-27$80,000
-
2015-10-19soldstatus $37,100
-
2015-10-16soldstatus $37,000 214-char remark
Show marketing remark (214 chars)
Large 4 bedroom home with an excellent opportunity for those needing a larger home, or looking to invest in a rental property. Affordable and located on a nice lot with detached garage. Wont last long- great price!
-
2015-10-16soldstatus $37,000
Show marketing remark (214 chars)
Large 4 bedroom home with an excellent opportunity for those needing a larger home, or looking to invest in a rental property. Affordable and located on a nice lot with detached garage. Wont last long- great price!
-
2015-08-31$37,500 214-char remark
Show marketing remark (214 chars)
Large 4 bedroom home with an excellent opportunity for those needing a larger home, or looking to invest in a rental property. Affordable and located on a nice lot with detached garage. Wont last long- great price!
-
2015-08-25$37,500
-
2010-11-24soldstatus $29,000
-
2010-09-11$35,000
-
2004-12-03soldstatus $75,000
-
1995-12-06soldstatus $45,000
-
1990-08-01soldstatus $34,900
ⓘ Source: listings_history table (triggers on properties + properties_extension) + one-shot
backfill from property_details.listing_events for pre-trigger history.
Tax reassessment forecast OH · Partial reset (capped growth)
- Current annual tax
- $861 · $72/mo
- Projected year-2 tax
- $1,562 · $130/mo
- Expected delta
- +$700/yr (+$58/mo · 81.3%)
ⓘ Screening estimate from a state-policy table — verify with the county assessor before closing.
Climate risk First Street
- Flood 1/10 Low FEMA zone X (unshaded) · 0% chance over 30 yrs
- Wildfire 3/10 Moderate
- Heat 4/10 Moderate 7 d/yr ≥98°F today · 19 d/yr by 30 yrs out
- Wind 2/10 Low 0% chance of damaging wind over 30 yrs
- Air quality 2/10 Low 0 unhealthy d/yr today · 1 by 30 yrs out
Nearby sold comps map
Loading sold comps map…
Walkable amenities ~0.75 mi
Loading nearby amenities…
Taxation est. · year 1
- Rental income
- $15,666
- − Mortgage interest
- −$8,122
- − Property taxes
- −$861
- − Insurance
- −$725
- − Repairs & maintenance
- −$1,253
- − Management
- −$1,253
- − Depreciation
- −$4,218
- Taxable loss
- −$767
- Est. tax savings @ 24.0%
- +$184
- After-tax cash flow
- $1,849/yr
For passive investors: Depreciation is non-cash, so a rental often shows a tax loss while cash-flowing — sheltering income. Rental losses are passive: they offset passive income freely, and up to $25,000/yr can offset ordinary (W-2) income if you actively participate and your MAGI is under $100k (phasing out to $0 by $150k); unused losses carry forward. On sale, claimed depreciation is recaptured at up to 25%, and gains may owe capital-gains tax (a 1031 exchange can defer both). Figures are a year-1 estimate at your 24.0% rate — not tax advice; consult a CPA.
Schools (NCES district)
- District
- Franklin Local
- NCES district ID
- 3904884
- Math proficiency
- 49% ▼ -14.00%
- Reading proficiency
- 54% ▼ -10.00%
- Median HH income
- $45,134
- Composite
- 43.55/100
- National rank
- #2982
- State rank
- #428 of 656 in OH
Livability — Roseville
- Score
- 63/100
- State rank
- #816
- US rank
- #15101
Category grades
Schools grade is shown separately in the Schools card above.
Census & demographics
- Census place
- Roseville, OH
- County
- Muskingum · 86,793 people
- Population (ZIP)
- 4,435
- Household income
- $52,886
- Rent vs Own
- Severe rent burden
- 15.0
Population outlook (Muskingum County) Hauer SSP2
- Today (2025)
- 85,625 people
- By 2030
- 84,592 · -1.2%
- By 2040
- 81,288 · -5.1%
- By 2050
- 76,751 · -10.4%
- By 2075
- 64,143 · -25.1%
- By 2100
- 47,598 · -44.4%
Race, ethnicity, and origin ACS 2023
- Neighborhood character
- Predominantly White (99%)
- Race & ethnicity
- White 99%
- Common ancestry
- Slovak 3% Lithuanian 1% Iranian 1%
- Foreign-born
- 1% · Canada
Political lean MEDSL · Muskingum
- 2024 margin
- Solid R (+43.9) · D 27.6% · R 71.6%
- 2008→2024 swing
- -36.7pp toward R · 2008: -7.2pp · 2024: -43.9pp
- All cycles
- 2024: R+43.9 2020: R+39.3 2016: R+35.0 2012: R+7.0 2008: R+7.2
Not yet ingested
- Civics
- —
Market trends
- HPI YoY
- ▲ 3.12%
- Current HPI
- 267.0752
- Rent YoY
- —
- Metro
- —
- State GDP YoY
- ▲ 1.98%
- F500 in state
- 48
Industry mix (Fortune 500 HQ in OH)
| Industry | F500 HQs | Revenue |
|---|---|---|
| Insurance | 3 | $145B |
|
||
| Industrial Machinery | 3 | $49B |
|
||
| Financial Services | 3 | $24B |
|
||
| Consumer Goods | 2 | $93B |
|
||
| Aerospace / Defense | 2 | $47B |
|
||
| Utilities | 2 | $33B |
|
||
Price history
+315.5% since first listed14 events — show timeline
- 2026-05-22 Coming Soon $145,000 CBRMLS
- 2021-01-28 Sold (Public Records) $80,000 Public Records
- 2021-01-21 Sold (MLS) $80,000 MLSNOW
- 2020-09-27 Listed $80,000 MLSNOW
- 2015-10-19 Sold (Public Records) $37,100 Public Records
- 2015-10-16 Sold (MLS) $37,000 CBRMLS
- 2015-10-16 Sold (MLS) $37,000 MLSNOW
- 2015-08-31 Listed $37,500 MLSNOW
- 2015-08-25 Listed $37,500 CBRMLS
- 2010-11-24 Sold (MLS) $29,000 MLSNOW
- 2010-09-11 Listed $35,000 MLSNOW
- 2004-12-03 Sold (Public Records) $75,000 Public Records
- 1995-12-06 Sold (Public Records) $45,000 Public Records
- 1990-08-01 Sold (Public Records) $34,900 Public Records
Property tax history
+1.5%/yrLatest (2025): $861 · +0.3% YoY. Source: county tax records.
Cash-flow waterfall
monthlySold comps — $/sqft
last 12 mo · ≤1 miLoading sold comps…