1104 North Pkwy Unit 29 · Jackson, TN
Flood risk No data
- FEMA flood zone
- —
- Chance of flooding over 30 yrs
- —
- Est. flood insurance / yr
- —
Fire risk No data
- Est. fire insurance / yr
- —
Heat risk No data
- Hot days now (above threshold)
- —
- Hot days in 30 yrs
- —
Wind risk No data
- Chance of severe wind over 30 yrs
- —
Air-quality risk No data
- Unhealthy air days now
- —
- Unhealthy air days in 30 yrs
- —
Risk factors via First Street. Map © Google.
Why this score? — see what drove the F grade
The composite is a weighted blend of 9 inputs, each scored 0–100. Each bar is that input's sub-score; the figure is the points it added to the 100-point composite (weight × sub-score).
- Cash flow +8.1/30.0
- ARV discount +7.5/15.0
- 1% rule +3.6/10.0
- Livability +3.1/5.0
- Rent growth +2.9/5.0
- Condition / age +2.5/5.0
- DSCR +2.1/10.0
- Schools +1.2/10.0
- Appreciation +0.0/10.0
$179,900
🖨 Deal sheet (PDF) 📄 Offer letter ✓ Due diligence
Listing remarks MLS
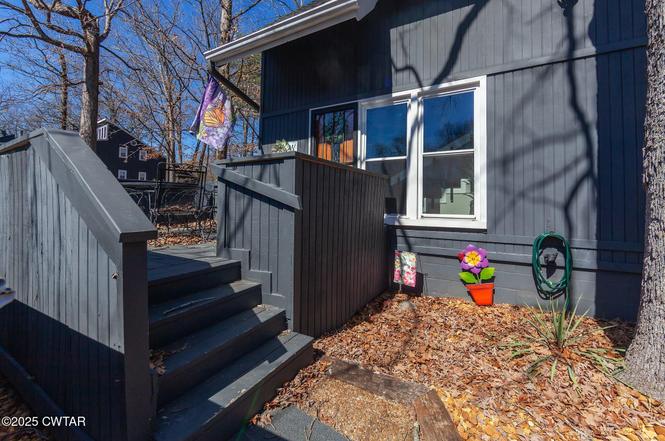
Timberlake Estates 3 bed 2.5 bath condo conveniently located minutes from the hospital, shopping, and I40. This community has a swimming pool, tennis court, covered parking, and offers a low maintenance lifestyle. Fresh paint, carpet, and updated fixtures! Nice sunroom and deck. Call to see this condo today!
Key facts
- 2 parking spots
- Community pool
- Built 1978
Property features AI
Finance
- HOA & community: Community pool; Community tennis courts; Located in Timber Lake Estates
Exterior
- Parking: 2 total parking spaces; Carport with 2 spaces
- Security: Closed-circuit cameras; Fire alarm
- Utilities: Public water; Public sewer; 220-volt electric service; Natural gas available and connected
- Home design: Residential condominium; Two-story
- Construction: Board & batten siding; Combination foundation
- Exterior features: Rain gutters; Deck; Tennis court(s); Wood fencing; Storage structure
Interior
- Kitchen: Dishwasher; Refrigerator; Granite counters; Kitchen island; Pantry; Eat-in kitchen
- Bedrooms: Total rooms: 9
- Flooring: Carpet; Ceramic tile
- Bathrooms: 2 full bathrooms; 1 half bathroom
- Heating & cooling: Central heating (natural gas); Central air; Electric cooling; Ceiling fans
- Interior features: Beamed ceilings; Ceiling fans; Eat-in kitchen; Entrance foyer; Granite counters; High ceilings; Kitchen island; Open floorplan; Pantry; Vaulted ceilings; Walk-in closets; Fireplace in the great room
- Laundry & utility: Washer hookup; Electric dryer hookup; Laundry located on upper level
Neighborhood map
What this means for you Summary
Snapshot
- This is a 3-bed/3.0-bath condo listed at $180k.
Deal economics
- At list price, monthly cash flow is $-176 ($-2k/yr) — negative.
- The deal already cash-flows at list — no discount required.
- To meet the 1% rule (rent ≥ 1% of price), the offer needs to be $155k (13.8% below list).
- Recommended offer: $155k (13.8% below list) — sets the bar for 1% rule.
- Cap rate 5.1% vs local median 3.5% in Jackson — top-decile yield for the area; either an underpriced asset or a hidden risk that comps aren't pricing in. Stress-test before assuming the spread holds.
Location & tenants
- Location reads 62/100 on livability (#216 in TN) — a middle-class / working-renter tenant base. Strengths: cost of living A+, housing A+; Watch: health & safety C-, crime F, amenities F.
- Madison County (urban): math 10% / reading 17% proficiency, ranked #131 of 139 in TN (top 94%) — low school quality limits family demand, transient renter base, plan for 1-2y turnover; 68% free/reduced lunch — lower-income household profile, screen leases tightly.
- Zoned schools: Andrew Jackson Elementary School (math 2% / reading 8%, grade F, #896 of 952 statewide, top 96%, 475 students, 0% FRL); North Parkway Middle School (math 4% / reading 6%, grade F, #295 of 333 statewide, top 91%, 340 students, 0% FRL); North Side High School (math 3% / reading 22%, grade F, #257 of 332 statewide, top 78%, 886 students, 0% FRL) — zoned schools average 0% FRL vs 68% district-wide (68 pts lower); this property's tenant base skews higher-income than the district average.
- Market conditions: Rents rising (+1.6%/yr); 512 active listings in the ZIP; 247 units permitted in Madison County in 2024 (0 in 5+ unit buildings).
Forward outlook
- Local home prices are declining (-3.0%/yr); year-one equity from $1k of loan paydown is wiped out by about $5k of value loss. Plan a longer hold.
- Madison County population projected at -12% by 2050 — secular population decline; favor cash flow + early exit over multi-decade hold.
Negotiation context
- Only 2 days on market — expect competitive offers; lowballing is unlikely to land.
- 3 sale attempts since 9y ago with the ask held roughly flat each time — persistent listings suggest the price (not the market) is what's stuck; bring a comps-based counter.
Questions for the listing agent
- What do current leases actually rent for vs. the listed asking? Can we see a recent rent roll and the last 12 months of T-12 income?
- Built in 1978 — when were the roof, HVAC, electrical panel, plumbing, and water heater last replaced?
- What does the HOA fee cover, when was the last increase, and are there any pending special assessments or reserve-fund shortfalls?
- Any open or pending special assessments — roof, HVAC, plumbing, elevator, façade? What's the per-unit balance and payoff schedule, and is the seller paying it off at close or rolling it to the buyer?
- Is there a deadline driving the sale (1031 exchange, divorce, estate, relocation)? That informs how much negotiation room exists.
- Schools are F-rated, which usually means shorter tenancies and higher turnover. Who's the typical renter profile here, and what's been the actual vacancy rate?
- Crime grade is F in this area — have there been break-ins, vandalism, or insurance claims at this property in the last 3 years? What carrier currently insures it and at what premium?
- The area grade is low — what's the realistic commute time and amenity access for the typical tenant pool here? Any planned neighborhood developments (good or bad) we should know about?
- What's the average days-on-market for RENTAL listings here right now (not sales)? A rising rental-DOM trend means longer vacancies and softer asking-rent achievability than the comps imply.
- What's the recent tenant-quality profile in this submarket — average credit score on applications, eviction rate, late-payment / NSF rate, and stable-employment percentage? A property-management company in the area should have these aggregated.
- How much new apartment / multifamily construction is in the pipeline within 1–3 miles? Heavy new supply (>2% of stock underway) typically softens rents 12–24 months out; light construction supports rent growth.
Investment metrics
- 1% rule
- 0.86% ✗
- Cap rate
- 5.12%
- Cash-on-cash
- -4.19%
- DSCR
- 0.81
- GRM
- 9.7
CMA / ARV
No comps found within radius.
Projected returns pro-forma
-3.0% appreciation · 1.58% rent growth · sell at horizon
- IRR
- -25.1%
- Equity multiple
- 0.16×
- Total profit
- $-42,428
- Equity at exit
- $26,824
- IRR
- -26.5%
- Equity multiple
- -0.18×
- Total profit
- $-59,606
- Equity at exit
- $15,554
Cash invested: $50,372 (down + closing). Projections, not guarantees.
Landlord ↔ Tenant lean methodology
- Overall (STATE)
- 87 Strongly Landlord-Friendly
- State Tennessee
- 87 Strongly Landlord-Friendly · R+13
- County
- — inherits STATE
- City
- — inherits STATE
ZIP-level market 38305
- Rents YoY
- 1.6%
- Active inventory
- 512
- Price-to-rent
- 9.7×
Monthly cashflow live
- Estimated rent
- $1,551 medium interval (Pro) →
- Mortgage (P&I)
- −$943
- Tax from tax record
- −$88 /mo · $1,056/yr
- Insurance
- −$75
- HOA est. from 3 same-building comps
- −$295
- Vacancy / Maint / Mgmt
- −$326
- Net cashflow
- $-176
Break-even live
Sensitivity live
| Price | -10% $-74 | -5% $-125 | +0% $-176 | +5% $-227 | +10% $-278 |
|---|---|---|---|---|---|
| Rent | -10% $-299 | -5% $-237 | +0% $-176 | +5% $-115 | +10% $-53 |
| Rate | -1.0pp $-85 | -0.5pp $-130 | base $-176 | +0.5pp $-223 | +1.0pp $-270 |
UW: 25.0% down · 7.5% · 30yr · 1.5% tax · 5.0% vac · 8.0% maint · 8.0% mgmt
Financing live
Cash to close
- Down payment
- $44,975
- Closing costs
- $5,397
- Reserves months
- —
- Total cash needed
- —
Loan-product check · same deal, 3 products live
Conventional
25% down · 7.5% · 30yr
- Down + closing
- —
- Monthly P&I
- —
- Monthly cashflow
- —
- DSCR
- —
- Eligible?
- —
Personal DTI + credit; lowest rate.
DSCR
20% down · 8.5% · 30yr
- Down + closing
- —
- Monthly P&I
- —
- Monthly cashflow
- —
- DSCR
- —
- Eligible?
- —
No personal income docs; deal must DSCR.
Hard money
10% down · 12.0% · 12mo
- Down + closing
- —
- Monthly P&I
- —
- Monthly cashflow
- —
- DSCR
- —
- Eligible?
- —
Short-term bridge; refi at stabilization.
HOA detail condo
- Monthly dues
- $0 · $0/yr
- Likely covers
- pool
- Assessments
- None detected in remarks — confirm with the listing agent.
Listing history 4 events
-
2026-06-17status $179,900 Pending 2 DOM
-
2026-06-17days on market $179,900 Active 2 DOM
-
2026-06-15remarks 232-char remark
-
2026-06-15$179,900 Active 1 DOM
ⓘ Source: listings_history table (triggers on properties + properties_extension) + one-shot
backfill from property_details.listing_events for pre-trigger history.
Tax reassessment forecast TN · Resets to sale price
- Current annual tax
- $1,056 · $88/mo
- Projected year-2 tax
- $1,277 · $106/mo
- Expected delta
- +$221/yr (+$18/mo · 21.0%)
ⓘ Screening estimate from a state-policy table — verify with the county assessor before closing.
Nearby sold comps map
Loading sold comps map…
Walkable amenities ~0.75 mi
Loading nearby amenities…
Taxation est. · year 1
- Rental income
- $18,613
- − Mortgage interest
- −$10,077
- − Property taxes
- −$1,056
- − Insurance
- −$900
- − Repairs & maintenance
- −$1,489
- − Management
- −$1,489
- − HOA
- −$3,540
- − Depreciation
- −$5,233
- Taxable loss
- −$5,171
- Est. tax savings @ 24.0%
- +$1,241
- After-tax cash flow
- $-871/yr
For passive investors: Depreciation is non-cash, so a rental often shows a tax loss while cash-flowing — sheltering income. Rental losses are passive: they offset passive income freely, and up to $25,000/yr can offset ordinary (W-2) income if you actively participate and your MAGI is under $100k (phasing out to $0 by $150k); unused losses carry forward. On sale, claimed depreciation is recaptured at up to 25%, and gains may owe capital-gains tax (a 1031 exchange can defer both). Figures are a year-1 estimate at your 24.0% rate — not tax advice; consult a CPA.
Schools (NCES district)
- District
- Madison County
- NCES district ID
- 4702580
- Math proficiency
- 10% ▼ -11.00%
- Reading proficiency
- 17% ▼ -4.00%
- Median HH income
- $42,015
- Composite
- 11.74/100
- National rank
- #9687
- State rank
- #131 of 139 in TN
Livability — Jackson
- Score
- 62/100
- State rank
- #216
- US rank
- #16488
Category grades
Schools grade is shown separately in the Schools card above.
Census & demographics
- Census place
- Jackson, TN
- County
- Madison County · 87,024 people
- City population
- 87,024
- Metro
- Jackson, TN
- Population (ZIP)
- 53,488
- Household income
- $68,977
- Rent vs Own
- Severe rent burden
- 2228.0
Population outlook (Madison County) Hauer SSP2
- Today (2025)
- 95,952 people
- By 2030
- 94,264 · -1.8%
- By 2040
- 89,607 · -6.6%
- By 2050
- 84,133 · -12.3%
- By 2075
- 72,215 · -24.7%
- By 2100
- 62,062 · -35.3%
Race, ethnicity, and origin ACS 2023
- Neighborhood character
- Diverse neighborhood (Simpson 0.57)
- Race & ethnicity
- White 57% Black 32% Hispanic / Latino 5% Two or more races 5% Asian 2%
- Hispanic origin (detail)
- Mexican 4%
- Common ancestry
- Serbian 2% Italian 2% Slovak 2%
- Foreign-born
- 4% · Canada
- Languages at home
- 94% English-only · Spanish 4% Other Indo-European 1% Arabic 1%
Political lean MEDSL · Madison
- 2024 margin
- R (+18.2) · D 40.3% · R 58.5% · Other 1.2%
- 2008→2024 swing
- +3.4pp toward D · 2008: -21.6pp · 2024: -18.2pp
- All cycles
- 2024: R+18.2 2020: R+12.9 2016: R+15.6 2012: R+8.9 2008: R+21.6
Not yet ingested
- Civics
- —
Market trends
- HPI YoY
- ▼ -118.63%
- Current HPI
- 195.4511
- Rent YoY
- ▲ 1.58%
- Metro
- Jackson, TN
- State GDP YoY
- ▲ 2.78%
- F500 in state
- 22
Industry mix (Fortune 500 HQ in TN)
| Industry | F500 HQs | Revenue |
|---|---|---|
| Healthcare | 3 | $91B |
|
||
| Retail | 3 | $72B |
|
||
| Transportation / Logistics | 1 | $88B |
|
||
| Paper / Packaging | 1 | $19B |
|
||
| Insurance | 1 | $13B |
|
||
| Energy | 1 | $12B |
|
||
Price history
+80.1% since first listed11 events — show timeline
- 2026-06-15 Listed $179,900 CWTAR
- 2025-04-28 Price Changed $239,900 CWTAR
- 2024-07-30 Sold (Public Records) $189,999 Public Records
- 2024-07-25 Sold (MLS) $189,999 CWTAR
- 2024-06-22 Pending — CWTAR
- 2024-06-06 Price Changed $199,900 CWTAR
- 2024-04-03 Price Changed $209,500 CWTAR
- 2024-02-17 Listed $219,500 CWTAR
- 2017-09-26 Sold (Public Records) $99,000 Public Records
- 2017-09-22 Sold (MLS) $99,000 CWTAR
- 2017-08-04 Listed $99,900 CWTAR
Property tax history
+1.5%/yrLatest (2025): $1,056 · +1.1% YoY. Source: county tax records.
Cash-flow waterfall
monthlySold comps — $/sqft
last 12 mo · ≤1 miLoading sold comps…