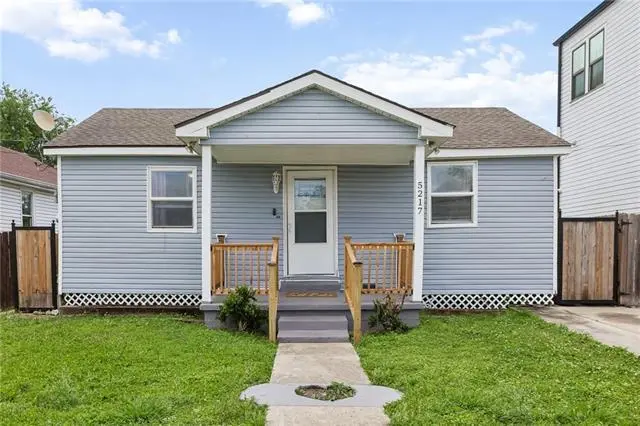
5217 Mandeville St · New Orleans, LA
Flood risk 8/10 · Major
- FEMA flood zone
- X (shaded)
- Chance of flooding over 30 yrs
- 0.6%
- Est. flood insurance / yr
- $507 – $1,088
Fire risk 1/10 · Minimal
- Est. fire insurance / yr
- $1,269 – $2,357
Heat risk 10/10 · Severe
- Hot days now (above 107°F)
- 7 days/yr
- Hot days in 30 yrs
- 21 days/yr
Wind risk 10/10 · Severe
- Chance of severe wind over 30 yrs
- 99.0%
Air-quality risk 4/10 · Minor
- Unhealthy air days now
- 4 days/yr
- Unhealthy air days in 30 yrs
- 4 days/yr
Risk factors via First Street. Map © Google.
Why this score? — see what drove the D grade
The composite is a weighted blend of 9 inputs, each scored 0–100. Each bar is that input's sub-score; the figure is the points it added to the 100-point composite (weight × sub-score).
- ARV discount +13.4/15.0
- Cash flow +13.1/30.0
- Livability +4.0/5.0
- DSCR +3.9/10.0
- 1% rule +3.0/10.0
- Condition / age +2.5/5.0
- Rent growth +2.3/5.0
- Schools +1.6/10.0
- Appreciation +0.0/10.0
$225,000
🖨 Deal sheet 📄 Offer letter ✓ Due diligence
Listing remarks
Picture yourself on the front porch of sweet cottage home located in a highly desirable part of the greater Gentilly neighborhood chatting with your friendly neighbors. Flexible floorplan allows for 3 bedrooms or 2 bedrooms with bonus space for in-home office, playroom or a myriad of other possibilities. Open living and kitchen area give a airy & spacious flow upon entry. The privacy backyard is a blank canvas for you to create your own garden or tropical oasis with a newly constructed wood deck overlooking the expansive greenery. Need some groceries for the family? Walk around the corner to the new Conseco's Market. Need to get to UNO or commute to downtown? Jump on Elysian Fields
Key facts
- Privacy backyard
- Expansive greenery
- Front porch
Tags
Neighborhood map
What this means for you Summary
Snapshot
- This is a 3-bed/2.0-bath single-family listed at $225k.
Deal economics
- At list price, monthly cash flow is $-75 ($-905/yr) — negative.
- To cash-flow at today's rent, offer at most $212k (5.9% below list).
- To meet the 1% rule (rent ≥ 1% of price), the offer needs to be $179k (20.5% below list).
- Recommended offer: $179k (20.5% below list) — sets the bar for 1% rule.
- Cap rate 6.2% vs local median 4.4% in New Orleans — top-decile yield for the area; either an underpriced asset or a hidden risk that comps aren't pricing in. Stress-test before assuming the spread holds.
Location & tenants
- Location reads 81/100 on livability (#3 in LA, #1,383 nationally) — a professional / high-income tenant draw. Strengths: amenities A+, commute A+, health & safety A+; Watch: crime C-, employment D.
- Orleans Parish (urban): math 11% / reading 27% proficiency, ranked #69 of 98 in LA (top 70%) — low school quality limits family demand, transient renter base, plan for 1-2y turnover; 68% free/reduced lunch — lower-income household profile, screen leases tightly.
- Market conditions: Rents soft (-0.6%/yr); 332 active listings in the ZIP; 40 comparable units currently listed for rent nearby; rentals at typical pace (median 17d on market — plan ~3-4 weeks tenant-placement turnaround); 710 units permitted in Orleans Parish in 2024 (244 in 5+ unit buildings).
- This rent runs 43% of the median local income ($49k/yr) — at the standard rent-burdened threshold; future hikes will face affordability resistance.
Forward outlook
- Local home prices are declining (-3.0%/yr); year-one equity from $2k of loan paydown is wiped out by about $7k of value loss. Plan a longer hold.
- Orleans County population projected at +61% by 2050 — long-run rental-demand tailwind backs the buy-and-hold thesis.
Negotiation context
- It's been on market 28 days — a 2% lower offer ($222k) is reasonable based on typical stale-listing flexibility.
- 7 sale attempts since 24y ago with the ask held roughly flat each time — persistent listings suggest the price (not the market) is what's stuck; bring a comps-based counter.
- Current owner paid $110k; list at $225k implies a 105% gain — meaningful room to come down on a strong offer.
Risks & watch-outs
- Watch-outs: flood insurance adds $66/mo; built in 1920 — expect roof / HVAC / electrical / plumbing capex.
- Climate carrying-cost: severe flood risk; severe wind risk, 99% chance of damaging wind over 30y; extreme-heat days projected 7→21/yr by 2055 (HVAC capex compounding) — expect insurance premiums to compound above CPI over the hold.
Questions for the listing agent
- What do current leases actually rent for vs. the listed asking? Can we see a recent rent roll and the last 12 months of T-12 income?
- Built in 1920 — when were the roof, HVAC, electrical panel, plumbing, and water heater last replaced?
- What's the actual annual flood-insurance premium (NFIP or private), and is the property in a SFHA with mandatory coverage?
- Is there a deadline driving the sale (1031 exchange, divorce, estate, relocation)? That informs how much negotiation room exists.
- The area grade is low — what's the realistic commute time and amenity access for the typical tenant pool here? Any planned neighborhood developments (good or bad) we should know about?
- What's the average days-on-market for RENTAL listings here right now (not sales)? A rising rental-DOM trend means longer vacancies and softer asking-rent achievability than the comps imply.
- What's the recent tenant-quality profile in this submarket — average credit score on applications, eviction rate, late-payment / NSF rate, and stable-employment percentage? A property-management company in the area should have these aggregated.
- How much new for-sale + rental construction is in the pipeline within 1–3 miles? Heavy new supply typically softens prices + rents 12–24 months out; constrained supply supports both.
Investment metrics
- 1% rule
- 0.80% ✗
- Cap rate
- 6.25%
- Cash-on-cash
- -0.17%
- DSCR
- 0.99
- GRM
- 10.5
CMA / ARV
- ARV (median comp)
- $259,027
- List price
- $225,000
- Delta
- -13.14%
- Verdict
- UNDERPRICED
- Comps
- 20 within 1.0 mi
Show comp detail 12 sales within ~0.75 mi
| Address | Dist | Beds/Ba | Sqft | Sold | Price | $/sf | Match |
|---|---|---|---|---|---|---|---|
| 4919 Western St | 0.27mi | 3/2.0 | 1,500 (+4%) | 1mo | $214,900 | $143 | 79 |
| 4619 Music St | 0.53mi | 3/1.5 | 1,439 (-0%) | 2mo | $245,000 | $170 | 72 |
| 4915 Painters St | 0.38mi | 3/2.0 | 1,331 (-8%) | 1mo | $320,000 | $240 | 69 |
| 4709 Painters St | 0.48mi | 2/2.0 (-1) | 1,365 (-5%) | 1mo | $220,000 | $161 | 63 |
| 4631 Painters St | 0.56mi | 3/2.0 | 1,345 (-7%) | 3mo | $239,000 | $178 | 60 |
| 5514 Wingate Dr | 0.66mi | 3/2.0 | 1,365 (-5%) | 0mo | $214,900 | $157 | 60 |
| 6049 Vermillion Blvd | 0.67mi | 2/2.0 (-1) | 1,408 (-2%) | 0mo | $205,000 | $146 | 60 |
| 6000 Elysian Fields Ave | 0.57mi | 3/2.0 | 1,330 (-8%) | 2mo | $254,000 | $191 | 59 |
| 4507 Annette St | 0.75mi | 4/2.0 (+1) | 1,500 (+4%) | 5mo | $265,000 | $177 | 49 |
| 4630 Eastern St | 0.75mi | 2/1.0 (-1) | 1,350 (-6%) | 1mo | $275,000 | $204 | 45 |
| 5145 Lafaye St | 0.53mi | 4/3.0 (+1) | 1,616 (+12%) | 2mo | $321,000 | $199 | 44 |
| 6029 Cameron Blvd | 0.68mi | 3/2.0 | 1,632 (+13%) | 3mo | $335,000 | $205 | 44 |
Match score weights: distance 35% · size 25% · config 20% · recency 20%. Top-matched comps best support the ARV.
Projected returns pro-forma
-3.0% appreciation · 0.0% rent growth · sell at horizon
- IRR
- -21.9%
- Equity multiple
- 0.26×
- Total profit
- $-46,520
- Equity at exit
- $33,548
- IRR
- -25.0%
- Equity multiple
- -0.06×
- Total profit
- $-67,016
- Equity at exit
- $19,454
Cash invested: $63,000 (down + closing). Projections, not guarantees.
Landlord ↔ Tenant lean methodology
- Overall (STATE)
- 90 Strongly Landlord-Friendly
- State Louisiana
- 90 Strongly Landlord-Friendly · R+12
- County
- — inherits STATE
- City
- — inherits STATE
ZIP-level market 70122
- Rents YoY
- -0.6%
- Active inventory
- 332
- Price-to-rent
- 10.5×
Monthly cashflow live
- Estimated rent
- $1,790 high interval (Pro) →
- Mortgage (P&I)
- −$1,180
- Tax from tax record
- −$149 /mo · $1,789/yr
- Insurance
- −$94
- Flood insurance flood zone
- −$66 /mo · $798/yr
- HOA
- −$0
- Vacancy / Maint / Mgmt
- −$376
- Net cashflow
- $-75
Break-even live
UW: 25.0% down · 7.5% · 30yr · 1.5% tax · 5.0% vac · 8.0% maint · 8.0% mgmt
Financing live
Cash to close
- Down payment
- $56,250
- Closing costs
- $6,750
- Reserves months
- —
- Total cash needed
- —
Loan-product check · same deal, 3 products live
Conventional
25% down · 7.5% · 30yr
- Down + closing
- —
- Monthly P&I
- —
- Monthly cashflow
- —
- DSCR
- —
- Eligible?
- —
Personal DTI + credit; lowest rate.
DSCR
20% down · 8.5% · 30yr
- Down + closing
- —
- Monthly P&I
- —
- Monthly cashflow
- —
- DSCR
- —
- Eligible?
- —
No personal income docs; deal must DSCR.
Hard money
10% down · 12.0% · 12mo
- Down + closing
- —
- Monthly P&I
- —
- Monthly cashflow
- —
- DSCR
- —
- Eligible?
- —
Short-term bridge; refi at stabilization.
Rent comps 40 comps
| Address | Beds | Baths | Sqft | Rent | $/sqft | DOM | Units | Dist |
|---|---|---|---|---|---|---|---|---|
| 5519 Mandeville St New Orleans, LA | 3.0 | 1.0 | 1125 | $1,650 | $1.47 | 3d | 1 | 0.23mi |
| 5172 Venus St Unit 5172 New Orleans, LA | 3.0 | 2.5 | 1864 | $2,450 | $1.31 | 23d | 1 | 0.29mi |
| 2458 Athis St New Orleans, LA | 4.0 | 2.0 | 1530 | $2,200 | $1.44 | 23d | 1 | 0.45mi |
| 5151 Saint Anthony Ave New Orleans, LA | 3.0 | 2.0 | 1200 | $1,795 | $1.50 | 16d | 1 | 0.46mi |
| 5546 Pasteur Blvd Unit A New Orleans, LA | 3.0 | 1.0 | 1200 | $1,400 | $1.17 | 23d | 1 | 0.47mi |
| 4618 Marigny St New Orleans, LA | 3.0 | 1.0 | 1320 | $1,900 | $1.44 | 23d | 1 | 0.48mi |
| 4616 Marigny St New Orleans, LA | 2.0 | 1.0 | 1020 | $1,750 | $1.72 | 21d | 1 | 0.48mi |
| 5718 Vermillion Blvd Unit A New Orleans, LA | 3.0 | 1.0 | 1300 | $2,000 | $1.54 | 23d | 1 | 0.49mi |
| 5723 Pasteur Blvd New Orleans, LA | 3.0 | 2.0 | 1150 | $1,700 | $1.48 | 17d | 1 | 0.52mi |
| 5322 Saint Anthony Ave New Orleans, LA | 3.0 | 2.0 | 1192 | $2,000 | $1.68 | 16d | 1 | 0.53mi |
| 5925 Saint Roch Ave New Orleans, LA | 2.0 | 1.0 | 1000 | $1,550 | $1.55 | 17d | 1 | 0.54mi |
| 4936 Baccich St New Orleans, LA | 3.0 | 1.0 | 1053 | $1,700 | $1.61 | 23d | 1 | 0.55mi |
| 4767 Lafaye St New Orleans, LA | 3.0 | 2.0 | 1469 | $2,000 | $1.36 | 23d | 1 | 0.57mi |
| 4736 Saint Anthony Ave New Orleans, LA | 3.0 | 1.0 | 1100 | $1,800 | $1.64 | 16d | 1 | 0.61mi |
| 2312 Madrid St New Orleans, LA | 2.0 | 1.0 | 1100 | $1,475 | $1.34 | 23d | 1 | 0.61mi |
| 5700 Saint Anthony Ave New Orleans, LA | 2.0 | 1.0 | 875 | $1,195 | $1.37 | 3d | 1 | 0.63mi |
| 6009 Pasteur Blvd New Orleans, LA | 3.0 | 2.0 | 1250 | $1,785 | $1.43 | 23d | 1 | 0.64mi |
| 5700 Wilton Dr New Orleans, LA | 2.0 | 1.0 | 900 | $1,500 | $1.67 | 16d | 1 | 0.65mi |
| 6036 Franklin Ave New Orleans, LA | 2.0 | 1.0 | 898 | $1,200 | $1.34 | 17d | 1 | 0.71mi |
| 5905 Lafaye St New Orleans, LA | 3.0 | 1.0 | 911 | $1,700 | $1.87 | 23d | 1 | 0.71mi |
| 4681 Eastern St New Orleans, LA | 2.0 | 1.0 | 1100 | $1,400 | $1.27 | 16d | 1 | 0.71mi |
| 4815 Warrington Dr New Orleans, LA | 3.0 | 2.0 | 1652 | $2,150 | $1.30 | 16d | 1 | 0.77mi |
| 6202 Vermillion Blvd New Orleans, LA | 3.0 | 2.0 | 1200 | $1,700 | $1.42 | 16d | 1 | 0.78mi |
| 6222 Arts St Unit 6226 New Orleans, LA | 2.0 | 1.5 | 1120 | $1,250 | $1.12 | 23d | 1 | 0.78mi |
| 5518 Warrington Dr Unit A New Orleans, LA | 2.0 | 2.0 | 900 | $1,500 | $1.67 | 23d | 1 | 0.78mi |
| 4304 Pauger St New Orleans, LA | 2.0 | 1.0 | 1345 | $1,450 | $1.08 | 3d | 1 | 0.79mi |
| 6079 Saint Anthony Ave New Orleans, LA | 3.0 | 2.0 | 1400 | $2,400 | $1.71 | 16d | 1 | 0.79mi |
| 2512 Mexico St New Orleans, LA | 3.0 | 2.0 | 975 | $1,550 | $1.59 | 23d | 1 | 0.81mi |
| 6329 Spain St New Orleans, LA | 3.0 | 2.0 | 1545 | $2,100 | $1.36 | 16d | 1 | 0.83mi |
| 5716 Warrington Dr New Orleans, LA | 4.0 | 3.0 | 1560 | $2,000 | $1.28 | 17d | 1 | 0.83mi |
| 6217 Curie St New Orleans, LA | 3.0 | 2.0 | 1700 | $1,500 | $0.88 | 23d | 1 | 0.83mi |
| 1903 Rosary Dr New Orleans, LA | 3.0 | 2.0 | 1500 | $1,800 | $1.20 | 23d | 1 | 0.85mi |
| 1940 Allen Toussaint Blvd New Orleans, LA | 3.0 | 2.0 | 1500 | $1,550 | $1.03 | 11d | 1 | 0.86mi |
| 1940 Allen Toussaint Blvd Unit 1940 New Orleans, LA | 3.0 | 2.0 | 1500 | $1,600 | $1.07 | 23d | 1 | 0.86mi |
| 6090 Wilton Dr New Orleans, LA | 2.0 | 1.0 | 1020 | $1,400 | $1.37 | 2d | 1 | 0.86mi |
| 6235 Curie St New Orleans, LA | 2.0 | 1.0 | 1000 | $1,400 | $1.40 | 23d | 1 | 0.88mi |
| 6235 Curie St Unit 6235 New Orleans, LA | 2.0 | 1.0 | 1000 | $1,350 | $1.35 | 10d | 1 | 0.88mi |
| 6237 Curie St New Orleans, LA | 2.0 | 1.0 | 1000 | $1,400 | $1.40 | 23d | 1 | 0.88mi |
| 6237 Curie St Unit 6237 New Orleans, LA | 2.0 | 1.0 | 1000 | $1,350 | $1.35 | 3d | 1 | 0.88mi |
| 6226 Lafaye St New Orleans, LA | 2.0 | 2.0 | 1137 | $2,600 | $2.29 | 11d | 1 | 0.89mi |
Listing history 23 events
-
2026-06-10days on market $225,000 Active 28 DOM
-
2026-06-09days on market $225,000 Active 27 DOM
-
2026-06-08days on market $225,000 Active 26 DOM
-
2026-06-07days on market $225,000 Active 25 DOM
-
2026-06-05days on market $225,000 Active 22 DOM
-
2026-06-03days on market $225,000 Active 21 DOM
-
2026-06-02days on market $225,000 Active 20 DOM
-
2026-06-01days on market $225,000 Active 19 DOM
-
2026-05-31days on market $225,000 Active 18 DOM
-
2026-05-13$225,000 Active 896-char remark
-
2026-05-13$225,000 Active 891-char remark
-
2021-08-27soldstatus $110,000
-
2020-08-05soldstatus $110,000 Closed
-
2020-07-18status Pending
-
2020-06-08price $125,000
-
2020-04-19$140,000 Active
-
2020-04-19$125,000
-
2011-05-10$130,000
-
2011-05-10$130,000
-
2003-01-29soldstatus $64,000
-
2002-11-07$69,000
-
2002-11-07$69,000
-
1999-06-08soldstatus $67,500
ⓘ Source: listings_history table (triggers on properties + properties_extension) + one-shot
backfill from property_details.listing_events for pre-trigger history.
Tax reassessment forecast LA · Resets to sale price
- Current annual tax
- $1,789 · $149/mo
- Projected year-2 tax
- $1,789 · $149/mo
- Expected delta
- $0/yr ($0/mo · -0.0%)
ⓘ Screening estimate from a state-policy table — verify with the county assessor before closing.
Climate risk First Street
- Flood 8/10 Severe FEMA zone X (shaded) · 60% chance over 30 yrs
- Wildfire 1/10 Low
- Heat 10/10 Extreme 7 d/yr ≥107°F today · 21 d/yr by 30 yrs out
- Wind 10/10 Extreme 99% chance of damaging wind over 30 yrs
- Air quality 4/10 Moderate 4 unhealthy d/yr today · 4 by 30 yrs out
Nearby sold comps map
Loading sold comps map…
Walkable amenities ~0.75 mi
Loading nearby amenities…
Taxation est. · year 1
- Rental income
- $21,475
- − Mortgage interest
- −$12,603
- − Property taxes
- −$1,789
- − Insurance
- −$1,922
- − Repairs & maintenance
- −$1,718
- − Management
- −$1,718
- − Depreciation
- −$6,545
- Taxable loss
- −$4,821
- Est. tax savings @ 24.0%
- +$1,157
- After-tax cash flow
- $252/yr
For passive investors: Depreciation is non-cash, so a rental often shows a tax loss while cash-flowing — sheltering income. Rental losses are passive: they offset passive income freely, and up to $25,000/yr can offset ordinary (W-2) income if you actively participate and your MAGI is under $100k (phasing out to $0 by $150k); unused losses carry forward. On sale, claimed depreciation is recaptured at up to 25%, and gains may owe capital-gains tax (a 1031 exchange can defer both). Figures are a year-1 estimate at your 24.0% rate — not tax advice; consult a CPA.
Schools (NCES district)
- District
- Orleans Parish
- NCES district ID
- 2201170
- Math proficiency
- 11% ▼ -52.00%
- Reading proficiency
- 27% ▼ -46.00%
- Median HH income
- $37,011
- Composite
- 15.78/100
- National rank
- #9271
- State rank
- #69 of 98 in LA
Livability — New Orleans
- Score
- 81/100
- State rank
- #3
- US rank
- #1383
Category grades
Schools grade is shown separately in the Schools card above.
Census & demographics
- Census place
- New Orleans, LA
- County
- Orleans Parish · 338,817 people
- City population
- 338,817
- Metro
- New Orleans-Metairie, LA
- Population (ZIP)
- 35,253
- Household income
- $49,455
- Rent vs Own
- Severe rent burden
- 2150.0
Population outlook (Orleans County) Hauer SSP2
- Today (2025)
- 513,025 people
- By 2030
- 575,781 · +12.2%
- By 2040
- 700,174 · +36.5%
- By 2050
- 826,541 · +61.1%
- By 2075
- 1,123,374 · +119.0%
- By 2100
- 1,355,609 · +164.2%
Race, ethnicity, and origin ACS 2023
- Neighborhood character
- Predominantly Black (69%)
- Race & ethnicity
- Black 69% White 18% Two or more races 7% Hispanic / Latino 6% Asian 1%
- Hispanic origin (detail)
- Mexican 1%
- Common ancestry
- Lithuanian 4% Italian 2% Slovak 1%
- Foreign-born
- 4% · Canada, China
- Languages at home
- 92% English-only · Spanish 5% Chinese 1% French/Haitian/Cajun 1%
Political lean MEDSL · Orleans
- 2024 margin
- Solid D (+67.0) · D 82.2% · R 15.2% · Other 2.7%
- 2008→2024 swing
- +6.7pp toward D · 2008: 60.3pp · 2024: 67.0pp
- All cycles
- 2024: D+67.0 2020: D+68.2 2016: D+66.2 2012: D+62.5 2008: D+60.3
Not yet ingested
- Civics
- —
Market trends
- HPI YoY
- ▼ -222.37%
- Current HPI
- 231.9921
- Rent YoY
- ▼ -0.61%
- Metro
- New Orleans-Metairie, LA
- State GDP YoY
- ▲ 3.29%
- F500 in state
- 10
Industry mix (Fortune 500 HQ in LA)
| Industry | F500 HQs | Revenue |
|---|---|---|
| Telecommunications | 2 | $23B |
|
||
| Utilities | 1 | $12B |
|
||
| Wholesale / Distribution | 1 | $5B |
|
||
| Advertising | 1 | $2B |
|
||
Price history
+233.3% since first listed13 events — show timeline
- 2026-05-13 Listed $225,000 AcadianaMLS
- 2021-08-27 Sold (Public Records) $110,000 Public Records
- 2020-08-05 Sold (MLS) $110,000 GSREIN
- 2020-07-18 Pending — GSREIN
- 2020-06-08 Price Changed $125,000 GSREIN
- 2020-04-19 Listed $140,000 GSREIN
- 2020-04-19 Listed $125,000 AcadianaMLS
- 2011-05-10 Listed $130,000 GSREIN
- 2011-05-10 Listed $130,000 AcadianaMLS
- 2003-01-29 Sold (MLS) $64,000 GSREIN
- 2002-11-07 Listed $69,000 AcadianaMLS
- 2002-11-07 Listed $69,000 GSREIN
- 1999-06-08 Sold (Public Records) $67,500 Public Records
Property tax history
-1.5%/yrLatest (2026): $1,789 · +1.1% YoY. Source: county tax records.
Cash-flow waterfall
monthlySold comps — $/sqft
last 12 mo · ≤1 miLoading sold comps…