673 Garden Walk Dr · Stone Mountain, GA
Flood risk 1/10 · Minimal
- FEMA flood zone
- X (unshaded)
- Chance of flooding over 30 yrs
- 0.0%
- Est. flood insurance / yr
- $507 – $1,088
Fire risk 1/10 · Minimal
- Est. fire insurance / yr
- $963 – $1,789
Heat risk 5/10 · Moderate
- Hot days now (above 104°F)
- 7 days/yr
- Hot days in 30 yrs
- 17 days/yr
Wind risk 4/10 · Minor
- Chance of severe wind over 30 yrs
- 21.0%
Air-quality risk 6/10 · Moderate
- Unhealthy air days now
- 8 days/yr
- Unhealthy air days in 30 yrs
- 11 days/yr
Risk factors via First Street. Map © Google.
Why this score? — see what drove the C grade
The composite is a weighted blend of 9 inputs, each scored 0–100. Each bar is that input's sub-score; the figure is the points it added to the 100-point composite (weight × sub-score).
- ARV discount +15.0/15.0
- Cash flow +14.8/30.0
- 1% rule +10.0/10.0
- DSCR +4.5/10.0
- Livability +4.0/5.0
- Rent growth +2.8/5.0
- Condition / age +2.5/5.0
- Schools +2.1/10.0
- Appreciation +0.0/10.0
$100,000
🖨 Deal sheet 📄 Offer letter ✓ Due diligence
Listing remarks MLS
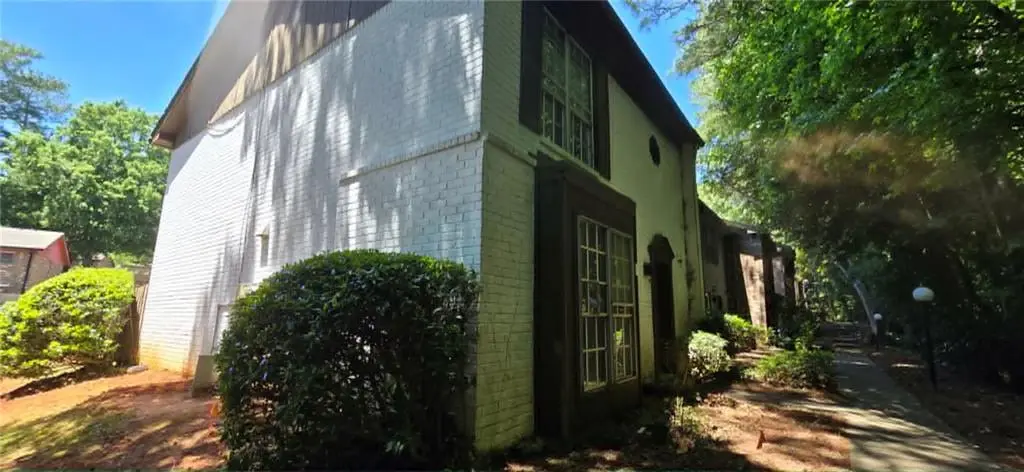
Opportunity knocks in the heart of Stone Mountain! Priced at just $100K, this two-story End unit townhome offers incredible potential for the savvy investor, renovator, or owner-occupant ready to bring their vision to life. Featuring 3 spacious bedrooms and 2 full baths upstairs, plus a convenient half bath on the main level, this home offers a functional roommate-friendly layout with great bones and endless possibilities. The main level includes a laundry room for convenience, while the fenced rear area and private storage shed add valuable outdoor functionality and extra space. A covered 2-car carport provides protected parking year-round. Bring your imagination and transform this hidden gem into something truly special. Whether you're looking for your next flip, rental investment, or affordable place to personalize, the value here is hard to beat. Conveniently located with easy access to Highway 78 and I-285, making commuting to Decatur, Tucker, Downtown Atlanta, and the Perimeter a breeze. Enjoy being just minutes from Stone Mountain Park with its scenic trails, outdoor recreation, festivals, golf, and year-round attractions. Nearby shopping, dining, and entertainment can be found at Stonecrest Marketplace along with local restaurants, parks, and everyday conveniences nearby. Affordable opportunities like this don't come around often! - This property is eligible under the First Look Initiative. All Owner Occupant offers will be responded to after 7 days on the market and Investor offers will be responded to after 30 days. However, all offers can be submitted during the First Look period. - All offers must be entered through propoffers website - An offer management fee of $200 (plus sales tax, where applicable) is charged by Pyramid Platform in connection with the use of Propoffers. This fee will be paid at closing from the agent representing the buyer as selling agent or transaction broker. - Subject to seller addendum - For financed offers EMD to be 1% or $1000 whichever is greater and for cash offers EMD to be 5% or $5000 whichever is greater. - All offers are subject to OFAC clearance. - Sold AS IS. - A viewing release must be signed and returned to our office before showing this property.
Key facts
- Laundry room
- Fenced rear area
- Private storage shed
Tags
Property features AI
Finance
- Other: Please use GPS for driving directions; Located in Dekalb County
- HOA & community: Homeowners association; Monthly association fee ($415); Community sidewalks; Street lights; Community of 134 units
Exterior
- Parking: Carport (2 carport spaces)
- Utilities: Public water; Public sewer; 110 volt electric; Cable available; Electricity available; Natural gas available; Phone available; Underground utilities; Water available; Sewer available
- Home design: Two-story property; Brick and frame construction; Fee simple ownership; Slab foundation; Composition roof
- Construction: Brick and frame construction; Composition roof; Slab foundation
- Exterior features: Private yard; Storage; Patio; Back yard fenced with wood fencing; Fixer condition
Interior
- Kitchen: Dishwasher; Disposal; Cabinets; Laminate counters; Separate dining room
- Bedrooms: Three bedrooms on the upper level; Roommate floor plan
- Flooring: Carpet; Hardwood
- Bathrooms: Two full bathrooms; One half bathroom; Master bath with tub/shower combo
- Heating & cooling: Central air; Ceiling fans; Forced air heating
- Interior features: High speed internet; End unit (no shared common walls)
- Laundry & utility: Laundry on main level
Neighborhood map
What this means for you Summary
Snapshot
- This is a 3-bed/2.5-bath townhouse listed at $100k.
Deal economics
- At list price, monthly cash flow is $27 ($327/yr) — positive.
- The deal already cash-flows at list — no discount required.
- Meets the 1% rule at list price ($2k rent vs $100k).
- Recommended offer: $97k (3.0% below list) — sets the bar for market timing.
- Cap rate 6.6% vs local median 5.1% in Stone Mountain — meaningfully above typical; check what's discounted (condition, days-on-market, listing class) to confirm the premium yield is real.
Location & tenants
- Location reads 79/100 on livability (#11 in GA, #1,977 nationally) — a middle-class / working-renter tenant base. Strengths: commute A+, cost of living A+, housing A+; Watch: employment D+, crime F.
- Dekalb County (suburban): math 19% / reading 28% proficiency, ranked #125 of 174 in GA (top 72%) — low school quality limits family demand, transient renter base, plan for 1-2y turnover; 68% free/reduced lunch — lower-income household profile, screen leases tightly.
- Zoned schools: Stone Mountain Middle School (math 12% / reading 15%, grade F, #407 of 470 statewide, top 87%, 1,072 students, 100% FRL); Stone Mountain High School (math 8% / reading 12%, grade F, #365 of 424 statewide, top 88%, 1,202 students, 100% FRL) — zoned schools average 100% FRL vs 68% district-wide (32 pts higher); higher-poverty schools than district average — tighter screening recommended.
- Market conditions: Rents rising (+1.3%/yr); 257 active listings in the ZIP; 39 comparable units currently listed for rent nearby; rentals leasing fast (median 13d on market — plan ~1-2 weeks tenant-placement turnaround); 1,240 units permitted in DeKalb County in 2024 (385 in 5+ unit buildings).
- This rent runs 36% of the median local income ($55k/yr) — at the standard rent-burdened threshold; future hikes will face affordability resistance.
Forward outlook
- Local home prices are declining (-3.0%/yr); year-one equity from $691 of loan paydown is wiped out by about $3k of value loss. Plan a longer hold.
- DeKalb County population projected at +28% by 2050 — long-run rental-demand tailwind backs the buy-and-hold thesis.
Negotiation context
- It's been on market 35 days — a 3% lower offer ($97k) is reasonable based on typical stale-listing flexibility.
- 2 sale attempts with the ask held roughly flat each time — persistent listings suggest the price (not the market) is what's stuck; bring a comps-based counter.
- Current owner paid $56k; list at $100k implies a 79% gain — meaningful room to come down on a strong offer.
Risks & watch-outs
- Watch-outs: property tax is 3.6% of price; HOA is 25% of rent.
- Climate carrying-cost: extreme-heat days projected 7→17/yr by 2055 (HVAC capex compounding) — expect insurance premiums to compound above CPI over the hold.
Questions for the listing agent
- It's been on market 35 days. Have you received any prior offers? Is the seller open to a 3% concession, seller financing, or rate buy-down credit?
- Built in 1972 — when were the roof, HVAC, electrical panel, plumbing, and water heater last replaced?
- Property tax is high relative to price — has the assessment been appealed recently, and will the sale trigger a re-assessment?
- What does the HOA fee cover, when was the last increase, and are there any pending special assessments or reserve-fund shortfalls?
- Is there a deadline driving the sale (1031 exchange, divorce, estate, relocation)? That informs how much negotiation room exists.
- Schools are F-rated, which usually means shorter tenancies and higher turnover. Who's the typical renter profile here, and what's been the actual vacancy rate?
- Crime grade is F in this area — have there been break-ins, vandalism, or insurance claims at this property in the last 3 years? What carrier currently insures it and at what premium?
- What's the average days-on-market for RENTAL listings here right now (not sales)? A rising rental-DOM trend means longer vacancies and softer asking-rent achievability than the comps imply.
- What's the recent tenant-quality profile in this submarket — average credit score on applications, eviction rate, late-payment / NSF rate, and stable-employment percentage? A property-management company in the area should have these aggregated.
- How much new for-sale + rental construction is in the pipeline within 1–3 miles? Heavy new supply typically softens prices + rents 12–24 months out; constrained supply supports both.
Investment metrics
- 1% rule
- 1.66% ✓
- Cap rate
- 6.62%
- Cash-on-cash
- 1.17%
- DSCR
- 1.05
- GRM
- 5.0
CMA / ARV
- ARV (median comp)
- $150,698
- List price
- $100,000
- Delta
- -33.64%
- Verdict
- UNDERPRICED
- Comps
- 20 within 1.0 mi
Show comp detail 7 sales within ~0.75 mi
| Address | Dist | Beds/Ba | Sqft | Sold | Price | $/sf | Match |
|---|---|---|---|---|---|---|---|
| 607 Garden Walk Dr | 0.07mi | 3/2.5 | 1,414 (0%) | 5mo | $175,000 | $124 | 93 |
| 748 Garden View Dr | 0.13mi | 3/2.5 | 1,414 (0%) | 13mo | $167,000 | $118 | 83 |
| 714 Garden View Dr | 0.19mi | 3/2.5 | 1,414 (0%) | 16mo | $154,999 | $110 | 78 |
| 618 Garden Walk Dr | 0.06mi | 3/2.5 | 1,408 (-0%) | 22mo | $170,000 | $121 | 78 |
| 606 Garden Walk Dr | 0.08mi | 3/1.5 | 1,260 (-11%) | 8mo | $145,000 | $115 | 68 |
| 5293 Oakridge Dr | 0.65mi | 2/2.5 (-1) | 1,280 (-10%) | 15mo | $197,000 | $154 | 36 |
| 5287 Oakridge Dr | 0.64mi | 2/2.5 (-1) | 1,280 (-10%) | 23mo | $180,000 | $141 | 30 |
Match score weights: distance 35% · size 25% · config 20% · recency 20%. Top-matched comps best support the ARV.
Projected returns pro-forma
-3.0% appreciation · 1.31% rent growth · sell at horizon
- IRR
- -17.5%
- Equity multiple
- 0.40×
- Total profit
- $-16,854
- Equity at exit
- $14,910
- IRR
- -15.9%
- Equity multiple
- 0.22×
- Total profit
- $-21,861
- Equity at exit
- $8,646
Cash invested: $28,000 (down + closing). Projections, not guarantees.
Landlord ↔ Tenant lean methodology
- Overall (STATE)
- 90 Strongly Landlord-Friendly
- State Georgia
- 90 Strongly Landlord-Friendly · R+3
- County
- — inherits STATE
- City
- — inherits STATE
ZIP-level market 30083
- Rents YoY
- 1.3%
- Active inventory
- 257
- Price-to-rent
- 5.0×
Monthly cashflow live
- Estimated rent
- $1,658 high interval (Pro) →
- Mortgage (P&I)
- −$524
- Tax from tax record
- −$301 /mo · $3,618/yr
- Insurance
- −$42
- HOA
- −$415
- Vacancy / Maint / Mgmt
- −$348
- Net cashflow
- $27
Break-even live
UW: 25.0% down · 7.5% · 30yr · 1.5% tax · 5.0% vac · 8.0% maint · 8.0% mgmt
Financing live
Cash to close
- Down payment
- $25,000
- Closing costs
- $3,000
- Reserves months
- —
- Total cash needed
- —
Loan-product check · same deal, 3 products live
Conventional
25% down · 7.5% · 30yr
- Down + closing
- —
- Monthly P&I
- —
- Monthly cashflow
- —
- DSCR
- —
- Eligible?
- —
Personal DTI + credit; lowest rate.
DSCR
20% down · 8.5% · 30yr
- Down + closing
- —
- Monthly P&I
- —
- Monthly cashflow
- —
- DSCR
- —
- Eligible?
- —
No personal income docs; deal must DSCR.
Hard money
10% down · 12.0% · 12mo
- Down + closing
- —
- Monthly P&I
- —
- Monthly cashflow
- —
- DSCR
- —
- Eligible?
- —
Short-term bridge; refi at stabilization.
Rent comps 39 comps
| Address | Beds | Baths | Sqft | Rent | $/sqft | DOM | Units | Dist |
|---|---|---|---|---|---|---|---|---|
| 827 San Miguel Dr Stone Mountain, GA | 3.0 | 2.0 | 1272 | $1,550 | $1.22 | 16d | 1 | 0.24mi |
| 5025 Brittany Dr Stone Mountain, GA | 3.0 | 2.5 | 1484 | $1,845 | $1.24 | 12d | 1 | 0.32mi |
| 6097 Memorial Dr Stone Mountain, GA | 2.0–3.0 | 1.0–2.0 | 1123 | $1,671 | $1.49 | 3d | 9 | 0.55mi |
| 5290 Stonebush Ter Unit A Stone Mountain, GA | 2.0 | 2.5 | 1200 | $1,450 | $1.21 | 18d | 1 | 0.60mi |
| 5280 Ridge Forest Dr Stone Mountain, GA | 2.0 | 2.5 | 1170 | $1,325 | $1.13 | 43d | 1 | 0.63mi |
| 5351 Ridgemere Ct Stone Mountain, GA | 3.0 | 2.5 | 1160 | $1,465 | $1.26 | 5d | 1 | 0.68mi |
| 5353 Ridgemere Ct Stone Mountain, GA | 3.0 | 2.5 | 1160 | $1,465 | $1.26 | 5d | 1 | 0.68mi |
| 967 Pine Roc Dr Stone Mountain, GA | 3.0 | 2.0 | 1206 | $1,900 | $1.58 | 10d | 1 | 0.70mi |
| 5370 Zachary Dr Stone Mountain, GA | 4.0 | 2.0 | 1556 | $1,150 | $0.74 | 24d | 1 | 0.77mi |
| 5030 W Mountain St Stone Mountain, GA | 2.0 | 1.0 | 1175 | $1,199 | $1.02 | 43d | 1 | 0.84mi |
| 5100 W Mountain St Stone Mountain, GA | 1.0–3.0 | 1.0–2.0 | 1150 | $1,484 | $1.29 | 3d | 11 | 0.86mi |
| 1010 Sexton Dr Stone Mountain, GA | 2.0 | 2.0 | 1000 | $1,250 | $1.25 | 12d | 1 | 0.88mi |
| 768 Fourth St Stone Mountain, GA | 3.0 | 2.0 | 1200 | $2,100 | $1.75 | 5d | 1 | 0.89mi |
| 697 Pepperwood Trl Stone Mountain, GA | 3.0 | 2.0 | 1576 | $1,650 | $1.05 | 43d | 1 | 0.93mi |
| 779 Pepperwood Trl Stone Mountain, GA | 3.0 | 2.0 | 1458 | $2,045 | $1.40 | 4d | 1 | 1.02mi |
| 5509 Stonehaven Way Stone Mountain, GA | 4.0 | 3.0 | 1635 | $1,899 | $1.16 | 22d | 1 | 1.06mi |
| 1075 N Hairston Rd Stone Mountain, GA | 1.0–3.0 | 1.0–2.0 | 992 | $1,540 | $1.55 | 5d | 12 | 1.08mi |
| 1073 Thornwoode Ln Stone Mountain, GA | 3.0 | 2.5 | 1235 | $697 | $0.56 | 22d | 1 | 1.09mi |
| 1047 Ridge Ave Stone Mountain, GA | 3.0 | 1.0 | 1402 | $2,150 | $1.53 | 24d | 1 | 1.09mi |
| 4958 Central Dr Apt D Stone Mountain, GA | 2.0 | 1.0 | 900 | $995 | $1.11 | 22d | 1 | 1.14mi |
| 1010 Mariners Ct Stone Mountain, GA | 3.0 | 2.0 | 1739 | $1,475 | $0.85 | 43d | 1 | 1.16mi |
| 2700 Summit Creek Dr Stone Mountain, GA | 2.0 | 1.0–2.0 | 926 | $1,279 | $1.38 | 2d | 34 | 1.19mi |
| 1059 Mariners Dr Stone Mountain, GA | 2.0 | 1.5 | 1328 | $1,600 | $1.20 | 43d | 1 | 1.20mi |
| 4959 Demere Ct Stone Mountain, GA | 3.0 | 2.0 | 1695 | $2,000 | $1.18 | 12d | 1 | 1.24mi |
| 4900 Central Dr Stone Mountain, GA | 1.0–3.0 | 1.0–2.0 | 1100 | $1,725 | $1.57 | 1d | 15 | 1.25mi |
| 4996 Sheila Ln Stone Mountain, GA | 4.0 | 2.0 | 1450 | $1,890 | $1.30 | 1d | 1 | 1.31mi |
| 4631 Garden Hills Dr Stone Mountain, GA | 3.0 | 2.0 | 1382 | $1,671 | $1.21 | 16d | 1 | 1.33mi |
| 5612 Pennybrook Ct Stone Mountain, GA | 3.0 | 2.0 | 1364 | $1,941 | $1.42 | 12d | 1 | 1.33mi |
| 421 Prince of Wales Stone Mountain, GA | 2.0 | 2.5 | 1036 | $1,250 | $1.21 | 22d | 1 | 1.34mi |
| 1150 Rankin St Stone Mountain, GA | 2.0–3.0 | 2.5 | 1437 | $1,850 | $1.29 | 43d | 2 | 1.35mi |
| 4923 Sheila Ln Stone Mountain, GA | 3.0 | 2.0 | 1266 | $1,200 | $0.95 | 43d | 1 | 1.35mi |
| 1173 N Hairston Rd Stone Mountain, GA | 2.0 | 1.0–2.0 | 1161 | $1,426 | $1.23 | 1d | 30 | 1.36mi |
| 1150 Rankin St Stone Mountain, GA | 2.0 | 2.5 | 1495 | $1,850 | $1.24 | 24d | 1 | 1.36mi |
| 4625 High Collier Walk Stone Mountain, GA | 3.0 | 2.0 | 1400 | $1,000 | $0.71 | 11d | 1 | 1.36mi |
| 478 Prince of Wales Stone Mountain, GA | 2.0 | 2.0 | 1064 | $1,475 | $1.39 | 43d | 1 | 1.39mi |
| 5165 Fairforest Dr Stone Mountain, GA | 3.0 | 2.0 | 1344 | $1,695 | $1.26 | 43d | 1 | 1.42mi |
| 5482 Martins Crossing Rd Stone Mountain, GA | 3.0 | 2.0 | 1482 | $1,575 | $1.06 | 12d | 1 | 1.45mi |
| 905 Hemingway Rd Stone Mountain, GA | 3.0 | 2.0 | 1400 | $1,625 | $1.16 | 12d | 1 | 1.46mi |
| 1 Chatfield Dr Stone Mountain, GA | 1.0–3.0 | 1.0–2.5 | 1060 | $1,565 | $1.48 | 2d | 20 | 1.46mi |
HOA detail
- Monthly dues
- $415 · $4,980/yr
- Likely covers
- cable
Listing history 16 events
-
2026-06-18days on market $100,000 Active 35 DOM
-
2026-06-17days on market $100,000 Active 34 DOM
-
2026-06-16days on market $100,000 Active 33 DOM
-
2026-06-15days on market $100,000 Active 32 DOM
-
2026-06-13days on market $100,000 Active 30 DOM
-
2026-06-09days on market $100,000 Active 26 DOM
-
2026-06-08days on market $100,000 Active 25 DOM
-
2026-06-07days on market $100,000 Active 24 DOM
-
2026-06-04days on market $100,000 Active 21 DOM
-
2026-06-03days on market $100,000 Active 20 DOM
-
2026-06-02days on market $100,000 Active 19 DOM
-
2026-06-01days on market $100,000 Active 18 DOM
-
2026-05-31days on market $100,000 Active 17 DOM
-
2026-05-14$100,000 Active 2248-char remark
Show marketing remark (2248 chars)
Opportunity knocks in the heart of Stone Mountain! Priced at just $100K, this two-story End unit townhome offers incredible potential for the savvy investor, renovator, or owner-occupant ready to bring their vision to life. Featuring 3 spacious bedrooms and 2 full baths upstairs, plus a convenient half bath on the main level, this home offers a functional roommate-friendly layout with great bones and endless possibilities. The main level includes a laundry room for convenience, while the fenced rear area and private storage shed add valuable outdoor functionality and extra space. A covered 2-car carport provides protected parking year-round. Bring your imagination and transform this hidden gem into something truly special. Whether you're looking for your next flip, rental investment, or affordable place to personalize, the value here is hard to beat. Conveniently located with easy access to Highway 78 and I-285, making commuting to Decatur, Tucker, Downtown Atlanta, and the Perimeter a breeze. Enjoy being just minutes from Stone Mountain Park with its scenic trails, outdoor recreation, festivals, golf, and year-round attractions. Nearby shopping, dining, and entertainment can be found at Stonecrest Marketplace along with local restaurants, parks, and everyday conveniences nearby. Affordable opportunities like this don't come around often! - This property is eligible under the First Look Initiative. All Owner Occupant offers will be responded to after 7 days on the market and Investor offers will be responded to after 30 days. However, all offers can be submitted during the First Look period. - All offers must be entered through propoffers website - An offer management fee of $200 (plus sales tax, where applicable) is charged by Pyramid Platform in connection with the use of Propoffers. This fee will be paid at closing from the agent representing the buyer as selling agent or transaction broker. - Subject to seller addendum - For financed offers EMD to be 1% or $1000 whichever is greater and for cash offers EMD to be 5% or $5000 whichever is greater. - All offers are subject to OFAC clearance. - Sold AS IS. - A viewing release must be signed and returned to our office before showing this property.
-
1997-09-08soldstatus $56,000
-
1987-07-30soldstatus $50,000
ⓘ Source: listings_history table (triggers on properties + properties_extension) + one-shot
backfill from property_details.listing_events for pre-trigger history.
Tax reassessment forecast GA · Resets to sale price
- Current annual tax
- $3,618 · $301/mo
- Projected year-2 tax
- $3,618 · $301/mo
- Expected delta
- $0/yr ($0/mo · 0.0%)
ⓘ Screening estimate from a state-policy table — verify with the county assessor before closing.
Climate risk First Street
- Flood 1/10 Low FEMA zone X (unshaded) · 0% chance over 30 yrs
- Wildfire 1/10 Low
- Heat 5/10 Major 7 d/yr ≥104°F today · 17 d/yr by 30 yrs out
- Wind 4/10 Moderate 21% chance of damaging wind over 30 yrs
- Air quality 6/10 Major 8 unhealthy d/yr today · 11 by 30 yrs out
Nearby sold comps map
Loading sold comps map…
Walkable amenities ~0.75 mi
Loading nearby amenities…
Taxation est. · year 1
- Rental income
- $19,896
- − Mortgage interest
- −$5,602
- − Property taxes
- −$3,618
- − Insurance
- −$500
- − Repairs & maintenance
- −$1,592
- − Management
- −$1,592
- − HOA
- −$4,980
- − Depreciation
- −$2,909
- Taxable loss
- −$896
- Est. tax savings @ 24.0%
- +$215
- After-tax cash flow
- $542/yr
For passive investors: Depreciation is non-cash, so a rental often shows a tax loss while cash-flowing — sheltering income. Rental losses are passive: they offset passive income freely, and up to $25,000/yr can offset ordinary (W-2) income if you actively participate and your MAGI is under $100k (phasing out to $0 by $150k); unused losses carry forward. On sale, claimed depreciation is recaptured at up to 25%, and gains may owe capital-gains tax (a 1031 exchange can defer both). Figures are a year-1 estimate at your 24.0% rate — not tax advice; consult a CPA.
Schools (NCES district)
- District
- Dekalb County
- NCES district ID
- 1301740
- Math proficiency
- 19% ▼ -12.00%
- Reading proficiency
- 28% ▼ -7.00%
- Median HH income
- $51,448
- Composite
- 20.92/100
- National rank
- #8482
- State rank
- #125 of 174 in GA
Livability — Stone Mountain
- Score
- 79/100
- State rank
- #11
- US rank
- #1977
Category grades
Schools grade is shown separately in the Schools card above.
Census & demographics
- Census place
- Stone Mountain, GA
- County
- Dekalb County · 782,738 people
- City population
- 130,941
- Metro
- Atlanta-Sandy Springs-Alpharetta, GA
- Population (ZIP)
- 62,724
- Household income
- $55,307
- Rent vs Own
- Severe rent burden
- 3574.0
Population outlook (DeKalb County) Hauer SSP2
- Today (2025)
- 839,977 people
- By 2030
- 891,768 · +6.2%
- By 2040
- 988,894 · +17.7%
- By 2050
- 1,074,583 · +27.9%
- By 2075
- 1,245,026 · +48.2%
- By 2100
- 1,303,135 · +55.1%
Race, ethnicity, and origin ACS 2023
- Neighborhood character
- Predominantly Black (75%)
- Race & ethnicity
- Black 75% White 8% Asian 8% Hispanic / Latino 5% Two or more races 5%
- Common ancestry
- Arab 1%
- Foreign-born
- 24% · Canada, Vietnam, India
- Languages at home
- 71% English-only · Spanish 4% Other Indo-European 4% Vietnamese 2%
Political lean MEDSL · DeKalb
- 2024 margin
- Solid D (+64.8) · D 81.9% · R 17.1% · Other 1.0%
- 2008→2024 swing
- +6.1pp toward D · 2008: 58.6pp · 2024: 64.8pp
- All cycles
- 2024: D+64.8 2020: D+67.4 2016: D+64.8 2012: D+56.8 2008: D+58.6
Not yet ingested
- Civics
- —
Market trends
- HPI YoY
- ▼ -213.61%
- Current HPI
- 216.2527
- Rent YoY
- ▲ 1.31%
- Metro
- Atlanta-Sandy Springs-Alpharetta, GA
- State GDP YoY
- ▲ 2.66%
- F500 in state
- 28
Industry mix (Fortune 500 HQ in GA)
| Industry | F500 HQs | Revenue |
|---|---|---|
| Paper / Packaging | 2 | $29B |
|
||
| Retail | 1 | $160B |
|
||
| Transportation / Logistics | 1 | $91B |
|
||
| Airlines | 1 | $62B |
|
||
| Consumer Goods | 1 | $47B |
|
||
| Utilities | 1 | $25B |
|
||
Price history
+100.0% since first listed4 events — show timeline
- 2026-05-14 Listed $100,000 FMLS
- 2026-05-14 Listed $100,000 GAMLS
- 1997-09-08 Sold (Public Records) $56,000 Public Records
- 1987-07-30 Sold (Public Records) $50,000 Public Records
Property tax history
+4.1%/yrLatest (2025): $3,618 · -3.0% YoY. Source: county tax records.
Cash-flow waterfall
monthlySold comps — $/sqft
last 12 mo · ≤1 miLoading sold comps…