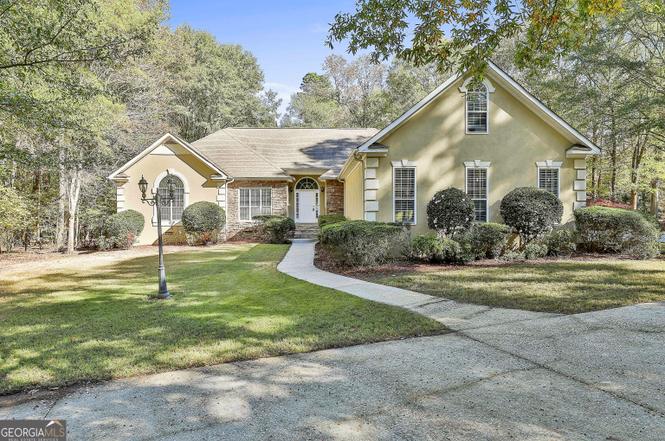
365 Pendleton Trl · Tyrone, GA
Flood risk 1/10 · Minimal
- FEMA flood zone
- X (unshaded)
- Chance of flooding over 30 yrs
- 0.0%
- Est. flood insurance / yr
- $507 – $1,088
Fire risk 4/10 · Minor
- Est. fire insurance / yr
- $963 – $1,789
Heat risk 5/10 · Moderate
- Hot days now (above 104°F)
- 7 days/yr
- Hot days in 30 yrs
- 19 days/yr
Wind risk 6/10 · Moderate
- Chance of severe wind over 30 yrs
- 27.0%
Air-quality risk 3/10 · Minor
- Unhealthy air days now
- 4 days/yr
- Unhealthy air days in 30 yrs
- 4 days/yr
Risk factors via First Street. Map © Google.
Why this score? — see what drove the C- grade
The composite is a weighted blend of 9 inputs, each scored 0–100. Each bar is that input's sub-score; the figure is the points it added to the 100-point composite (weight × sub-score).
- Cash flow +18.1/30.0
- ARV discount +12.8/15.0
- DSCR +5.7/10.0
- Schools +5.1/10.0
- 1% rule +4.0/10.0
- Livability +4.0/5.0
- Rent growth +2.5/5.0
- Condition / age +2.5/5.0
- Appreciation +0.0/10.0
$499,900
🖨 Deal sheet (PDF) 📄 Offer letter ✓ Due diligence
Listing remarks
Freshly painted interior with updated quartz countertops in the kitchen and primary bath. The high bar top in the kitchen was lowered for a more modern, open look. Refinished hardwood floors, new ceiling fans, and new exterior door hardware. Carpet and screened porch tile are newly cleaned. Beautiful, sprawling ranch situated on nearly one acre in a desirable swim, tennis, and lake community. This well-maintained home offers 4 bedrooms, 3 full baths, a large bonus room, and a private office accessible through the garage-ideal for working from home or hobbies. The spacious kitchen features newer stainless-steel appliances, a large island, walk-in pantry, quartz countertops, and hardwood floo
Key facts
- New ceiling fans
- High bar top
- 0.95 acre lot
Tags
Neighborhood map
What this means for you Summary
Snapshot
- This is a 4-bed/4.0-bath single-family listed at $500k.
Deal economics
- At list price, monthly cash flow is $442 ($5k/yr) — positive.
- The deal already cash-flows at list — no discount required.
- To meet the 1% rule (rent ≥ 1% of price), the offer needs to be $452k (9.6% below list).
- Recommended offer: $452k (9.6% below list) — sets the bar for 1% rule.
- Cap rate 7.4% vs local median 3.4% in Tyrone — top-decile yield for the area; either an underpriced asset or a hidden risk that comps aren't pricing in. Stress-test before assuming the spread holds.
Location & tenants
- Location reads 79/100 on livability (#13 in GA, #2,017 nationally) — a middle-class / working-renter tenant base. Strengths: crime A+, employment A+, housing A+; Watch: amenities F, commute F.
- Fayette County (suburban): math 52% / reading 60% proficiency, ranked #7 of 174 in GA (top 4%) — acceptable for families but not a draw, mixed tenant base, ~2y average lease.
- Zoned schools: Robert J. Burch Elementary School (math 44% / reading 52%, grade D, #289 of 1,228 statewide, top 24%, 579 students, 52% FRL); Flat Rock Middle School (math 35% / reading 55%, grade D, #103 of 470 statewide, top 23%, 883 students, 46% FRL); Sandy Creek High School (math 23% / reading 42%, grade F, #104 of 424 statewide, top 25%, 1,188 students, 43% FRL) — zoned schools average 47% FRL vs 21% district-wide (26 pts higher); higher-poverty schools than district average — tighter screening recommended.
- Zoned-school proficiency averages 42% at this address vs 56% district-wide (-14 pts) — the specific schools serving this property underperform the Fayette County average; the district grade overstates school quality for this exact location.
- Market conditions: 74 active listings in the ZIP; 4 comparable units currently listed for rent nearby; rentals leasing fast (median 12d on market — plan ~1-2 weeks tenant-placement turnaround); 323 units permitted in Fayette County in 2024 (0 in 5+ unit buildings).
Forward outlook
- Local home prices are declining (-3.0%/yr); year-one equity from $3k of loan paydown is wiped out by about $15k of value loss. Plan a longer hold.
- Fayette County population projected at +13% by 2050 — modest demand growth; plan on rents tracking national, not racing it.
Negotiation context
- It's been on market 111 days — a 9% lower offer ($455k) is reasonable based on typical stale-listing flexibility.
- 6 sale attempts since 11y ago; this cycle's ask has dropped $30k (6%) from the opening price — seller is motivated, your offer sets the floor, not the list.
- Current owner paid $308k; list at $500k implies a 63% gain — meaningful room to come down on a strong offer.
Risks & watch-outs
- Climate carrying-cost: major wind risk, 27% chance of damaging wind over 30y; extreme-heat days projected 7→19/yr by 2055 (HVAC capex compounding) — expect insurance premiums to compound above CPI over the hold.
Questions for the listing agent
- It's been on market 111 days. Have you received any prior offers? Is the seller open to a 10% concession, seller financing, or rate buy-down credit?
- What does the HOA fee cover, when was the last increase, and are there any pending special assessments or reserve-fund shortfalls?
- Why hasn't it sold? Are there any deal-killer items the seller is aware of (foundation, flood, title, zoning, code violations)?
- Is there a deadline driving the sale (1031 exchange, divorce, estate, relocation)? That informs how much negotiation room exists.
- Schools are B-rated — typically a magnet for longer-tenancy family renters. What's the average tenant stay here, and is there a school-zone premium baked into asking?
- What's the average days-on-market for RENTAL listings here right now (not sales)? A rising rental-DOM trend means longer vacancies and softer asking-rent achievability than the comps imply.
- What's the recent tenant-quality profile in this submarket — average credit score on applications, eviction rate, late-payment / NSF rate, and stable-employment percentage? A property-management company in the area should have these aggregated.
- How much new for-sale + rental construction is in the pipeline within 1–3 miles? Heavy new supply typically softens prices + rents 12–24 months out; constrained supply supports both.
Investment metrics
- 1% rule
- 0.90% ✗
- Cap rate
- 7.35%
- Cash-on-cash
- 3.79%
- DSCR
- 1.17
- GRM
- 9.2
CMA / ARV
- ARV (on-the-fly)
- $566,979
- Comps found
- 8
Show comp detail 8 sales within ~0.75 mi
| Address | Dist | Beds/Ba | Sqft | Sold | Price | $/sf | Match |
|---|---|---|---|---|---|---|---|
| 388 Swanson Rd | 0.50mi | 4/2.5 | 2,772 (-1%) | 1mo | $625,000 | $225 | 68 |
| 170 Brennan Dr | 0.18mi | 4/2.5 | 2,468 (-12%) | 2mo | $500,000 | $203 | 64 |
| 270 Pendleton Trl | 0.21mi | 4/2.5 | 2,946 (+6%) | 16mo | $533,000 | $181 | 62 |
| 445 Pendleton Trl | 0.13mi | 3/2.0 (-1) | 2,733 (-2%) | 19mo | $439,900 | $161 | 62 |
| 100 Kindlehurst Dr | 0.38mi | 4/3.0 | 2,432 (-13%) | 16mo | $488,500 | $201 | 43 |
| 355 Farr Rd | 0.62mi | 3/2.5 (-1) | 2,803 (+0%) | 23mo | $738,500 | $263 | 40 |
| 195 Berry Hill Ln | 0.59mi | 4/3.5 | 3,204 (+15%) | 10mo | $675,000 | $211 | 38 |
| 310 Millbrook Village Dr | 0.73mi | 4/2.5 | 2,520 (-10%) | 18mo | $378,575 | $150 | 29 |
Match score weights: distance 35% · size 25% · config 20% · recency 20%. Top-matched comps best support the ARV.
Projected returns pro-forma
-3.0% appreciation · 3.0% rent growth · sell at horizon
- IRR
- -10.4%
- Equity multiple
- 0.62×
- Total profit
- $-52,968
- Equity at exit
- $74,537
- IRR
- -1.1%
- Equity multiple
- 0.93×
- Total profit
- $-10,388
- Equity at exit
- $43,222
Cash invested: $139,972 (down + closing). Projections, not guarantees.
Landlord ↔ Tenant lean methodology
- Overall (STATE)
- 90 Strongly Landlord-Friendly
- State Georgia
- 90 Strongly Landlord-Friendly · R+3
- County
- — inherits STATE
- City
- — inherits STATE
ZIP-level market 30290
- Home prices YoY
- -25.8%
- Active inventory
- 74
- Price-to-rent
- 9.2×
Monthly cashflow live
- Estimated rent
- $4,521 medium interval (Pro) →
- Mortgage (P&I)
- −$2,622
- Tax from tax record
- −$238 /mo · $2,858/yr
- Insurance
- −$208
- HOA
- −$61
- Vacancy / Maint / Mgmt
- −$949
- Net cashflow
- $442
Break-even live
Sensitivity live
| Price | -10% $725 | -5% $584 | +0% $442 | +5% $301 | +10% $159 |
|---|---|---|---|---|---|
| Rent | -10% $85 | -5% $264 | +0% $442 | +5% $621 | +10% $799 |
| Rate | -1.0pp $694 | -0.5pp $569 | base $442 | +0.5pp $313 | +1.0pp $181 |
UW: 25.0% down · 7.5% · 30yr · 1.5% tax · 5.0% vac · 8.0% maint · 8.0% mgmt
Financing live
Cash to close
- Down payment
- $124,975
- Closing costs
- $14,997
- Reserves months
- —
- Total cash needed
- —
Loan-product check · same deal, 3 products live
Conventional
25% down · 7.5% · 30yr
- Down + closing
- —
- Monthly P&I
- —
- Monthly cashflow
- —
- DSCR
- —
- Eligible?
- —
Personal DTI + credit; lowest rate.
DSCR
20% down · 8.5% · 30yr
- Down + closing
- —
- Monthly P&I
- —
- Monthly cashflow
- —
- DSCR
- —
- Eligible?
- —
No personal income docs; deal must DSCR.
Hard money
10% down · 12.0% · 12mo
- Down + closing
- —
- Monthly P&I
- —
- Monthly cashflow
- —
- DSCR
- —
- Eligible?
- —
Short-term bridge; refi at stabilization.
Rent comps 4 comps
| Address | Beds | Baths | Sqft | Rent | $/sqft | DOM | Units | Dist |
|---|---|---|---|---|---|---|---|---|
| 115 Sutton Ct Tyrone, GA | 5.0 | 4.0 | 2695 | $3,850 | $1.43 | 5d | 1 | 1.04mi |
| 135 Farr Lake Dr Tyrone, GA | 4.0 | 3.0 | 2683 | $7,500 | $2.80 | 45d | 1 | 1.13mi |
| 205 Valley View Dr Tyrone, GA | 4.0 | 2.5 | 2535 | $2,995 | $1.18 | 0d | 1 | 1.45mi |
| 205 Valley View Dr Tyrone, GA | 4.0 | 2.5 | 2535 | $2,995 | $1.18 | 12d | 1 | 1.45mi |
HOA detail
- Monthly dues
- $61 · $732/yr
Listing history 24 events
-
2026-02-24status Under Contract
-
2026-02-04price $499,900
-
2025-12-06price $519,900
-
2025-11-05$529,900 New
-
2025-07-31historical
-
2025-01-04price $539,900
-
2024-12-23$549,900 New
-
2024-12-17historical
-
2024-10-17$549,900 New
-
2018-06-07soldstatus $307,500
-
2018-06-04soldstatus $307,500 Sold
-
2018-04-18status Under Contract
-
2018-01-22historical
-
2018-01-21$315,000 New
-
2017-12-05$329,900 New
-
2015-09-16price $272,000
-
2015-09-09soldstatus $272,100
-
2015-09-01soldstatus $272,000 Sold
-
2015-06-12status Under Contract
-
2015-06-12price $299,900
-
2015-04-03$299,900 New
-
1999-08-03soldstatus $236,000
-
1999-07-28soldstatus $236,000
-
1995-01-31soldstatus $37,500
ⓘ Source: listings_history table (triggers on properties + properties_extension) + one-shot
backfill from property_details.listing_events for pre-trigger history.
Tax reassessment forecast GA · Resets to sale price
- Current annual tax
- $2,858 · $238/mo
- Projected year-2 tax
- $4,599 · $383/mo
- Expected delta
- +$1,741/yr (+$145/mo · 60.9%)
ⓘ Screening estimate from a state-policy table — verify with the county assessor before closing.
Climate risk First Street
- Flood 1/10 Low FEMA zone X (unshaded) · 0% chance over 30 yrs
- Wildfire 4/10 Moderate
- Heat 5/10 Major 7 d/yr ≥104°F today · 19 d/yr by 30 yrs out
- Wind 6/10 Major 27% chance of damaging wind over 30 yrs
- Air quality 3/10 Moderate 4 unhealthy d/yr today · 4 by 30 yrs out
Nearby sold comps map
Loading sold comps map…
Walkable amenities ~0.75 mi
Loading nearby amenities…
Taxation est. · year 1
- Rental income
- $54,247
- − Mortgage interest
- −$28,002
- − Property taxes
- −$2,858
- − Insurance
- −$2,500
- − Repairs & maintenance
- −$4,340
- − Management
- −$4,340
- − HOA
- −$732
- − Depreciation
- −$14,543
- Taxable loss
- −$3,067
- Est. tax savings @ 24.0%
- +$736
- After-tax cash flow
- $6,043/yr
For passive investors: Depreciation is non-cash, so a rental often shows a tax loss while cash-flowing — sheltering income. Rental losses are passive: they offset passive income freely, and up to $25,000/yr can offset ordinary (W-2) income if you actively participate and your MAGI is under $100k (phasing out to $0 by $150k); unused losses carry forward. On sale, claimed depreciation is recaptured at up to 25%, and gains may owe capital-gains tax (a 1031 exchange can defer both). Figures are a year-1 estimate at your 24.0% rate — not tax advice; consult a CPA.
Schools (NCES district)
- District
- Fayette County
- NCES district ID
- 1302130
- Math proficiency
- 52% ▼ -12.00%
- Reading proficiency
- 60% ▼ -7.00%
- Median HH income
- $80,746
- Composite
- 50.67/100
- National rank
- #1824
- State rank
- #7 of 174 in GA
Livability — Tyrone
- Score
- 79/100
- State rank
- #13
- US rank
- #2017
Category grades
Schools grade is shown separately in the Schools card above.
Census & demographics
- Census place
- Tyrone, GA
- City population
- 9,083
- Population (ZIP)
- 9,083
Population outlook (Fayette County) Hauer SSP2
- Today (2025)
- 120,914 people
- By 2030
- 125,439 · +3.7%
- By 2040
- 132,378 · +9.5%
- By 2050
- 137,123 · +13.4%
- By 2075
- 156,091 · +29.1%
- By 2100
- 163,102 · +34.9%
Race, ethnicity, and origin ACS 2023
- Neighborhood character
- Diverse neighborhood (Simpson 0.59)
- Race & ethnicity
- White 57% Black 28% Two or more races 7% Hispanic / Latino 6% Asian 3%
- Hispanic origin (detail)
- Mexican 1% Dominican 2%
- Common ancestry
- Italian 2% Portuguese 2% Slovak 2%
- Foreign-born
- 8% · Canada, Vietnam, Mexico
- Languages at home
- 91% English-only · Spanish 5% Other Asian/Pacific 2% Vietnamese 1%
Political lean MEDSL · Fayette
- 2024 margin
- Toss-up / Even · D 48.0% · R 51.1%
- 2008→2024 swing
- +27.5pp toward D · 2008: -30.7pp · 2024: -3.1pp
- All cycles
- 2024: R+3.1 2020: R+6.8 2016: R+19.5 2012: R+31.4 2008: R+30.7
Not yet ingested
- Civics
- —
Market trends
- HPI YoY
- ▼ -84.69%
- Current HPI
- 243.293
- Rent YoY
- —
- Metro
- —
- State GDP YoY
- ▲ 2.66%
- F500 in state
- 28
Industry mix (Fortune 500 HQ in GA)
| Industry | F500 HQs | Revenue |
|---|---|---|
| Paper / Packaging | 2 | $29B |
|
||
| Retail | 1 | $160B |
|
||
| Transportation / Logistics | 1 | $91B |
|
||
| Airlines | 1 | $62B |
|
||
| Consumer Goods | 1 | $47B |
|
||
| Utilities | 1 | $25B |
|
||
Price history
+1233.1% since first listed24 events — show timeline
- 2026-02-24 Pending — GAMLS
- 2026-02-04 Price Changed $499,900 GAMLS
- 2025-12-06 Price Changed $519,900 GAMLS
- 2025-11-05 Listed $529,900 GAMLS
- 2025-07-31 Listing Removed — GAMLS
- 2025-01-04 Price Changed $539,900 GAMLS
- 2024-12-23 Listed $549,900 GAMLS
- 2024-12-17 Listing Removed — GAMLS
- 2024-10-17 Listed $549,900 GAMLS
- 2018-06-07 Sold (Public Records) $307,500 Public Records
- 2018-06-04 Sold (MLS) $307,500 GAMLS
- 2018-04-18 Pending — GAMLS
- 2018-01-22 Listing Removed — GAMLS
- 2018-01-21 Listed $315,000 GAMLS
- 2017-12-05 Listed $329,900 GAMLS
- 2015-09-16 Price Changed $272,000 GAMLS
- 2015-09-09 Sold (Public Records) $272,100 Public Records
- 2015-09-01 Sold (MLS) $272,000 GAMLS
- 2015-06-12 Pending — GAMLS
- 2015-06-12 Price Changed $299,900 GAMLS
- 2015-04-03 Listed $299,900 GAMLS
- 1999-08-03 Sold (Public Records) $236,000 Public Records
- 1999-07-28 Sold (Public Records) $236,000 Public Records
- 1995-01-31 Sold (Public Records) $37,500 Public Records
Property tax history
-1.8%/yrLatest (2025): $2,858 · -0.2% YoY. Source: county tax records.
Cash-flow waterfall
monthlySold comps — $/sqft
last 12 mo · ≤1 miLoading sold comps…