10401 Desavado Rd · Hornbrook, CA
Flood risk 1/10 · Minimal
- FEMA flood zone
- X (unshaded)
- Chance of flooding over 30 yrs
- 0.0%
- Est. flood insurance / yr
- $507 – $1,088
Fire risk 8/10 · Major
- Est. fire insurance / yr
- $659 – $1,223
Heat risk 6/10 · Moderate
- Hot days now (above 93°F)
- 7 days/yr
- Hot days in 30 yrs
- 15 days/yr
Wind risk 1/10 · Minimal
- Chance of severe wind over 30 yrs
- —
Air-quality risk 10/10 · Severe
- Unhealthy air days now
- 34 days/yr
- Unhealthy air days in 30 yrs
- 34 days/yr
Risk factors via First Street. Map © Google.
Why this score? — see what drove the B+ grade
The composite is a weighted blend of 9 inputs, each scored 0–100. Each bar is that input's sub-score; the figure is the points it added to the 100-point composite (weight × sub-score).
- Cash flow +30.0/30.0
- ARV discount +15.0/15.0
- 1% rule +10.0/10.0
- DSCR +10.0/10.0
- Schools +3.9/10.0
- Rent growth +2.5/5.0
- Condition / age +2.5/5.0
- Livability +2.4/5.0
- Appreciation +0.0/10.0
$75,000
🖨 Deal sheet 📄 Offer letter ✓ Due diligence
Listing remarks
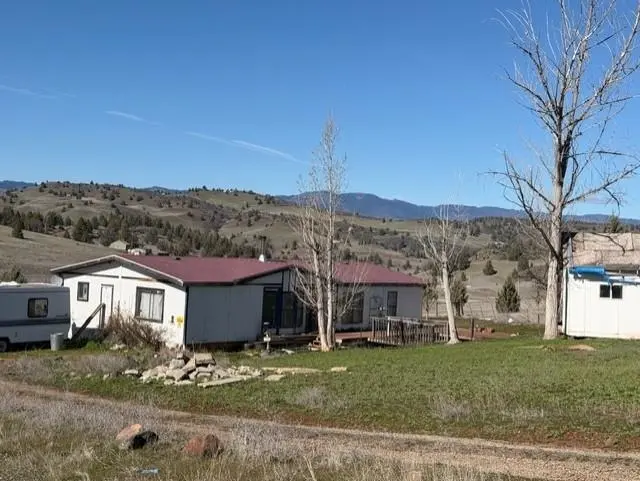
For the buyer with vision, grit, and a love for wide-open space — this 3 bed, 2 bath home sits on 3.4 acres of pure potential, framed by sweeping views that stretch for miles. Yes, it needs work. A lot of work. The home is in disrepair & the land has collected a lifetime’s worth of cars, trailers, and debris. But beneath the clutter is a rare opportunity: acreage, privacy & a setting that feels like stepping into your own rustic frontier. The property has a well & septic system—both in need of attention—yet offering the essential infrastructure for someone ready to restore & reimagine. The land itself is a canvas: rugged, raw, and ready for so
Key facts
- Long-range vistas
- Sweeping views
- Acreage privacy
Tags
Property features AI
Finance
- Other: Horses allowed; Gravel road access; Zoning: RRB
Exterior
- Utilities: Private well water; Septic tank
- Home design: Manufactured home (single-story)
- Construction: Wood siding; Composition roof
- Exterior features: Garden; Deck; Shed(s); Sloped lot; Flag lot
Interior
- Flooring: Vinyl
- Heating & cooling: Wood stove heating
- Interior features: Vinyl flooring; Living room fireplace (1)
Neighborhood map
What this means for you Summary
Snapshot
- This is a 3-bed/2.0-bath manufactured listed at $75k.
Deal economics
- At list price, monthly cash flow is $626 ($8k/yr) — positive.
- The deal already cash-flows at list — no discount required.
- Meets the 1% rule at list price ($1k rent vs $75k).
- Recommended offer: $74k (1.5% below list) — sets the bar for market timing.
Location & tenants
- Location reads 47/100 on livability (#1,256 in CA) — a working-class tenant base; expect higher turnover. Strengths: crime A; Watch: schools F, amenities F, commute F.
- Yreka Union High (town): math 25% / reading 65% proficiency, ranked #630 of 1,400 in CA (top 45%) — families likely to look elsewhere, expect single-tenant / working-renter base with shorter leases.
- Market conditions: 136 active listings in the ZIP; 50 units permitted in Siskiyou County in 2024 (0 in 5+ unit buildings).
Forward outlook
- Local home prices are declining (-3.0%/yr); year-one equity from $519 of loan paydown is wiped out by about $2k of value loss. Plan a longer hold.
- Siskiyou County population projected at -26% by 2050 — secular population decline; favor cash flow + early exit over multi-decade hold.
- At projected returns (-3.0% appreciation + 3.0% rent growth), your $21k cash investment doubles in ~4 years — after that, you're playing with house money.
Negotiation context
- It's been on market 29 days — a 2% lower offer ($74k) is reasonable based on typical stale-listing flexibility.
Risks & watch-outs
- Climate carrying-cost: severe wildfire risk; extreme-heat days projected 7→15/yr by 2055 (HVAC capex compounding) — expect insurance premiums to compound above CPI over the hold.
Questions for the listing agent
- Is there a deadline driving the sale (1031 exchange, divorce, estate, relocation)? That informs how much negotiation room exists.
- Schools are F-rated, which usually means shorter tenancies and higher turnover. Who's the typical renter profile here, and what's been the actual vacancy rate?
- What's the average days-on-market for RENTAL listings here right now (not sales)? A rising rental-DOM trend means longer vacancies and softer asking-rent achievability than the comps imply.
- What's the recent tenant-quality profile in this submarket — average credit score on applications, eviction rate, late-payment / NSF rate, and stable-employment percentage? A property-management company in the area should have these aggregated.
- How much new for-sale + rental construction is in the pipeline within 1–3 miles? Heavy new supply typically softens prices + rents 12–24 months out; constrained supply supports both.
Investment metrics
- 1% rule
- 1.90% ✓
- Cap rate
- 16.31%
- Cash-on-cash
- 35.78%
- DSCR
- 2.59
- GRM
- 4.4
CMA / ARV
- ARV (on-the-fly)
- $98,784
- Comps found
- 1
Show comp detail 1 sale within ~0.75 mi
| Address | Dist | Beds/Ba | Sqft | Sold | Price | $/sf | Match |
|---|---|---|---|---|---|---|---|
| 7309 Ager Beswick Rd | 0.47mi | 2/2.0 (-1) | 1,440 (-8%) | 22mo | $90,000 | $63 | 41 |
Match score weights: distance 35% · size 25% · config 20% · recency 20%. Top-matched comps best support the ARV.
Projected returns pro-forma
-3.0% appreciation · 3.0% rent growth · sell at horizon
- IRR
- 31.5%
- Equity multiple
- 2.32×
- Total profit
- $27,738
- Equity at exit
- $11,183
- IRR
- 38.6%
- Equity multiple
- 4.60×
- Total profit
- $75,550
- Equity at exit
- $6,485
Cash invested: $21,000 (down + closing). Projections, not guarantees.
Landlord ↔ Tenant lean methodology
- Overall (STATE)
- 18 Strongly Tenant-Friendly
- State California
- 18 Strongly Tenant-Friendly · D+13
- County
- — inherits STATE
- City
- — inherits STATE
ZIP-level market 96064
- Active inventory
- 136
- Price-to-rent
- 4.4×
Monthly cashflow live
- Estimated rent
- $1,427 medium interval (Pro) →
- Mortgage (P&I)
- −$393
- Tax from tax record
- −$76 /mo · $918/yr
- Insurance
- −$31
- HOA
- −$0
- Vacancy / Maint / Mgmt
- −$300
- Net cashflow
- $626
Break-even live
UW: 25.0% down · 7.5% · 30yr · 1.5% tax · 5.0% vac · 8.0% maint · 8.0% mgmt
Financing live
Cash to close
- Down payment
- $18,750
- Closing costs
- $2,250
- Reserves months
- —
- Total cash needed
- —
Loan-product check · same deal, 3 products live
Conventional
25% down · 7.5% · 30yr
- Down + closing
- —
- Monthly P&I
- —
- Monthly cashflow
- —
- DSCR
- —
- Eligible?
- —
Personal DTI + credit; lowest rate.
DSCR
20% down · 8.5% · 30yr
- Down + closing
- —
- Monthly P&I
- —
- Monthly cashflow
- —
- DSCR
- —
- Eligible?
- —
No personal income docs; deal must DSCR.
Hard money
10% down · 12.0% · 12mo
- Down + closing
- —
- Monthly P&I
- —
- Monthly cashflow
- —
- DSCR
- —
- Eligible?
- —
Short-term bridge; refi at stabilization.
Listing history 17 events
-
2026-06-19days on market $75,000 Active 29 DOM
-
2026-06-18days on market $75,000 Active 28 DOM
-
2026-06-17days on market $75,000 Active 27 DOM
-
2026-06-16days on market $75,000 Active 26 DOM
-
2026-06-15days on market $75,000 Active 25 DOM
-
2026-06-14days on market $75,000 Active 23 DOM
-
2026-06-12days on market $75,000 Active 22 DOM
-
2026-06-09days on market $75,000 Active 19 DOM
-
2026-06-08days on market $75,000 Active 18 DOM
-
2026-06-07days on market $75,000 Active 17 DOM
-
2026-06-05days on market $75,000 Active 15 DOM
-
2026-06-04days on market $75,000 Active 13 DOM
-
2026-06-02days on market $75,000 Active 12 DOM
-
2026-06-01days on market $75,000 Active 11 DOM
-
2026-05-31days on market $75,000 Active 10 DOM
-
2026-05-31days on market $75,000 Active 9 DOM
-
2026-05-21$75,000 Active
ⓘ Source: listings_history table (triggers on properties + properties_extension) + one-shot
backfill from property_details.listing_events for pre-trigger history.
Tax reassessment forecast CA · Resets to sale price
- Current annual tax
- $918 · $76/mo
- Projected year-2 tax
- $918 · $76/mo
- Expected delta
- $0/yr ($0/mo · 0.0%)
ⓘ Screening estimate from a state-policy table — verify with the county assessor before closing.
Climate risk First Street
- Flood 1/10 Low FEMA zone X (unshaded) · 0% chance over 30 yrs
- Wildfire 8/10 Severe
- Heat 6/10 Major 7 d/yr ≥93°F today · 15 d/yr by 30 yrs out
- Wind 1/10 Low
- Air quality 10/10 Extreme 34 unhealthy d/yr today · 34 by 30 yrs out
Nearby sold comps map
Loading sold comps map…
Walkable amenities ~0.75 mi
Loading nearby amenities…
Taxation est. · year 1
- Rental income
- $17,122
- − Mortgage interest
- −$4,201
- − Property taxes
- −$918
- − Insurance
- −$375
- − Repairs & maintenance
- −$1,370
- − Management
- −$1,370
- − Depreciation
- −$2,182
- Taxable income
- $6,707
- Est. tax owed @ 24.0%
- −$1,610
- After-tax cash flow
- $5,904/yr
For passive investors: Depreciation is non-cash, so a rental often shows a tax loss while cash-flowing — sheltering income. Rental losses are passive: they offset passive income freely, and up to $25,000/yr can offset ordinary (W-2) income if you actively participate and your MAGI is under $100k (phasing out to $0 by $150k); unused losses carry forward. On sale, claimed depreciation is recaptured at up to 25%, and gains may owe capital-gains tax (a 1031 exchange can defer both). Figures are a year-1 estimate at your 24.0% rate — not tax advice; consult a CPA.
Schools (NCES district)
- District
- Yreka Union High
- NCES district ID
- 0643410
- Math proficiency
- 25% ▼ -15.00%
- Reading proficiency
- 65% ▬ 0.00%
- Median HH income
- $34,206
- Composite
- 39.28/100
- National rank
- #8184
- State rank
- #630 of 1400 in CA
Livability — Hornbrook
- Score
- 47/100
- State rank
- #1256
- US rank
- #26373
Category grades
Schools grade is shown separately in the Schools card above.
Census & demographics
- Population (ZIP)
- 4,696
Population outlook (Siskiyou County) Hauer SSP2
- Today (2025)
- 39,337 people
- By 2030
- 36,930 · -6.1%
- By 2040
- 32,367 · -17.7%
- By 2050
- 29,030 · -26.2%
- By 2075
- 23,534 · -40.2%
- By 2100
- 19,312 · -50.9%
Race, ethnicity, and origin ACS 2023
- Neighborhood character
- Predominantly White (74%)
- Race & ethnicity
- White 74% Two or more races 11% Hispanic / Latino 10% Native American 4% Black 2% Asian 1%
- Hispanic origin (detail)
- Mexican 8%
- Common ancestry
- Slovak 4% Russian 3% Iranian 2%
- Foreign-born
- 4% · Canada, Vietnam
- Languages at home
- 92% English-only · Spanish 4% German/W. Germanic 1% Other Asian/Pacific 1%
Political lean MEDSL · Siskiyou
- 2024 margin
- R (+19.2) · D 38.8% · R 58.0% · Other 3.2%
- 2008→2024 swing
- -8.8pp toward R · 2008: -10.4pp · 2024: -19.2pp
- All cycles
- 2024: R+19.2 2020: R+15.8 2016: R+20.7 2012: R+15.6 2008: R+10.4
Not yet ingested
- Civics
- —
Market trends
- HPI YoY
- ▼ -107.26%
- Current HPI
- 140.7129
- Rent YoY
- —
- Metro
- —
- State GDP YoY
- ▲ 3.21%
- F500 in state
- 116
Industry mix (Fortune 500 HQ in CA)
| Industry | F500 HQs | Revenue |
|---|---|---|
| Technology | 27 | $1,492B |
|
||
| Financial Services | 3 | $174B |
|
||
| Retail | 3 | $44B |
|
||
| Insurance | 3 | $26B |
|
||
| Media / Entertainment | 2 | $115B |
|
||
| Pharmaceuticals / Biotech | 2 | $62B |
|
||
Price history
1 event — show timeline
- 2026-05-21 Listed $75,000 SMLS
Property tax history
+3.1%/yrLatest (2025): $918 · -5.7% YoY. Source: county tax records.
Cash-flow waterfall
monthlySold comps — $/sqft
last 12 mo · ≤1 miLoading sold comps…