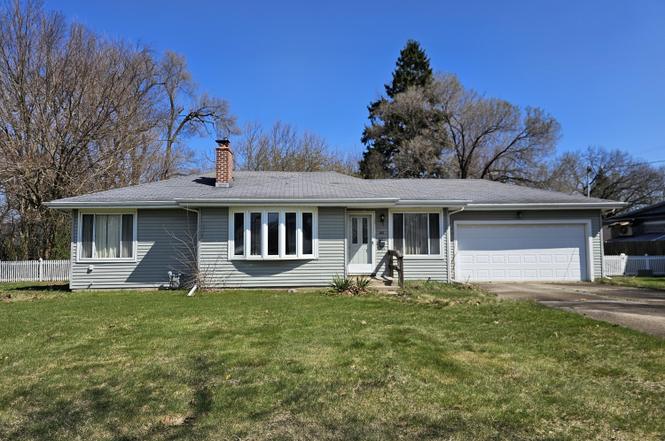
143 Laurel Dr · Battle Creek, MI
Flood risk 1/10 · Minimal
- FEMA flood zone
- X (unshaded)
- Chance of flooding over 30 yrs
- 0.0%
- Est. flood insurance / yr
- $473 – $860
Fire risk 1/10 · Minimal
- Est. fire insurance / yr
- $784 – $1,456
Heat risk 3/10 · Minor
- Hot days now (above 97°F)
- 7 days/yr
- Hot days in 30 yrs
- 16 days/yr
Wind risk 2/10 · Minimal
- Chance of severe wind over 30 yrs
- —
Air-quality risk 3/10 · Minor
- Unhealthy air days now
- 2 days/yr
- Unhealthy air days in 30 yrs
- 3 days/yr
Risk factors via First Street. Map © Google.
Why this score? — see what drove the F grade
The composite is a weighted blend of 9 inputs, each scored 0–100. Each bar is that input's sub-score; the figure is the points it added to the 100-point composite (weight × sub-score).
- Cash flow +8.7/30.0
- Livability +3.7/5.0
- 1% rule +3.1/10.0
- Rent growth +2.5/5.0
- Condition / age +2.5/5.0
- DSCR +2.4/10.0
- Schools +1.1/10.0
- ARV discount +0.0/15.0
- Appreciation +0.0/10.0
$135,000
🖨 Deal sheet (PDF) 📄 Offer letter ✓ Due diligence
Listing remarks MLS
ATTENTION INVESTORS!! Looking for a home to RENOVATE & MAKE YOUR OWN or to FIX & FLIP? If you're ready to roll up your sleeves for sweat equity you can have an excellent return on your investment. This home already has large replacement windows, a newer hot water heater, high efficiency furnace, and central air installed. It has a woodburning fireplace in a large living room, tons of Storage Space, an Eat-In-Kitchen with a Fabulous Copper Hood, a finished basement with a 3rd Bedroom and a 2nd Full Bathroom with Laundry. A 2-Car Attached Garage that keeps the car protected from the elements. Enjoy outdoors with a attached 3-Seasons Porch and a Patio, in the Landscaped, Fenced in Backyard, all with a Garden Shed to Store the outdoor tools. This home needs a new roof, basement drywall repair from a previous leak, and updates throughout. Home is is being SOLD-AS-IS. Come see this SLEEPING BEAUTY that is waiting for the next owner to give her some tender love and care.
Key facts
- Eat-in-kitchen
- Hot water heater
- Central air
Tags
Property features AI
Exterior
- Parking: Attached 2-car garage
- Utilities: Public water; Natural gas connected; Natural gas water heater
- Home design: Ranch-style single family home; Built in 1947
- Construction: Vinyl siding; Shingle roof; Full basement
- Exterior features: Paved road access; Shed(s)
Interior
- Kitchen: Dishwasher; Microwave; Eat-in kitchen with pantry
- Bedrooms: Primary bedroom; Bedroom 2; Bedroom 3
- Bathrooms: 2 full bathrooms
- Heating & cooling: Forced air heating; Central cooling
- Interior features: Garage door opener; Eat-in kitchen; Pantry; Wood-burning fireplace; Replacement windows with screens
- Laundry & utility: Washer; Dryer; Laundry room (10.1 x 11.2); Utility room
Neighborhood map
What this means for you Summary
Snapshot
- This is a 2-bed/2.0-bath single-family listed at $135k.
Deal economics
- At list price, monthly cash flow is $-113 ($-1k/yr) — negative.
- To cash-flow at today's rent, offer at most $115k (14.7% below list).
- To meet the 1% rule (rent ≥ 1% of price), the offer needs to be $109k (19.2% below list).
- Recommended offer: $109k (19.2% below list) — sets the bar for 1% rule.
Location & tenants
- Location reads 73/100 on livability (#198 in MI) — a middle-class / working-renter tenant base. Strengths: cost of living A+, housing A+, health & safety A+; Watch: schools C-, amenities C-, crime F.
- Battle Creek Public Schools (urban): math 8% / reading 19% proficiency, ranked #510 of 540 in MI (top 94%) — low school quality limits family demand, transient renter base, plan for 1-2y turnover; 75% free/reduced lunch — lower-income household profile, screen leases tightly.
- Market conditions: 155 active listings in the ZIP; 6 comparable units currently listed for rent nearby; rentals lingering (median 45d on market — plan ~5-8 weeks vacancy on turnover, expect pricing pressure); 83% of comp listings sitting > 30 days — soft ceiling on asking rent; 132 units permitted in Calhoun County in 2024 (0 in 5+ unit buildings).
Forward outlook
- Local home prices are declining (-3.0%/yr); year-one equity from $933 of loan paydown is wiped out by about $4k of value loss. Plan a longer hold.
- Calhoun County population projected at -16% by 2050 — secular population decline; favor cash flow + early exit over multi-decade hold.
Negotiation context
- Only 6 days on market — expect competitive offers; lowballing is unlikely to land.
- 3 sale attempts with the ask held roughly flat each time — persistent listings suggest the price (not the market) is what's stuck; bring a comps-based counter.
Risks & watch-outs
- Watch-outs: built in 1947 — expect roof / HVAC / electrical / plumbing capex.
Questions for the listing agent
- What do current leases actually rent for vs. the listed asking? Can we see a recent rent roll and the last 12 months of T-12 income?
- Built in 1947 — when were the roof, HVAC, electrical panel, plumbing, and water heater last replaced?
- Is there a deadline driving the sale (1031 exchange, divorce, estate, relocation)? That informs how much negotiation room exists.
- Crime grade is F in this area — have there been break-ins, vandalism, or insurance claims at this property in the last 3 years? What carrier currently insures it and at what premium?
- The area grade is low — what's the realistic commute time and amenity access for the typical tenant pool here? Any planned neighborhood developments (good or bad) we should know about?
- What's the average days-on-market for RENTAL listings here right now (not sales)? A rising rental-DOM trend means longer vacancies and softer asking-rent achievability than the comps imply.
- What's the recent tenant-quality profile in this submarket — average credit score on applications, eviction rate, late-payment / NSF rate, and stable-employment percentage? A property-management company in the area should have these aggregated.
- How much new for-sale + rental construction is in the pipeline within 1–3 miles? Heavy new supply typically softens prices + rents 12–24 months out; constrained supply supports both.
Investment metrics
- 1% rule
- 0.81% ✗
- Cap rate
- 5.29%
- Cash-on-cash
- -3.57%
- DSCR
- 0.84
- GRM
- 10.3
CMA / ARV
- ARV (on-the-fly)
- $112,860
- Comps found
- 12
Show comp detail 12 sales within ~0.75 mi
| Address | Dist | Beds/Ba | Sqft | Sold | Price | $/sf | Match |
|---|---|---|---|---|---|---|---|
| 54 Maple Ter | 0.53mi | 2/1.0 | 1,000 (+1%) | 2mo | $139,000 | $139 | 68 |
| 31 Oxford St | 0.57mi | 2/1.0 | 996 (+1%) | 2mo | $105,000 | $105 | 67 |
| 207 Laurel Dr | 0.13mi | 2/1.0 | 890 (-10%) | 10mo | $103,000 | $116 | 65 |
| 246 Laurel Dr | 0.22mi | 3/1.0 (+1) | 1,089 (+10%) | 3mo | $179,000 | $164 | 62 |
| 102 Yale St | 0.45mi | 2/1.0 | 874 (-12%) | 3mo | $100,000 | $114 | 53 |
| 58 E Emmett St | 0.58mi | 2/1.0 | 951 (-4%) | 12mo | $168,000 | $177 | 53 |
| 30 East Ave N | 0.59mi | 3/1.0 (+1) | 1,054 (+6%) | 3mo | $89,900 | $85 | 50 |
| 50 Montford St | 0.59mi | 3/1.0 (+1) | 936 (-6%) | 9mo | $70,000 | $75 | 47 |
| 17 Wren St | 0.71mi | 3/1.0 (+1) | 1,035 (+4%) | 6mo | $98,000 | $95 | 46 |
| 21 Charlotte St | 0.56mi | 2/1.0 | 860 (-13%) | 5mo | $52,000 | $60 | 44 |
| 179 Bryant St | 0.56mi | 3/1.5 (+1) | 1,101 (+11%) | 8mo | $114,900 | $104 | 42 |
| 21 Wren St | 0.72mi | 3/1.5 (+1) | 1,090 (+10%) | 4mo | $134,000 | $123 | 39 |
Match score weights: distance 35% · size 25% · config 20% · recency 20%. Top-matched comps best support the ARV.
Projected returns pro-forma
-3.0% appreciation · 3.0% rent growth · sell at horizon
- IRR
- -22.3%
- Equity multiple
- 0.23×
- Total profit
- $-29,003
- Equity at exit
- $20,129
- IRR
- -16.2%
- Equity multiple
- 0.09×
- Total profit
- $-34,316
- Equity at exit
- $11,672
Cash invested: $37,800 (down + closing). Projections, not guarantees.
Landlord ↔ Tenant lean methodology
- Overall (STATE)
- 62 Landlord-Friendly
- State Michigan
- 62 Landlord-Friendly · EVEN
- County
- — inherits STATE
- City
- — inherits STATE
ZIP-level market 49017
- Home prices YoY
- -32.2%
- Active inventory
- 155
- Price-to-rent
- 10.3×
Monthly cashflow live
- Estimated rent
- $1,091 high interval (Pro) →
- Mortgage (P&I)
- −$708
- Tax from tax record
- −$211 /mo · $2,527/yr
- Insurance
- −$56
- HOA
- −$0
- Vacancy / Maint / Mgmt
- −$229
- Net cashflow
- $-113
Break-even live
Sensitivity live
| Price | -10% $-36 | -5% $-74 | +0% $-113 | +5% $-151 | +10% $-189 |
|---|---|---|---|---|---|
| Rent | -10% $-199 | -5% $-156 | +0% $-113 | +5% $-69 | +10% $-26 |
| Rate | -1.0pp $-45 | -0.5pp $-78 | base $-113 | +0.5pp $-148 | +1.0pp $-183 |
UW: 25.0% down · 7.5% · 30yr · 1.5% tax · 5.0% vac · 8.0% maint · 8.0% mgmt
Financing live
Cash to close
- Down payment
- $33,750
- Closing costs
- $4,050
- Reserves months
- —
- Total cash needed
- —
Loan-product check · same deal, 3 products live
Conventional
25% down · 7.5% · 30yr
- Down + closing
- —
- Monthly P&I
- —
- Monthly cashflow
- —
- DSCR
- —
- Eligible?
- —
Personal DTI + credit; lowest rate.
DSCR
20% down · 8.5% · 30yr
- Down + closing
- —
- Monthly P&I
- —
- Monthly cashflow
- —
- DSCR
- —
- Eligible?
- —
No personal income docs; deal must DSCR.
Hard money
10% down · 12.0% · 12mo
- Down + closing
- —
- Monthly P&I
- —
- Monthly cashflow
- —
- DSCR
- —
- Eligible?
- —
Short-term bridge; refi at stabilization.
Rent comps 6 comps
| Address | Beds | Baths | Sqft | Rent | $/sqft | DOM | Units | Dist |
|---|---|---|---|---|---|---|---|---|
| 138 Yale St Battle Creek, MI | 2.0 | 1.0 | 877 | $1,275 | $1.45 | 45d | 1 | 0.46mi |
| 775 Wagner Dr Battle Creek, MI | 1.0–2.0 | 1.0 | 772 | $1,085 | $1.40 | 45d | 6 | 0.74mi |
| 595 Wagner Dr Unit 22 Battle Creek, MI | 1.0 | 1.0 | 750 | $1,050 | $1.40 | 45d | 1 | 0.80mi |
| 54 Springview Dr Battle Creek, MI | 1.0–3.0 | 1.0–2.0 | 900 | $925 | $1.03 | 22d | 3 | 0.82mi |
| 115 West St Battle Creek, MI | 2.0–3.0 | 1.0–2.0 | 1090 | $1,350 | $1.24 | 45d | 3 | 0.94mi |
| 98 Van Buren St E Battle Creek, MI | 2.0 | 1.0 | 1118 | $950 | $0.85 | 45d | 1 | 1.05mi |
Listing history 6 events
-
2026-06-21days on market $135,000 Active 6 DOM
-
2026-06-19days on market $135,000 Active 4 DOM
-
2026-06-18days on market $135,000 Active 3 DOM
-
2026-06-17days on market $135,000 Active 2 DOM
-
2026-06-16remarks 691-char remark
Show marketing remark (992 chars)
ATTENTION INVESTORS!! Looking for a home to RENOVATE & MAKE YOUR OWN or to FIX & FLIP? If you're ready to roll up your sleeves for sweat equity you can have an excellent return on your investment. This home already has large replacement windows, a newer hot water heater, high efficiency furnace, and central air installed. It has a woodburning fireplace in a large living room, tons of Storage Space, an Eat-In-Kitchen with a Fabulous Copper Hood, a finished basement with a 3rd Bedroom and a 2nd Full Bathroom with Laundry. A 2-Car Attached Garage that keeps the car protected from the elements. Enjoy outdoors with a attached 3-Seasons Porch and a Patio, in the Landscaped, Fenced in Backyard, all with a Garden Shed to Store the outdoor tools. This home needs a new roof, basement drywall repair from a previous leak, and updates throughout. Home is is being SOLD-AS-IS. Come see this SLEEPING BEAUTY that is waiting for the next owner to give her some tender love and care.
-
2026-06-16$135,000 Active 1 DOM
Show marketing remark (992 chars)
ATTENTION INVESTORS!! Looking for a home to RENOVATE & MAKE YOUR OWN or to FIX & FLIP? If you're ready to roll up your sleeves for sweat equity you can have an excellent return on your investment. This home already has large replacement windows, a newer hot water heater, high efficiency furnace, and central air installed. It has a woodburning fireplace in a large living room, tons of Storage Space, an Eat-In-Kitchen with a Fabulous Copper Hood, a finished basement with a 3rd Bedroom and a 2nd Full Bathroom with Laundry. A 2-Car Attached Garage that keeps the car protected from the elements. Enjoy outdoors with a attached 3-Seasons Porch and a Patio, in the Landscaped, Fenced in Backyard, all with a Garden Shed to Store the outdoor tools. This home needs a new roof, basement drywall repair from a previous leak, and updates throughout. Home is is being SOLD-AS-IS. Come see this SLEEPING BEAUTY that is waiting for the next owner to give her some tender love and care.
ⓘ Source: listings_history table (triggers on properties + properties_extension) + one-shot
backfill from property_details.listing_events for pre-trigger history.
Tax reassessment forecast MI · Partial reset (capped growth)
- Current annual tax
- $2,527 · $211/mo
- Projected year-2 tax
- $2,527 · $211/mo
- Expected delta
- $0/yr ($0/mo · 0.0%)
ⓘ Screening estimate from a state-policy table — verify with the county assessor before closing.
Climate risk First Street
- Flood 1/10 Low FEMA zone X (unshaded) · 0% chance over 30 yrs
- Wildfire 1/10 Low
- Heat 3/10 Moderate 7 d/yr ≥97°F today · 16 d/yr by 30 yrs out
- Wind 2/10 Low
- Air quality 3/10 Moderate 2 unhealthy d/yr today · 3 by 30 yrs out
Nearby sold comps map
Loading sold comps map…
Walkable amenities ~0.75 mi
Loading nearby amenities…
Taxation est. · year 1
- Rental income
- $13,097
- − Mortgage interest
- −$7,562
- − Property taxes
- −$2,527
- − Insurance
- −$675
- − Repairs & maintenance
- −$1,048
- − Management
- −$1,048
- − Depreciation
- −$3,927
- Taxable loss
- −$3,690
- Est. tax savings @ 24.0%
- +$886
- After-tax cash flow
- $-465/yr
For passive investors: Depreciation is non-cash, so a rental often shows a tax loss while cash-flowing — sheltering income. Rental losses are passive: they offset passive income freely, and up to $25,000/yr can offset ordinary (W-2) income if you actively participate and your MAGI is under $100k (phasing out to $0 by $150k); unused losses carry forward. On sale, claimed depreciation is recaptured at up to 25%, and gains may owe capital-gains tax (a 1031 exchange can defer both). Figures are a year-1 estimate at your 24.0% rate — not tax advice; consult a CPA.
Schools (NCES district)
- District
- Battle Creek Public Schools
- NCES district ID
- 2600005
- Math proficiency
- 8% ▼ -2.00%
- Reading proficiency
- 19% ▬ 0.00%
- Median HH income
- $31,697
- Composite
- 10.73/100
- National rank
- #9769
- State rank
- #510 of 540 in MI
Livability — Battle Creek
- Score
- 73/100
- State rank
- #198
- US rank
- #5031
Category grades
Schools grade is shown separately in the Schools card above.
Census & demographics
- Census place
- Battle Creek, MI
- County
- Calhoun County · 91,590 people
- City population
- 91,590
- Metro
- Battle Creek, MI
- Population (ZIP)
- 21,295
- Household income
- $60,885
- Rent vs Own
- Severe rent burden
- 697.0
Population outlook (Calhoun County) Hauer SSP2
- Today (2025)
- 130,157 people
- By 2030
- 126,691 · -2.7%
- By 2040
- 118,517 · -8.9%
- By 2050
- 109,855 · -15.6%
- By 2075
- 90,486 · -30.5%
- By 2100
- 70,766 · -45.6%
Race, ethnicity, and origin ACS 2023
- Neighborhood character
- Predominantly White (78%)
- Race & ethnicity
- White 78% Black 9% Two or more races 8% Hispanic / Latino 6%
- Hispanic origin (detail)
- Mexican 4%
- Common ancestry
- Slovak 3% Iranian 3% Romanian 2%
- Foreign-born
- 3% · Canada, Philippines
- Languages at home
- 95% English-only · Spanish 2% Other Asian/Pacific 1% Arabic 1%
Political lean MEDSL · Calhoun
- 2024 margin
- R (+14.1) · D 42.3% · R 56.4% · Other 1.3%
- 2008→2024 swing
- -23.4pp toward R · 2008: 9.4pp · 2024: -14.1pp
- All cycles
- 2024: R+14.1 2020: R+11.1 2016: R+12.5 2012: D+1.6 2008: D+9.4
Not yet ingested
- Civics
- —
Market trends
- HPI YoY
- ▼ -115.68%
- Current HPI
- 243.5008
- Rent YoY
- —
- Metro
- Battle Creek, MI
- State GDP YoY
- ▲ 1.37%
- F500 in state
- 28
Industry mix (Fortune 500 HQ in MI)
| Industry | F500 HQs | Revenue |
|---|---|---|
| Automotive Parts | 3 | $48B |
|
||
| Automotive | 2 | $372B |
|
||
| Chemicals | 1 | $45B |
|
||
| Automotive Retail | 1 | $29B |
|
||
| Healthcare / Medical Devices | 1 | $23B |
|
||
| Automotive Technology | 1 | $20B |
|
||
Price history
+0.0% since first listed3 events — show timeline
- 2026-06-16 Listed $135,000 REALCOMP
- 2026-06-15 Listed $135,000 MiRealSource-MiMLS
- 2026-06-15 Listed $135,000 SW Michigan MLS
Property tax history
+4.1%/yrLatest (2025): $2,527 · -31.2% YoY. Source: county tax records.
Cash-flow waterfall
monthlySold comps — $/sqft
last 12 mo · ≤1 miLoading sold comps…