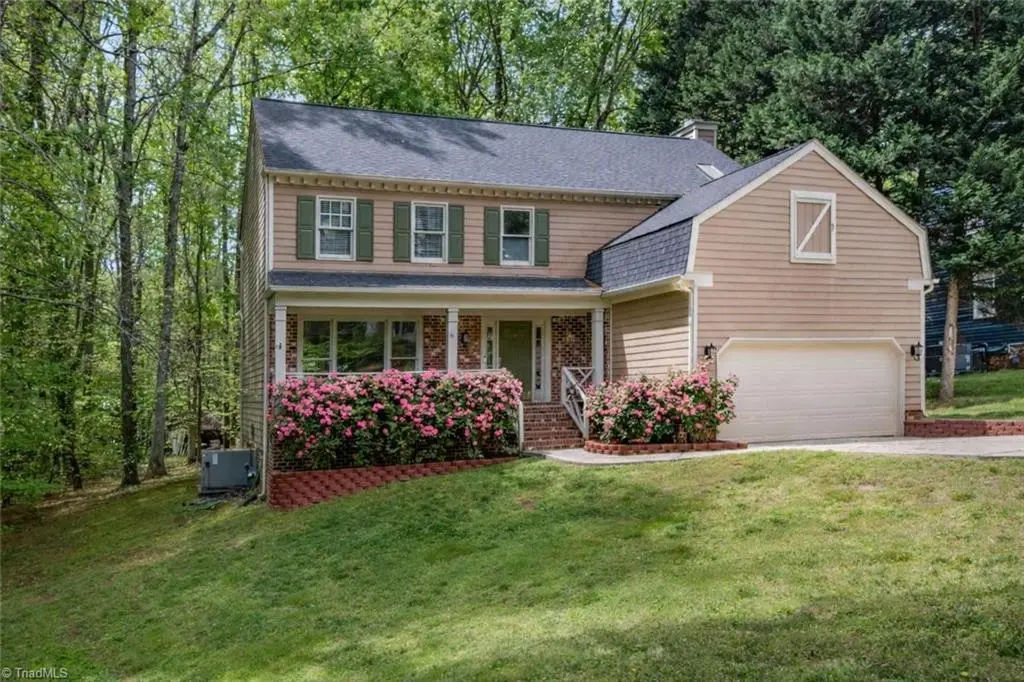
6 Spring Oak Ct · Greensboro, NC
Flood risk 1/10 · Minimal
- FEMA flood zone
- X (unshaded)
- Chance of flooding over 30 yrs
- 0.0%
- Est. flood insurance / yr
- $507 – $1,088
Fire risk 1/10 · Minimal
- Est. fire insurance / yr
- $906 – $1,684
Heat risk 5/10 · Moderate
- Hot days now (above 102°F)
- 7 days/yr
- Hot days in 30 yrs
- 17 days/yr
Wind risk 4/10 · Minor
- Chance of severe wind over 30 yrs
- 13.0%
Air-quality risk 2/10 · Minimal
- Unhealthy air days now
- 1 days/yr
- Unhealthy air days in 30 yrs
- 1 days/yr
Risk factors via First Street. Map © Google.
Why this score? — see what drove the D+ grade
The composite is a weighted blend of 9 inputs, each scored 0–100. Each bar is that input's sub-score; the figure is the points it added to the 100-point composite (weight × sub-score).
- ARV discount +14.2/15.0
- Cash flow +12.1/30.0
- Livability +4.0/5.0
- Rent growth +3.9/5.0
- DSCR +3.6/10.0
- Schools +3.6/10.0
- 1% rule +2.8/10.0
- Condition / age +2.5/5.0
- Appreciation +0.0/10.0
$359,000
🖨 Deal sheet (PDF) 📄 Offer letter ✓ Due diligence
Listing remarks MLS
You can’t help but enjoy this immaculate, well cared for home! The ample yard, roomy covered porch & large deck with gazebo make it the perfect place for gathering with friends, neighbors & family. This lovely home, with its wood burning fireplace, walls of floor to ceiling windows & tasteful colors has a warm, sunny, inviting feel. And what a great Master/Master Bath combination! Although tucked away on a quiet, private, wooded cul-de-sac, it is convenient to shopping with easy access to Bryan Blvd.
Key facts
- Fresh paint
- New carpet
- Brand new roof
Tags
Property features AI
Finance
- HOA & community: Located in the Country Woods subdivision; No homeowners association
Exterior
- Parking: Attached front-load garage with 2 garage spaces; Driveway
- Utilities: Public sewer; Gas water heater
- Home design: Residential stick/site-built house; Two levels; Built in 1987; One fireplace in the den
- Construction: Brick and Masonite exterior
- Exterior features: Public maintained road; Public water
Interior
- Kitchen: Microwave; Dishwasher; Free-standing range
- Bedrooms: Bedrooms located on the second floor
- Flooring: Carpet; Laminate; Tile
- Bathrooms: Two full bathrooms; One half bathroom
- Heating & cooling: Forced-air heating (natural gas); Central air conditioning; Natural gas heating fuel
- Interior features: Den and living room; Dining room
- Laundry & utility: Gas water heater
Neighborhood map
What this means for you Summary
Snapshot
- This is a 4-bed/2.5-bath single-family listed at $359k.
Deal economics
- At list price, monthly cash flow is $-78 ($-940/yr) — negative.
- To cash-flow at today's rent, offer at most $345k (3.9% below list).
- To meet the 1% rule (rent ≥ 1% of price), the offer needs to be $281k (21.6% below list).
- Recommended offer: $281k (21.6% below list) — sets the bar for 1% rule.
- Cap rate 6.0% vs local median 3.8% in Greensboro — top-decile yield for the area; either an underpriced asset or a hidden risk that comps aren't pricing in. Stress-test before assuming the spread holds.
Location & tenants
- Location reads 81/100 on livability (#12 in NC, #1,335 nationally) — a professional / high-income tenant draw. Strengths: amenities A+, commute A+, cost of living A+; Watch: employment D, crime F.
- Guilford County Schools (urban): math 39% / reading 45% proficiency, ranked #99 of 178 in NC (top 56%) — families likely to look elsewhere, expect single-tenant / working-renter base with shorter leases.
- Market conditions: Rents rising fast (+5.6%/yr); 324 active listings in the ZIP; 4 comparable units currently listed for rent nearby; rentals at typical pace (median 25d on market — plan ~3-4 weeks tenant-placement turnaround); solid renter incomes; 3,843 units permitted in Guilford County in 2024 (2,397 in 5+ unit buildings).
- This rent runs 40% of the median local income ($85k/yr) — at the standard rent-burdened threshold; future hikes will face affordability resistance.
Forward outlook
- Local home prices are declining (-3.0%/yr); year-one equity from $2k of loan paydown is wiped out by about $11k of value loss. Plan a longer hold.
- Guilford County population projected at +26% by 2050 — long-run rental-demand tailwind backs the buy-and-hold thesis.
Negotiation context
- It's been on market 64 days — a 6% lower offer ($337k) is reasonable based on typical stale-listing flexibility.
- 2 sale attempts since 9y ago; this cycle's ask has dropped $21k (6%) from the opening price — seller is motivated, your offer sets the floor, not the list.
- Current owner paid $200k; list at $359k implies a 79% gain — meaningful room to come down on a strong offer.
Risks & watch-outs
- Climate carrying-cost: extreme-heat days projected 7→17/yr by 2055 (HVAC capex compounding) — expect insurance premiums to compound above CPI over the hold.
Questions for the listing agent
- What do current leases actually rent for vs. the listed asking? Can we see a recent rent roll and the last 12 months of T-12 income?
- It's been on market 64 days. Have you received any prior offers? Is the seller open to a 22% concession, seller financing, or rate buy-down credit?
- Why hasn't it sold? Are there any deal-killer items the seller is aware of (foundation, flood, title, zoning, code violations)?
- Is there a deadline driving the sale (1031 exchange, divorce, estate, relocation)? That informs how much negotiation room exists.
- Crime grade is F in this area — have there been break-ins, vandalism, or insurance claims at this property in the last 3 years? What carrier currently insures it and at what premium?
- The area grade is low — what's the realistic commute time and amenity access for the typical tenant pool here? Any planned neighborhood developments (good or bad) we should know about?
- What's the average days-on-market for RENTAL listings here right now (not sales)? A rising rental-DOM trend means longer vacancies and softer asking-rent achievability than the comps imply.
- What's the recent tenant-quality profile in this submarket — average credit score on applications, eviction rate, late-payment / NSF rate, and stable-employment percentage? A property-management company in the area should have these aggregated.
- How much new for-sale + rental construction is in the pipeline within 1–3 miles? Heavy new supply typically softens prices + rents 12–24 months out; constrained supply supports both.
Investment metrics
- 1% rule
- 0.78% ✗
- Cap rate
- 6.03%
- Cash-on-cash
- -0.94%
- DSCR
- 0.96
- GRM
- 10.6
CMA / ARV
- ARV (on-the-fly)
- $421,848
- Comps found
- 10
Show comp detail 10 sales within ~0.75 mi
| Address | Dist | Beds/Ba | Sqft | Sold | Price | $/sf | Match |
|---|---|---|---|---|---|---|---|
| 1907 Norwich Dr | 0.33mi | 3/2.0 (-1) | 2,226 (-2%) | 6mo | $329,900 | $148 | 69 |
| 5603 Greenwich Dr | 0.44mi | 4/3.0 | 2,262 (-0%) | 15mo | $370,000 | $164 | 65 |
| 5718 Northlake Dr | 0.60mi | 4/2.5 | 2,233 (-2%) | 11mo | $415,000 | $186 | 60 |
| 5803 Kacey Meadows Dr | 0.64mi | 4/2.5 | 2,424 (+7%) | 1mo | $520,000 | $215 | 58 |
| 5610 Fleming Terrace Rd | 0.61mi | 4/3.0 | 2,441 (+8%) | 3mo | $415,000 | $170 | 55 |
| 5606 Country Ln | 0.69mi | 3/2.0 (-1) | 2,231 (-2%) | 8mo | $397,000 | $178 | 51 |
| 5710 Southlake Dr | 0.72mi | 4/2.5 | 2,115 (-7%) | 15mo | $397,500 | $188 | 43 |
| 5818 Green Meadow Dr | 0.69mi | 5/2.5 (+1) | 2,521 (+11%) | 7mo | $465,000 | $184 | 38 |
| 5805 Hidden Orchard Dr | 0.62mi | 4/2.5 | 1,976 (-13%) | 21mo | $379,999 | $192 | 33 |
| 5714 Hidden Orchard Dr | 0.57mi | 4/2.5 | 2,574 (+14%) | 24mo | $535,000 | $208 | 31 |
Match score weights: distance 35% · size 25% · config 20% · recency 20%. Top-matched comps best support the ARV.
Projected returns pro-forma
-3.0% appreciation · 5.57% rent growth · sell at horizon
- IRR
- -15.2%
- Equity multiple
- 0.45×
- Total profit
- $-55,766
- Equity at exit
- $53,528
- IRR
- -3.1%
- Equity multiple
- 0.77×
- Total profit
- $-22,976
- Equity at exit
- $31,040
Cash invested: $100,520 (down + closing). Projections, not guarantees.
Landlord ↔ Tenant lean methodology
- Overall (STATE)
- 85 Strongly Landlord-Friendly
- State North Carolina
- 85 Strongly Landlord-Friendly · R+3
- County
- — inherits STATE
- City
- — inherits STATE
ZIP-level market 27410
- Rents YoY
- 5.6%
- Active inventory
- 324
- Price-to-rent
- 10.6×
Monthly cashflow live
- Estimated rent
- $2,814 medium interval (Pro) →
- Mortgage (P&I)
- −$1,883
- Tax from tax record
- −$269 /mo · $3,231/yr
- Insurance
- −$150
- HOA
- −$0
- Vacancy / Maint / Mgmt
- −$591
- Net cashflow
- $-78
Break-even live
Sensitivity live
| Price | -10% $125 | -5% $23 | +0% $-78 | +5% $-180 | +10% $-282 |
|---|---|---|---|---|---|
| Rent | -10% $-301 | -5% $-189 | +0% $-78 | +5% $33 | +10% $144 |
| Rate | -1.0pp $102 | -0.5pp $13 | base $-78 | +0.5pp $-171 | +1.0pp $-266 |
UW: 25.0% down · 7.5% · 30yr · 1.5% tax · 5.0% vac · 8.0% maint · 8.0% mgmt
Financing live
Cash to close
- Down payment
- $89,750
- Closing costs
- $10,770
- Reserves months
- —
- Total cash needed
- —
Loan-product check · same deal, 3 products live
Conventional
25% down · 7.5% · 30yr
- Down + closing
- —
- Monthly P&I
- —
- Monthly cashflow
- —
- DSCR
- —
- Eligible?
- —
Personal DTI + credit; lowest rate.
DSCR
20% down · 8.5% · 30yr
- Down + closing
- —
- Monthly P&I
- —
- Monthly cashflow
- —
- DSCR
- —
- Eligible?
- —
No personal income docs; deal must DSCR.
Hard money
10% down · 12.0% · 12mo
- Down + closing
- —
- Monthly P&I
- —
- Monthly cashflow
- —
- DSCR
- —
- Eligible?
- —
Short-term bridge; refi at stabilization.
Rent comps 4 comps
| Address | Beds | Baths | Sqft | Rent | $/sqft | DOM | Units | Dist |
|---|---|---|---|---|---|---|---|---|
| 4126 Macbeth ST Greensboro, NC | 3.0–4.0 | 2.5–3.5 | 1917 | $3,762 | $1.96 | 24d | 24 | 0.36mi |
| 3611 Bridleton Ridge Trl Greensboro, NC | 3.0 | 2.5 | 1637 | $2,350 | $1.44 | 15d | 1 | 1.00mi |
| 907 Elderberry Way Greensboro, NC | 3.0 | 2.5 | 1618 | $1,995 | $1.23 | 24d | 1 | 1.20mi |
| 4807 Jessup Grove Rd Greensboro, NC | 4.0 | 3.0 | 1860 | $2,065 | $1.11 | 24d | 1 | 1.38mi |
Listing history 26 events
-
2026-06-19price $359,000 Active 64 DOM
-
2026-06-18days on market $365,000 Active 64 DOM
-
2026-06-17days on market $365,000 Active 63 DOM
-
2026-06-16days on market $365,000 Active 62 DOM
-
2026-06-15days on market $365,000 Active 61 DOM
-
2026-06-14days on market $365,000 Active 59 DOM
-
2026-06-10days on market $365,000 Active 56 DOM
-
2026-06-09days on market $365,000 Active 55 DOM
-
2026-06-08days on market $365,000 Active 54 DOM
-
2026-06-07pricedays on market $365,000 Active 53 DOM
-
2026-06-03days on market $370,000 Active 49 DOM
-
2026-06-02days on market $370,000 Active 48 DOM
-
2026-06-01days on market $370,000 Active 47 DOM
-
2026-05-31days on market $370,000 Active 46 DOM
-
2026-05-31days on market $370,000 Active 45 DOM
-
2026-05-12price $370,000
-
2026-04-15$380,000 Active
-
2026-02-07price $380,000
-
2017-05-25soldstatus $200,101 Sold 528-char remark
Show marketing remark (528 chars)
You can’t help but enjoy this immaculate, well cared for home! The ample yard, roomy covered porch & large deck with gazebo make it the perfect place for gathering with friends, neighbors & family. This lovely home, with its wood burning fireplace, walls of floor to ceiling windows & tasteful colors has a warm, sunny, inviting feel. And what a great Master/Master Bath combination! Although tucked away on a quiet, private, wooded cul-de-sac, it is convenient to shopping with easy access to Bryan Blvd.
-
2017-04-19status Due Diligence Period 528-char remark
Show marketing remark (528 chars)
You can’t help but enjoy this immaculate, well cared for home! The ample yard, roomy covered porch & large deck with gazebo make it the perfect place for gathering with friends, neighbors & family. This lovely home, with its wood burning fireplace, walls of floor to ceiling windows & tasteful colors has a warm, sunny, inviting feel. And what a great Master/Master Bath combination! Although tucked away on a quiet, private, wooded cul-de-sac, it is convenient to shopping with easy access to Bryan Blvd.
-
2017-04-12$199,900 Active 528-char remark
Show marketing remark (528 chars)
You can’t help but enjoy this immaculate, well cared for home! The ample yard, roomy covered porch & large deck with gazebo make it the perfect place for gathering with friends, neighbors & family. This lovely home, with its wood burning fireplace, walls of floor to ceiling windows & tasteful colors has a warm, sunny, inviting feel. And what a great Master/Master Bath combination! Although tucked away on a quiet, private, wooded cul-de-sac, it is convenient to shopping with easy access to Bryan Blvd.
-
2016-08-27price $199,900
-
2016-08-12price $205,900
-
2016-07-15price $209,900
-
1996-06-01soldstatus $157,900
-
1993-09-01soldstatus $139,000
ⓘ Source: listings_history table (triggers on properties + properties_extension) + one-shot
backfill from property_details.listing_events for pre-trigger history.
Tax reassessment forecast NC · Resets to sale price
- Current annual tax
- $3,231 · $269/mo
- Projected year-2 tax
- $3,231 · $269/mo
- Expected delta
- $0/yr ($0/mo · 0.0%)
ⓘ Screening estimate from a state-policy table — verify with the county assessor before closing.
Climate risk First Street
- Flood 1/10 Low FEMA zone X (unshaded) · 0% chance over 30 yrs
- Wildfire 1/10 Low
- Heat 5/10 Major 7 d/yr ≥102°F today · 17 d/yr by 30 yrs out
- Wind 4/10 Moderate 13% chance of damaging wind over 30 yrs
- Air quality 2/10 Low 1 unhealthy d/yr today · 1 by 30 yrs out
Nearby sold comps map
Loading sold comps map…
Walkable amenities ~0.75 mi
Loading nearby amenities…
Taxation est. · year 1
- Rental income
- $33,769
- − Mortgage interest
- −$20,110
- − Property taxes
- −$3,231
- − Insurance
- −$1,795
- − Repairs & maintenance
- −$2,702
- − Management
- −$2,702
- − Depreciation
- −$10,444
- Taxable loss
- −$7,213
- Est. tax savings @ 24.0%
- +$1,731
- After-tax cash flow
- $791/yr
For passive investors: Depreciation is non-cash, so a rental often shows a tax loss while cash-flowing — sheltering income. Rental losses are passive: they offset passive income freely, and up to $25,000/yr can offset ordinary (W-2) income if you actively participate and your MAGI is under $100k (phasing out to $0 by $150k); unused losses carry forward. On sale, claimed depreciation is recaptured at up to 25%, and gains may owe capital-gains tax (a 1031 exchange can defer both). Figures are a year-1 estimate at your 24.0% rate — not tax advice; consult a CPA.
Schools (NCES district)
- District
- Guilford County Schools
- NCES district ID
- 3701920
- Math proficiency
- 39% ▲ 1.00%
- Reading proficiency
- 45% ▲ 1.00%
- Median HH income
- $46,315
- Composite
- 35.78/100
- National rank
- #4842
- State rank
- #99 of 178 in NC
Livability — Greensboro
- Score
- 81/100
- State rank
- #12
- US rank
- #1335
Category grades
Schools grade is shown separately in the Schools card above.
Census & demographics
- Census place
- Greensboro, NC
- County
- Guilford County · 487,190 people
- City population
- 329,421
- Metro
- Greensboro-High Point, NC
- Population (ZIP)
- 54,921
- Household income
- $85,291
- Rent vs Own
- Severe rent burden
- 2696.0
Population outlook (Guilford County) Hauer SSP2
- Today (2025)
- 584,596 people
- By 2030
- 616,851 · +5.5%
- By 2040
- 678,451 · +16.1%
- By 2050
- 734,788 · +25.7%
- By 2075
- 862,985 · +47.6%
- By 2100
- 948,704 · +62.3%
Race, ethnicity, and origin ACS 2023
- Neighborhood character
- Predominantly White (68%)
- Race & ethnicity
- White 68% Black 15% Two or more races 8% Hispanic / Latino 7% Asian 5%
- Hispanic origin (detail)
- Mexican 2% Puerto Rican 2%
- Common ancestry
- Italian 3% Serbian 3% Slovak 3%
- Foreign-born
- 11% · Canada, South Korea, China
- Languages at home
- 86% English-only · Spanish 4% Other Indo-European 3% Other Asian/Pacific 1%
Political lean MEDSL · Guilford
- 2024 margin
- Strong D (+21.8) · D 60.2% · R 38.4% · Other 1.4%
- 2008→2024 swing
- +3.5pp toward D · 2008: 18.4pp · 2024: 21.8pp
- All cycles
- 2024: D+21.8 2020: D+23.1 2016: D+20.0 2012: D+16.5 2008: D+18.4
Not yet ingested
- Civics
- —
Market trends
- HPI YoY
- ▼ -245.81%
- Current HPI
- 222.1685
- Rent YoY
- ▲ 5.57%
- Metro
- Greensboro-High Point, NC
- State GDP YoY
- ▲ 3.28%
- F500 in state
- 26
Industry mix (Fortune 500 HQ in NC)
| Industry | F500 HQs | Revenue |
|---|---|---|
| Financial Services | 2 | $213B |
|
||
| Retail | 2 | $95B |
|
||
| Industrial Conglomerate | 1 | $38B |
|
||
| Metals / Steel | 1 | $35B |
|
||
| Utilities | 1 | $30B |
|
||
| Industrial Machinery | 1 | $19B |
|
||
Price history
+166.2% since first listed11 events — show timeline
- 2026-05-12 Price Changed $370,000 Triad MLS
- 2026-04-15 Listed $380,000 Triad MLS
- 2026-02-07 Price Changed $380,000 Triad MLS
- 2017-05-25 Sold (MLS) $200,101 Triad MLS
- 2017-04-19 Pending — Triad MLS
- 2017-04-12 Listed $199,900 Triad MLS
- 2016-08-27 Price Changed $199,900 Triad MLS
- 2016-08-12 Price Changed $205,900 Triad MLS
- 2016-07-15 Price Changed $209,900 Triad MLS
- 1996-06-01 Sold (Public Records) $157,900 Public Records
- 1993-09-01 Sold (Public Records) $139,000 Public Records
Property tax history
+2.1%/yrLatest (2025): $3,231 · -1.0% YoY. Source: county tax records.
Cash-flow waterfall
monthlySold comps — $/sqft
last 12 mo · ≤1 miLoading sold comps…