 Multi-family
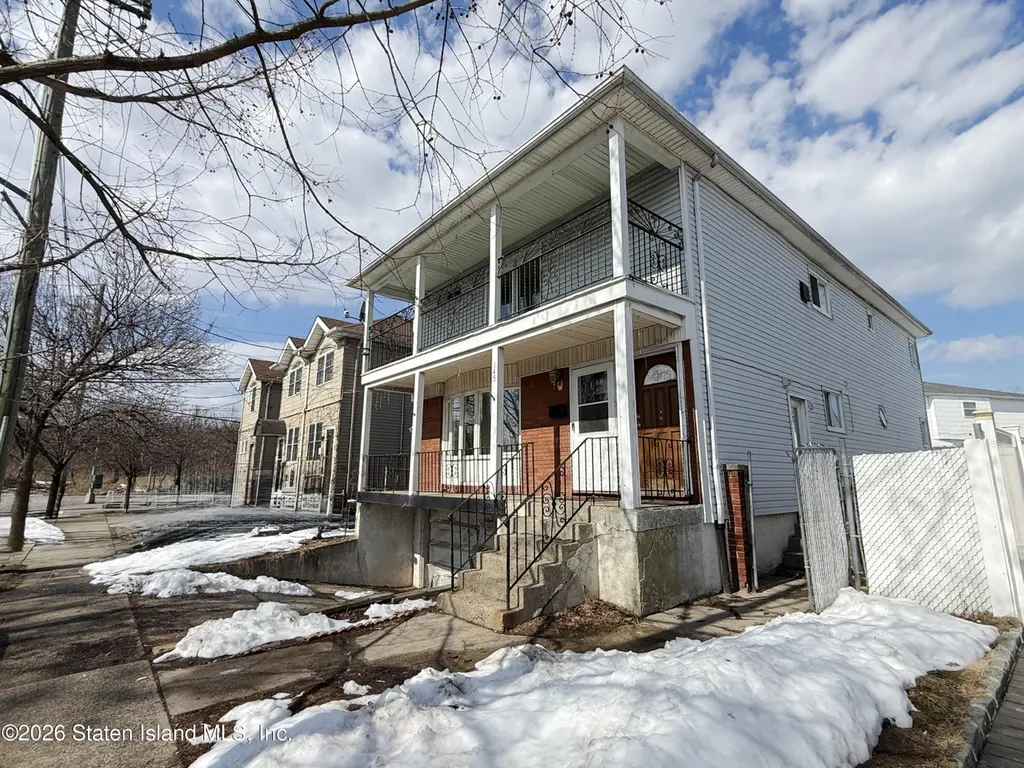
145 Amador St · New York, NY
Flood risk 6/10 · Moderate
- FEMA flood zone
- X (unshaded)
- Chance of flooding over 30 yrs
- 0.74%
- Est. flood insurance / yr
- $507 – $1,088
Fire risk 1/10 · Minimal
- Est. fire insurance / yr
- $691 – $1,283
Heat risk 7/10 · Major
- Hot days now (above 98°F)
- 7 days/yr
- Hot days in 30 yrs
- 15 days/yr
Wind risk 6/10 · Moderate
- Chance of severe wind over 30 yrs
- 50.0%
Air-quality risk 4/10 · Minor
- Unhealthy air days now
- 5 days/yr
- Unhealthy air days in 30 yrs
- 6 days/yr
Risk factors via First Street. Map © Google.
Why this score? — see what drove the B+ grade
The composite is a weighted blend of 9 inputs, each scored 0–100. Each bar is that input's sub-score; the figure is the points it added to the 100-point composite (weight × sub-score).
- Cash flow +30.0/30.0
- ARV discount +15.0/15.0
- DSCR +10.0/10.0
- 1% rule +9.5/10.0
- Schools +5.0/10.0
- Livability +3.8/5.0
- Rent growth +2.5/5.0
- Condition / age +2.5/5.0
- Appreciation +0.0/10.0
$699,950
🖨 Deal sheet 📄 Offer letter ✓ Due diligence
Multi-family units
County records classify this as Multi-Family (2-4 Unit). Listing-text estimate: 1 unit. estimate disagrees with records
Listing remarks
3/31/2026 (Seller has accepted an offer) ---- Some images in this listing have been virtually staged. Property sold as-is. Buyer to pay transfer tax. Basement may not have legal use—buyer to verify. Buyer responsible for conducting their own due diligence, including verification of any open permits or violations with NYC DOB/ECB. Foreclosure has been completed. Buyer to independently verify all information. Per seller instructions, offers may not be submitted until the 8th day following MLS listing. Offers will be accepted starting 03/27/2026. Property is monitored by video surveillance (no audio).
Key facts
- Great natural light
- 4,275 sq ft lot
- 2 garage spots
Tags
Property features AI
Finance
- Other: Taxes listed (amount available in listing details)
- Financial info: Two-unit multi-family property
Exterior
- Parking: Attached garage with 2 spaces; Off-street parking
- Utilities: Electric: 220 volts
- Home design: 2-story multi-family property; Building total area reported as 2,688; Approximate year built
- Construction: Brick and vinyl siding exterior; Property condition listed as fair
- Exterior features: Balcony; Lot approximately 0.1 acre (45 x 95); Zoned R3-2
Interior
- Bedrooms: Unit 1: 3 bedrooms; Unit 2: 3 bedrooms
- Bathrooms: 3 full bathrooms and 1 half bathroom (total 4 bathrooms); Unit 1: 1 bathroom
- Heating & cooling: Natural gas heating; Forced air heating; Hot water heating; Cooling provided by units
- Interior features: Central air conditioning (unitized); Partially finished basement; Balcony
Neighborhood map
What this means for you Summary
Snapshot
- This is a 6-bed/3.5-bath multifamily listed at $700k.
Deal economics
- At list price, monthly cash flow is $3k ($42k/yr) — positive.
- The deal already cash-flows at list — no discount required.
- Meets the 1% rule at list price ($10k rent vs $700k).
- Recommended offer: $679k (3.0% below list) — sets the bar for market timing.
- Cap rate 12.2% vs local median 2.6% in New York — top-decile yield for the area; either an underpriced asset or a hidden risk that comps aren't pricing in. Stress-test before assuming the spread holds.
Location & tenants
- Location reads 75/100 on livability (#268 in NY, #4,188 nationally) — a middle-class / working-renter tenant base. Strengths: amenities A+, commute A+, health & safety A; Watch: crime F, cost of living F.
- Market conditions: 108 active listings in the ZIP; solid renter incomes; 480 units permitted in Richmond County in 2024 (22 in 5+ unit buildings).
- At $10,153/mo this rent would consume 145% of the median local household income ($84k/yr) (locally 1198% of renters already pay >50% of income on rent) — very limited rent-growth headroom before tenants either downsize or default.
Forward outlook
- Local home prices are declining (-3.0%/yr); year-one equity from $5k of loan paydown is wiped out by about $21k of value loss. Plan a longer hold.
- Richmond County population projected to shrink 5% by 2050 — rents likely to lag national; underwrite the cash flow, not the appreciation.
- At projected returns (-3.0% appreciation + 3.0% rent growth), your $196k cash investment doubles in ~6 years — after that, you're playing with house money.
Negotiation context
- It's been on market 55 days — a 3% lower offer ($679k) is reasonable based on typical stale-listing flexibility.
- 5 sale attempts since 20y ago with the ask held roughly flat each time — persistent listings suggest the price (not the market) is what's stuck; bring a comps-based counter.
- Current owner paid $560k; 25% above their basis — modest negotiation headroom, anchor on the comps not their cost.
Risks & watch-outs
- Climate carrying-cost: major flood risk; major wind risk, 50% chance of damaging wind over 30y; extreme-heat days projected 7→15/yr by 2055 (HVAC capex compounding) — expect insurance premiums to compound above CPI over the hold.
Questions for the listing agent
- It's been on market 55 days. Have you received any prior offers? Is the seller open to a 3% concession, seller financing, or rate buy-down credit?
- Built in 1970 — when were the roof, HVAC, electrical panel, plumbing, and water heater last replaced?
- Is there a deadline driving the sale (1031 exchange, divorce, estate, relocation)? That informs how much negotiation room exists.
- Schools are B-rated — typically a magnet for longer-tenancy family renters. What's the average tenant stay here, and is there a school-zone premium baked into asking?
- Crime grade is F in this area — have there been break-ins, vandalism, or insurance claims at this property in the last 3 years? What carrier currently insures it and at what premium?
- What's the average days-on-market for RENTAL listings here right now (not sales)? A rising rental-DOM trend means longer vacancies and softer asking-rent achievability than the comps imply.
- What's the recent tenant-quality profile in this submarket — average credit score on applications, eviction rate, late-payment / NSF rate, and stable-employment percentage? A property-management company in the area should have these aggregated.
- How much new apartment / multifamily construction is in the pipeline within 1–3 miles? Heavy new supply (>2% of stock underway) typically softens rents 12–24 months out; light construction supports rent growth.
Investment metrics
- 1% rule
- 1.45% ✓
- Cap rate
- 12.22%
- Cash-on-cash
- 21.18%
- DSCR
- 1.94
- GRM
- 5.7
CMA / ARV
- ARV (on-the-fly)
- $1,123,584
- Comps found
- 5
Show comp detail 5 sales within ~0.75 mi
| Address | Dist | Beds/Ba | Sqft | Sold | Price | $/sf | Match |
|---|---|---|---|---|---|---|---|
| 15 Birch Rd | 0.22mi | 6/3.5 | 2,400 (-11%) | 8mo | $996,000 | $415 | 65 |
| 18 Albert Ct | 0.22mi | 6/5.0 | 2,400 (-11%) | 3mo | $945,000 | $394 | 63 |
| 161 Lander Ave | 0.69mi | 6/4.0 | 2,400 (-11%) | 7mo | $1,325,000 | $552 | 42 |
| 157 Lander Ave | 0.70mi | 6/2.0 | 2,400 (-11%) | 4mo | $1,335,000 | $556 | 40 |
| 253 Van Pelt Ave | 0.73mi | 6/4.0 | 2,331 (-13%) | 11mo | $975,000 | $418 | 33 |
Match score weights: distance 35% · size 25% · config 20% · recency 20%. Top-matched comps best support the ARV.
Projected returns pro-forma
-3.0% appreciation · 3.0% rent growth · sell at horizon
- IRR
- 13.7%
- Equity multiple
- 1.55×
- Total profit
- $106,925
- Equity at exit
- $104,365
- IRR
- 22.5%
- Equity multiple
- 2.92×
- Total profit
- $376,794
- Equity at exit
- $60,519
Cash invested: $195,986 (down + closing). Projections, not guarantees.
Landlord ↔ Tenant lean methodology
- Overall (CITY)
- 0 Strongly Tenant-Friendly
- State New York
- 15 Strongly Tenant-Friendly · D+10
- County
- — inherits STATE
- City New York
- 0 Strongly Tenant-Friendly · D+34
ZIP-level market 10303
- Home prices YoY
- -24.8%
- Active inventory
- 108
- Price-to-rent
- 23.0×
Monthly cashflow live
- Estimated rent
- $10,153 medium interval (Pro) →
- Mortgage (P&I)
- −$3,671
- Tax from tax record
- −$599 /mo · $7,184/yr
- Insurance
- −$292
- HOA
- −$0
- Vacancy / Maint / Mgmt
- −$2,132
- Net cashflow
- $3,460
Break-even live
4-unit breakdown (identical units grouped — click to expand)
| Units | Beds | Baths | Est. rent |
|---|---|---|---|
| 4× units | 2 | 1.5 | $10,152 |
| #1 | 2 | 1.5 | $2,538 |
| #2 | 2 | 1.5 | $2,538 |
| #3 | 2 | 1.5 | $2,538 |
| #4 | 2 | 1.5 | $2,538 |
| Total (4 units) | $10,153 | ||
UW: 25.0% down · 7.5% · 30yr · 1.5% tax · 5.0% vac · 8.0% maint · 8.0% mgmt
Financing live
Cash to close
- Down payment
- $174,988
- Closing costs
- $20,998
- Reserves months
- —
- Total cash needed
- —
Loan-product check · same deal, 3 products live
Conventional
25% down · 7.5% · 30yr
- Down + closing
- —
- Monthly P&I
- —
- Monthly cashflow
- —
- DSCR
- —
- Eligible?
- —
Personal DTI + credit; lowest rate.
DSCR
20% down · 8.5% · 30yr
- Down + closing
- —
- Monthly P&I
- —
- Monthly cashflow
- —
- DSCR
- —
- Eligible?
- —
No personal income docs; deal must DSCR.
Hard money
10% down · 12.0% · 12mo
- Down + closing
- —
- Monthly P&I
- —
- Monthly cashflow
- —
- DSCR
- —
- Eligible?
- —
Short-term bridge; refi at stabilization.
Listing history 14 events
-
2026-05-13status Pending
-
2026-03-19$699,950 Active
-
2017-04-24historical
-
2017-04-05price $619,000
-
2017-04-05status Active
-
2017-02-16status Pending
-
2017-02-15historical
-
2017-02-15$250,000 Active
-
2014-12-12historical
-
2008-06-26$589,900
-
2007-04-04soldstatus $560,000
-
2007-03-20soldstatus $560,000
-
2006-09-18$629,900
-
2001-10-18soldstatus $129,000
ⓘ Source: listings_history table (triggers on properties + properties_extension) + one-shot
backfill from property_details.listing_events for pre-trigger history.
Tax reassessment forecast NY · Partial reset (capped growth)
- Current annual tax
- $7,184 · $599/mo
- Projected year-2 tax
- $9,507 · $792/mo
- Expected delta
- +$2,322/yr (+$194/mo · 32.3%)
ⓘ Screening estimate from a state-policy table — verify with the county assessor before closing.
Climate risk First Street
- Flood 6/10 Major FEMA zone X (unshaded) · 74% chance over 30 yrs
- Wildfire 1/10 Low
- Heat 7/10 Severe 7 d/yr ≥98°F today · 15 d/yr by 30 yrs out
- Wind 6/10 Major 50% chance of damaging wind over 30 yrs
- Air quality 4/10 Moderate 5 unhealthy d/yr today · 6 by 30 yrs out
Nearby sold comps map
Loading sold comps map…
Walkable amenities ~0.75 mi
Loading nearby amenities…
Taxation est. · year 1
- Rental income
- $121,836
- − Mortgage interest
- −$39,208
- − Property taxes
- −$7,184
- − Insurance
- −$3,500
- − Repairs & maintenance
- −$9,747
- − Management
- −$9,747
- − Depreciation
- −$20,362
- Taxable income
- $32,088
- Est. tax owed @ 24.0%
- −$7,701
- After-tax cash flow
- $33,818/yr
For passive investors: Depreciation is non-cash, so a rental often shows a tax loss while cash-flowing — sheltering income. Rental losses are passive: they offset passive income freely, and up to $25,000/yr can offset ordinary (W-2) income if you actively participate and your MAGI is under $100k (phasing out to $0 by $150k); unused losses carry forward. On sale, claimed depreciation is recaptured at up to 25%, and gains may owe capital-gains tax (a 1031 exchange can defer both). Figures are a year-1 estimate at your 24.0% rate — not tax advice; consult a CPA.
Schools (NCES district)
No district data.
Livability — New York
- Score
- 75/100
- State rank
- #268
- US rank
- #4188
Category grades
Schools grade is shown separately in the Schools card above.
Census & demographics
- Census place
- New York, NY
- County
- Richmond County · 404,174 people
- City population
- 7,731,280
- Metro
- New York-Newark-Jersey City, NY-NJ-PA
- Population (ZIP)
- 26,497
- Household income
- $83,947
- Rent vs Own
- Severe rent burden
- 1198.0
Population outlook (Richmond County) Hauer SSP2
- Today (2025)
- 482,784 people
- By 2030
- 481,831 · -0.2%
- By 2040
- 473,159 · -2.0%
- By 2050
- 457,242 · -5.3%
- By 2075
- 408,029 · -15.5%
- By 2100
- 341,459 · -29.3%
Race, ethnicity, and origin ACS 2023
- Neighborhood character
- Highly diverse neighborhood (Simpson 0.72)
- Race & ethnicity
- Hispanic / Latino 38% Black 33% Two or more races 17% White 15% Asian 10%
- Hispanic origin (detail)
- Mexican 5% Puerto Rican 19% Dominican 5%
- Common ancestry
- Romanian 2% Italian 1% Swiss 1%
- Foreign-born
- 26% · Canada, China, Jamaica
- Languages at home
- 57% English-only · Spanish 25% Other Indo-European 6% Chinese 3%
Political lean MEDSL · Richmond
- 2024 margin
- Strong R (+29.8) · D 35.1% · R 64.9%
- 2008→2024 swing
- -25.7pp toward R · 2008: -4.0pp · 2024: -29.8pp
- All cycles
- 2024: R+29.8 2020: R+14.9 2016: R+16.8 2012: D+0.8 2008: R+4.0
Not yet ingested
- Civics
- —
Market trends
- HPI YoY
- ▼ -121.86%
- Current HPI
- 369.2771
- Rent YoY
- —
- Metro
- New York-Newark-Jersey City, NY-NJ-PA
- State GDP YoY
- ▲ 2.60%
- F500 in state
- 92
Industry mix (Fortune 500 HQ in NY)
| Industry | F500 HQs | Revenue |
|---|---|---|
| Financial Services | 10 | $950B |
|
||
| Consumer Goods | 9 | $162B |
|
||
| Insurance | 4 | $225B |
|
||
| Telecommunications | 2 | $144B |
|
||
| Pharmaceuticals | 2 | $112B |
|
||
| Media / Entertainment | 2 | $69B |
|
||
Price history
+442.6% since first listed14 events — show timeline
- 2026-05-13 Pending — SIBORMLS
- 2026-03-19 Listed $699,950 SIBORMLS
- 2017-04-24 Listing Removed — SIBORMLS
- 2017-04-05 Price Changed $619,000 SIBORMLS
- 2017-04-05 Relisted — SIBORMLS
- 2017-02-16 Pending — SIBORMLS
- 2017-02-15 Listing Removed — SIBORMLS
- 2017-02-15 Listed $250,000 SIBORMLS
- 2014-12-12 Listing Removed — SIBORMLS
- 2008-06-26 Listed $589,900 SIBORMLS
- 2007-04-04 Sold (Public Records) $560,000 Public Records
- 2007-03-20 Sold (MLS) $560,000 SIBORMLS
- 2006-09-18 Listed $629,900 SIBORMLS
- 2001-10-18 Sold (Public Records) $129,000 Public Records
Property tax history
+3.4%/yrLatest (2025): $7,184 · +0.0% YoY. Source: county tax records.
Cash-flow waterfall
monthlySold comps — $/sqft
last 12 mo · ≤1 miLoading sold comps…