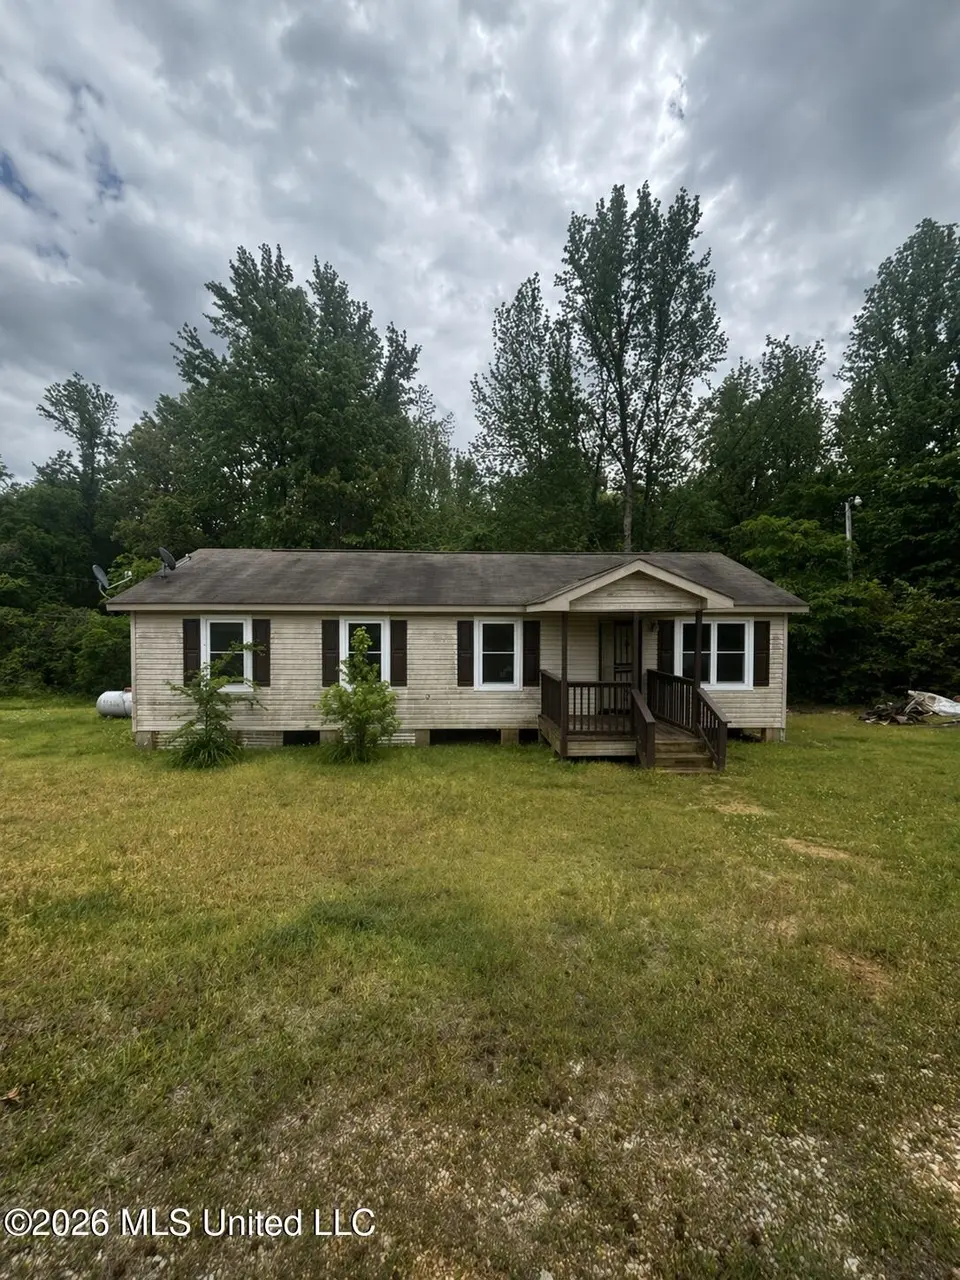
2427 Old Highway 4 · Waterford, MS
Flood risk 1/10 · Minimal
- FEMA flood zone
- X (unshaded)
- Chance of flooding over 30 yrs
- 0.0%
- Est. flood insurance / yr
- $507 – $1,088
Fire risk 6/10 · Moderate
- Est. fire insurance / yr
- $1,241 – $2,305
Heat risk 6/10 · Moderate
- Hot days now (above 108°F)
- 7 days/yr
- Hot days in 30 yrs
- 21 days/yr
Wind risk 4/10 · Minor
- Chance of severe wind over 30 yrs
- 19.0%
Air-quality risk 2/10 · Minimal
- Unhealthy air days now
- 0 days/yr
- Unhealthy air days in 30 yrs
- 1 days/yr
Risk factors via First Street. Map © Google.
Why this score? — see what drove the B grade
The composite is a weighted blend of 9 inputs, each scored 0–100. Each bar is that input's sub-score; the figure is the points it added to the 100-point composite (weight × sub-score).
- Cash flow +30.0/30.0
- DSCR +10.0/10.0
- 1% rule +9.0/10.0
- ARV discount +7.5/15.0
- Appreciation +5.0/10.0
- Rent growth +2.5/5.0
- Livability +2.5/5.0
- Condition / age +2.5/5.0
- Schools +1.8/10.0
$110,000
🖨 Deal sheet (PDF) 📄 Offer letter ✓ Due diligence
Listing remarks
4 bedroom 2 bath home on 1.34 acres being sold "as-is".
Key facts
- 1.34 acre lot
- Built 2007
- Listed 47 days
Property features AI
Exterior
- Parking: Open parking
- Utilities: Well water; Septic tank; Electricity connected; Propane connected; Sewer connected; Water connected
- Home design: Single-family house; One level
- Construction: Siding construction; Asphalt shingle roof; Conventional foundation; Built (year source: Assessor)
- Exterior features: Private yard
Interior
- Kitchen: Free-standing gas range
- Bathrooms: 2 bathrooms
- Heating & cooling: Central heating; Central air conditioning
- Interior features: Free-standing gas range
Neighborhood map
What this means for you Summary
Snapshot
- This is a 4-bed/1.0-bath single-family listed at $110k.
Deal economics
- At list price, monthly cash flow is $485 ($6k/yr) — positive.
- The deal already cash-flows at list — no discount required.
- Meets the 1% rule at list price ($2k rent vs $110k).
- Recommended offer: $107k (3.0% below list) — sets the bar for market timing.
Location & tenants
- Location reads: area grade B — affects rentability + tenant quality, not the cash-flow math above.
- Marshall County School District (rural): math 18% / reading 25% proficiency, ranked #87 of 130 in MS (top 67%) — low school quality limits family demand, transient renter base, plan for 1-2y turnover; 84% free/reduced lunch — lower-income household profile, screen leases tightly.
- Zoned schools: Byhalia Middle School (5-8) (math 18% / reading 24%, grade F, #112 of 179 statewide, top 64%, 444 students, 100% FRL) — zoned schools average 100% FRL vs 84% district-wide (16 pts higher); higher-poverty schools than district average — tighter screening recommended.
- Market conditions: 147 active listings in the ZIP; 310 units permitted in Marshall County in 2024 (0 in 5+ unit buildings).
Forward outlook
- In year one you build about $750 of equity ($761 loan paydown + $-11 appreciation (-0.0% local appreciation)).
- Marshall County population projected at -24% by 2050 — secular population decline; favor cash flow + early exit over multi-decade hold.
- At projected returns (-0.0% appreciation + 3.0% rent growth), your $31k cash investment doubles in ~5 years — after that, you're playing with house money.
Negotiation context
- It's been on market 47 days — a 3% lower offer ($107k) is reasonable based on typical stale-listing flexibility.
Risks & watch-outs
- Climate carrying-cost: major wildfire risk; extreme-heat days projected 7→21/yr by 2055 (HVAC capex compounding) — expect insurance premiums to compound above CPI over the hold.
Questions for the listing agent
- It's been on market 47 days. Have you received any prior offers? Is the seller open to a 3% concession, seller financing, or rate buy-down credit?
- Is there a deadline driving the sale (1031 exchange, divorce, estate, relocation)? That informs how much negotiation room exists.
- What's the average days-on-market for RENTAL listings here right now (not sales)? A rising rental-DOM trend means longer vacancies and softer asking-rent achievability than the comps imply.
- What's the recent tenant-quality profile in this submarket — average credit score on applications, eviction rate, late-payment / NSF rate, and stable-employment percentage? A property-management company in the area should have these aggregated.
- How much new for-sale + rental construction is in the pipeline within 1–3 miles? Heavy new supply typically softens prices + rents 12–24 months out; constrained supply supports both.
Investment metrics
- 1% rule
- 1.40% ✓
- Cap rate
- 11.59%
- Cash-on-cash
- 18.91%
- DSCR
- 1.84
- GRM
- 5.9
CMA / ARV
No comps found within radius.
Projected returns pro-forma
-0.01% appreciation · 3.0% rent growth · sell at horizon
- IRR
- 18.6%
- Equity multiple
- 1.90×
- Total profit
- $27,647
- Equity at exit
- $31,886
- IRR
- 23.0%
- Equity multiple
- 3.54×
- Total profit
- $78,278
- Equity at exit
- $38,284
Cash invested: $30,800 (down + closing). Projections, not guarantees.
Landlord ↔ Tenant lean methodology
- Overall (STATE)
- 90 Strongly Landlord-Friendly
- State Mississippi
- 90 Strongly Landlord-Friendly · R+11
- County
- — inherits STATE
- City
- — inherits STATE
ZIP-level market 38635
- Home prices YoY
- -0.0%
- Active inventory
- 147
- Price-to-rent
- 5.9×
Monthly cashflow live
- Estimated rent
- $1,545 medium interval (Pro) →
- Mortgage (P&I)
- −$577
- Tax from tax record
- −$112 /mo · $1,349/yr
- Insurance
- −$46
- HOA
- −$0
- Vacancy / Maint / Mgmt
- −$324
- Net cashflow
- $485
Break-even live
Sensitivity live
| Price | -10% $548 | -5% $516 | +0% $485 | +5% $454 | +10% $423 |
|---|---|---|---|---|---|
| Rent | -10% $363 | -5% $424 | +0% $485 | +5% $546 | +10% $607 |
| Rate | -1.0pp $541 | -0.5pp $513 | base $485 | +0.5pp $457 | +1.0pp $428 |
UW: 25.0% down · 7.5% · 30yr · 1.5% tax · 5.0% vac · 8.0% maint · 8.0% mgmt
Financing live
Cash to close
- Down payment
- $27,500
- Closing costs
- $3,300
- Reserves months
- —
- Total cash needed
- —
Loan-product check · same deal, 3 products live
Conventional
25% down · 7.5% · 30yr
- Down + closing
- —
- Monthly P&I
- —
- Monthly cashflow
- —
- DSCR
- —
- Eligible?
- —
Personal DTI + credit; lowest rate.
DSCR
20% down · 8.5% · 30yr
- Down + closing
- —
- Monthly P&I
- —
- Monthly cashflow
- —
- DSCR
- —
- Eligible?
- —
No personal income docs; deal must DSCR.
Hard money
10% down · 12.0% · 12mo
- Down + closing
- —
- Monthly P&I
- —
- Monthly cashflow
- —
- DSCR
- —
- Eligible?
- —
Short-term bridge; refi at stabilization.
Listing history 16 events
-
2026-06-21days on market $110,000 Active 47 DOM
-
2026-06-18days on market $110,000 Active 44 DOM
-
2026-06-17days on market $110,000 Active 43 DOM
-
2026-06-16days on market $110,000 Active 42 DOM
-
2026-06-15days on market $110,000 Active 41 DOM
-
2026-06-13pricedays on market $110,000 Active 39 DOM
-
2026-06-10days on market $115,000 Active 36 DOM
-
2026-06-09days on market $115,000 Active 35 DOM
-
2026-06-08days on market $115,000 Active 34 DOM
-
2026-06-07days on market $115,000 Active 33 DOM
-
2026-06-03days on market $115,000 Active 29 DOM
-
2026-06-02days on market $115,000 Active 28 DOM
-
2026-06-01days on market $115,000 Active 27 DOM
-
2026-05-31days on market $115,000 Active 26 DOM
-
2026-05-16price $120,000 65-char remark
-
2026-05-05$125,000 Active 65-char remark
ⓘ Source: listings_history table (triggers on properties + properties_extension) + one-shot
backfill from property_details.listing_events for pre-trigger history.
Tax reassessment forecast MS · Resets to sale price
- Current annual tax
- $1,349 · $112/mo
- Projected year-2 tax
- $1,349 · $112/mo
- Expected delta
- $0/yr ($0/mo · 0.0%)
ⓘ Screening estimate from a state-policy table — verify with the county assessor before closing.
Climate risk First Street
- Flood 1/10 Low FEMA zone X (unshaded) · 0% chance over 30 yrs
- Wildfire 6/10 Major
- Heat 6/10 Major 7 d/yr ≥108°F today · 21 d/yr by 30 yrs out
- Wind 4/10 Moderate 19% chance of damaging wind over 30 yrs
- Air quality 2/10 Low 0 unhealthy d/yr today · 1 by 30 yrs out
Nearby sold comps map
Loading sold comps map…
Walkable amenities ~0.75 mi
Loading nearby amenities…
Taxation est. · year 1
- Rental income
- $18,537
- − Mortgage interest
- −$6,162
- − Property taxes
- −$1,349
- − Insurance
- −$550
- − Repairs & maintenance
- −$1,483
- − Management
- −$1,483
- − Depreciation
- −$3,200
- Taxable income
- $4,311
- Est. tax owed @ 24.0%
- −$1,035
- After-tax cash flow
- $4,789/yr
For passive investors: Depreciation is non-cash, so a rental often shows a tax loss while cash-flowing — sheltering income. Rental losses are passive: they offset passive income freely, and up to $25,000/yr can offset ordinary (W-2) income if you actively participate and your MAGI is under $100k (phasing out to $0 by $150k); unused losses carry forward. On sale, claimed depreciation is recaptured at up to 25%, and gains may owe capital-gains tax (a 1031 exchange can defer both). Figures are a year-1 estimate at your 24.0% rate — not tax advice; consult a CPA.
Schools (NCES district)
- District
- Marshall County School District
- NCES district ID
- 2802850
- Math proficiency
- 18% ▼ -14.00%
- Reading proficiency
- 25% ▼ -8.00%
- Median HH income
- $39,333
- Composite
- 18.11/100
- National rank
- #8970
- State rank
- #87 of 130 in MS
Livability — Waterford
No livability data for this city. (Only ~50 U.S. cities are tracked.)
Census & demographics
- Population (ZIP)
- 15,312
Population outlook (Marshall County) Hauer SSP2
- Today (2025)
- 33,542 people
- By 2030
- 31,983 · -4.6%
- By 2040
- 28,556 · -14.9%
- By 2050
- 25,352 · -24.4%
- By 2075
- 20,032 · -40.3%
- By 2100
- 16,738 · -50.1%
Race, ethnicity, and origin ACS 2023
- Neighborhood character
- Majority Black (64%)
- Race & ethnicity
- Black 64% White 29% Two or more races 5%
- Common ancestry
- Serbian 1% English 1%
- Foreign-born
- 3%
- Languages at home
- 97% English-only · Spanish 1%
Political lean MEDSL · Marshall
- 2024 margin
- Lean R (+7.3) · D 46.0% · R 53.2%
- 2008→2024 swing
- -25.5pp toward R · 2008: 18.2pp · 2024: -7.3pp
- All cycles
- 2024: R+7.3 2020: D+3.1 2016: D+9.7 2012: D+19.4 2008: D+18.2
Not yet ingested
- Civics
- —
Market trends
- HPI YoY
- ▬ -0.01%
- Current HPI
- 245.68
- Rent YoY
- —
- Metro
- —
- State GDP YoY
- —
- F500 in state
- 0
Price history
-12.0% since first listed4 events — show timeline
- 2026-06-10 Price Changed $110,000 MLSU
- 2026-05-28 Price Changed $115,000 MLSU
- 2026-05-16 Price Changed $120,000 MLSU
- 2026-05-05 Listed $125,000 MLSU
Cash-flow waterfall
monthlySold comps — $/sqft
last 12 mo · ≤1 miLoading sold comps…