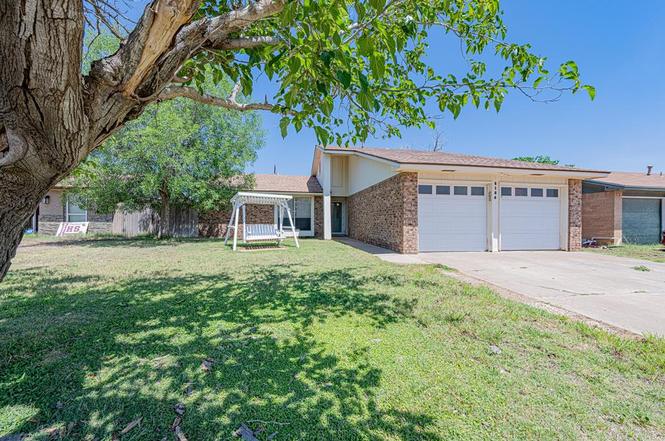
5126 Storey Ave · Midland, TX
Flood risk 1/10 · Minimal
- FEMA flood zone
- X
- Chance of flooding over 30 yrs
- 0.0%
- Est. flood insurance / yr
- $507 – $1,088
Fire risk 8/10 · Major
- Est. fire insurance / yr
- $1,222 – $2,270
Heat risk 6/10 · Moderate
- Hot days now (above 101°F)
- 7 days/yr
- Hot days in 30 yrs
- 21 days/yr
Wind risk 2/10 · Minimal
- Chance of severe wind over 30 yrs
- 3.0%
Air-quality risk 1/10 · Minimal
- Unhealthy air days now
- 0 days/yr
- Unhealthy air days in 30 yrs
- 0 days/yr
Risk factors via First Street. Map © Google.
Why this score? — see what drove the D+ grade
The composite is a weighted blend of 9 inputs, each scored 0–100. Each bar is that input's sub-score; the figure is the points it added to the 100-point composite (weight × sub-score).
- Cash flow +17.0/30.0
- ARV discount +7.5/15.0
- DSCR +5.3/10.0
- 1% rule +4.3/10.0
- Livability +4.0/5.0
- Schools +3.2/10.0
- Condition / age +2.5/5.0
- Rent growth +2.4/5.0
- Appreciation +0.0/10.0
$242,500
🖨 Deal sheet (PDF) 📄 Offer letter ✓ Due diligence
Listing remarks
Sooo Cute!!! 3 bedroom, 2 bath charmer. Enter into a light & bright home w/ wood-look laminate flooring. Flexible separate formal dining could also serve as office, play area or 2nd living space & flows directly to the kitchen & breakfast area. Breakfast nook overlooks large outdoor covered patio & great backyard including large storage shed. Spacious living area w/ wood burning brick fireplace is great for cozy evenings. Large primary bedroom suite w/ space for desk area or sitting area & great walk-in closet. Welcoming guest bedrooms & bath. Recent HVAC system. 2-car front entry garage
Key facts
- Breakfast nook
- Great walk in closet
- Large storage shed
Tags
Property features AI
Finance
- Financial info: $2,516.55 annual property tax
Exterior
- Parking: 2-car garage with garage door opener
- Security: Smoke detectors
- Utilities: Public water; Public sewer
- Home design: Single-family residence; Single-story
- Construction: Brick veneer construction; Composition roof; Slab foundation; Built on 0.176-acre lot
- Exterior features: Covered patio/porch; Wood fencing; Shed(s)
Interior
- Kitchen: Microwave; Electric range; Disposal
- Flooring: Tile
- Bathrooms: 2 full bathrooms
- Heating & cooling: Central heating (natural gas); Central air; Ceiling fans
- Interior features: Living room wood-burning fireplace; Disposal; Microwave; Electric range; Gas water heater
- Laundry & utility: Gas water heater
Neighborhood map
What this means for you Summary
Snapshot
- This is a 3-bed/2.0-bath single-family listed at $242k.
Deal economics
- At list price, monthly cash flow is $164 ($2k/yr) — positive.
- The deal already cash-flows at list — no discount required.
- To meet the 1% rule (rent ≥ 1% of price), the offer needs to be $227k (6.6% below list).
- Recommended offer: $227k (6.6% below list) — sets the bar for 1% rule.
- Cap rate 7.1% vs local median 4.7% in Midland — top-decile yield for the area; either an underpriced asset or a hidden risk that comps aren't pricing in. Stress-test before assuming the spread holds.
Location & tenants
- Location reads 79/100 on livability (#57 in TX, #2,192 nationally) — a middle-class / working-renter tenant base. Strengths: employment A+, housing A+, health & safety A+; Watch: crime C-, commute D+, amenities D.
- Midland ISD (urban): math 34% / reading 36% proficiency, ranked #477 of 826 in TX (top 58%) — families likely to look elsewhere, expect single-tenant / working-renter base with shorter leases.
- Zoned schools: Jones El (math 22% / reading 27%, grade F, #3,052 of 4,322 statewide, top 74%, 448 students, 69% FRL); Alamo J H (math 23% / reading 32%, grade F, #1,156 of 1,662 statewide, top 71%, 865 students, 62% FRL); Legacy H S (math 37% / reading 3%, grade F, #1,397 of 1,632 statewide, top 87%, 2,504 students, 41% FRL).
- Market conditions: Rents soft (-0.3%/yr); 66 active listings in the ZIP; 40 comparable units currently listed for rent nearby; rentals at typical pace (median 24d on market — plan ~3-4 weeks tenant-placement turnaround); 45% of comp listings sitting > 30 days — soft ceiling on asking rent; solid renter incomes; 1,504 units permitted in Midland County in 2024 (0 in 5+ unit buildings).
- This rent runs 35% of the median local income ($77k/yr) — at the standard rent-burdened threshold; future hikes will face affordability resistance.
Forward outlook
- Local home prices are declining (-3.0%/yr); year-one equity from $2k of loan paydown is wiped out by about $7k of value loss. Plan a longer hold.
- Midland County population projected at +83% by 2050 — long-run rental-demand tailwind backs the buy-and-hold thesis.
Negotiation context
- It's been on market 22 days — a 2% lower offer ($239k) is reasonable based on typical stale-listing flexibility.
Risks & watch-outs
- Climate carrying-cost: severe wildfire risk; extreme-heat days projected 7→21/yr by 2055 (HVAC capex compounding) — expect insurance premiums to compound above CPI over the hold.
Questions for the listing agent
- Built in 1979 — when were the roof, HVAC, electrical panel, plumbing, and water heater last replaced?
- Is there a deadline driving the sale (1031 exchange, divorce, estate, relocation)? That informs how much negotiation room exists.
- The area grade is low — what's the realistic commute time and amenity access for the typical tenant pool here? Any planned neighborhood developments (good or bad) we should know about?
- What's the average days-on-market for RENTAL listings here right now (not sales)? A rising rental-DOM trend means longer vacancies and softer asking-rent achievability than the comps imply.
- What's the recent tenant-quality profile in this submarket — average credit score on applications, eviction rate, late-payment / NSF rate, and stable-employment percentage? A property-management company in the area should have these aggregated.
- How much new for-sale + rental construction is in the pipeline within 1–3 miles? Heavy new supply typically softens prices + rents 12–24 months out; constrained supply supports both.
Investment metrics
- 1% rule
- 0.93% ✗
- Cap rate
- 7.10%
- Cash-on-cash
- 2.90%
- DSCR
- 1.13
- GRM
- 8.9
CMA / ARV
No comps found within radius.
Projected returns pro-forma
-3.0% appreciation · 0.0% rent growth · sell at horizon
- IRR
- -15.1%
- Equity multiple
- 0.48×
- Total profit
- $-35,489
- Equity at exit
- $36,158
- IRR
- -12.4%
- Equity multiple
- 0.37×
- Total profit
- $-43,101
- Equity at exit
- $20,967
Cash invested: $67,900 (down + closing). Projections, not guarantees.
Landlord ↔ Tenant lean methodology
- Overall (STATE)
- 87 Strongly Landlord-Friendly
- State Texas
- 87 Strongly Landlord-Friendly · R+5
- County
- — inherits STATE
- City
- — inherits STATE
ZIP-level market 79703
- Rents YoY
- -0.3%
- Active inventory
- 66
- Price-to-rent
- 8.9×
Monthly cashflow live
- Estimated rent
- $2,266 high interval (Pro) →
- Mortgage (P&I)
- −$1,272
- Tax from tax record
- −$253 /mo · $3,038/yr
- Insurance
- −$101
- HOA
- −$0
- Lot rent
- −$0
- Vacancy / Maint / Mgmt
- −$476
- Net cashflow
- $164
Break-even live
Sensitivity live
| Price | -10% $301 | -5% $233 | +0% $164 | +5% $95 | +10% $27 |
|---|---|---|---|---|---|
| Rent | -10% $-15 | -5% $74 | +0% $164 | +5% $253 | +10% $343 |
| Rate | -1.0pp $286 | -0.5pp $226 | base $164 | +0.5pp $101 | +1.0pp $37 |
UW: 25.0% down · 7.5% · 30yr · 1.5% tax · 5.0% vac · 8.0% maint · 8.0% mgmt
Financing live
Cash to close
- Down payment
- $60,625
- Closing costs
- $7,275
- Reserves months
- —
- Total cash needed
- —
Loan-product check · same deal, 3 products live
Conventional
25% down · 7.5% · 30yr
- Down + closing
- —
- Monthly P&I
- —
- Monthly cashflow
- —
- DSCR
- —
- Eligible?
- —
Personal DTI + credit; lowest rate.
DSCR
20% down · 8.5% · 30yr
- Down + closing
- —
- Monthly P&I
- —
- Monthly cashflow
- —
- DSCR
- —
- Eligible?
- —
No personal income docs; deal must DSCR.
Hard money
10% down · 12.0% · 12mo
- Down + closing
- —
- Monthly P&I
- —
- Monthly cashflow
- —
- DSCR
- —
- Eligible?
- —
Short-term bridge; refi at stabilization.
Rent comps 40 comps
| Address | Beds | Baths | Sqft | Rent | $/sqft | DOM | Units | Dist |
|---|---|---|---|---|---|---|---|---|
| 5202 Ric Dr Midland, TX | 3.0 | 2.0 | 1258 | $1,975 | $1.57 | 23d | 1 | 0.20mi |
| 303 Koufax Ct Midland, TX | 4.0 | 2.0 | 2096 | $2,950 | $1.41 | 23d | 1 | 0.61mi |
| 4610 Storey Ave Midland, TX | 3.0 | 2.0 | 1184 | $1,899 | $1.60 | 23d | 1 | 0.64mi |
| 5109 Graceland Dr Unit A Midland, TX | 3.0 | 2.0 | 1365 | $2,250 | $1.65 | 46d | 1 | 0.66mi |
| 5205 Blue Haven Dr Midland, TX | 4.0 | 2.0 | 1539 | $6,000 | $3.90 | 46d | 1 | 0.71mi |
| 4603 Mercedes Dr Midland, TX | 3.0 | 2.0 | 1665 | $2,199 | $1.32 | 23d | 1 | 0.73mi |
| 704 Nolan Ryan Dr Midland, TX | 3.0 | 2.0 | 1454 | $2,500 | $1.72 | 46d | 1 | 0.73mi |
| 4732 Harvard Ave Midland, TX | 3.0 | 2.0 | 2248 | $2,600 | $1.16 | 23d | 1 | 0.75mi |
| 4506 Storey Ave Midland, TX | 3.0 | 1.0 | 1400 | $1,650 | $1.18 | 16d | 1 | 0.75mi |
| 4515 Monty Dr Midland, TX | 4.0 | 2.0 | 1853 | $2,400 | $1.30 | 46d | 1 | 0.77mi |
| 4525 Crockett Ave Midland, TX | 2.0 | 2.0 | 1400 | $4,250 | $3.04 | 23d | 1 | 0.78mi |
| 805 Nolan Ryan Dr Midland, TX | 3.0 | 2.0 | 1630 | $2,450 | $1.50 | 23d | 1 | 0.79mi |
| 4519 Crockett Ave Midland, TX | 2.0 | 2.0 | 1465 | $1,900 | $1.30 | 23d | 1 | 0.80mi |
| 509 Wagner Dr Midland, TX | 4.0 | 2.0 | 2085 | $3,000 | $1.44 | 46d | 1 | 0.81mi |
| 5919 Mile High Ln Midland, TX | 3.0 | 2.0 | 1758 | $2,600 | $1.48 | 23d | 1 | 0.81mi |
| 4409 Roosevelt Dr Midland, TX | 3.0 | 2.0 | 1230 | $1,750 | $1.42 | 47d | 1 | 0.82mi |
| 4503 Crockett Ave Unit B Midland, TX | 2.0 | 2.0 | 1250 | $2,000 | $1.60 | 46d | 1 | 0.85mi |
| 909 Beal Pkwy Midland, TX | 3.0 | 2.0 | 1670 | $2,200 | $1.32 | 23d | 1 | 0.89mi |
| 6011 Mile High Ln Midland, TX | 3.0 | 2.0 | 1763 | $2,550 | $1.45 | 46d | 1 | 0.91mi |
| 6020 Spahn St Midland, TX | 4.0 | 2.0 | 1849 | $2,800 | $1.51 | 46d | 1 | 0.93mi |
| 4405 Crockett Ave Unit A Midland, TX | 3.0 | 2.0 | 1100 | $1,800 | $1.64 | 46d | 1 | 0.93mi |
| 5801 Deauville Midland, TX | 1.0–2.0 | 1.0–2.0 | 914 | $2,247 | $2.46 | 16d | 22 | 0.94mi |
| 4403 Crockett Ave Unit A Midland, TX | 3.0 | 2.0 | 1065 | $1,800 | $1.69 | 23d | 1 | 0.95mi |
| 6102 Mile High Ln Midland, TX | 3.0 | 2.0 | 1763 | $2,500 | $1.42 | 46d | 1 | 0.96mi |
| 4317 Tanner Dr Unit A Midland, TX | 4.0 | 2.0 | 2220 | $2,650 | $1.19 | 23d | 1 | 0.97mi |
| 4313 Storey Ave Unit A Midland, TX | 3.0 | 2.0 | 1255 | $2,000 | $1.59 | 46d | 1 | 1.05mi |
| 1008 Rangers Ct Midland, TX | 3.0 | 2.0 | 1662 | $2,250 | $1.35 | 16d | 1 | 1.12mi |
| 509 Delmar St Midland, TX | 1.0–2.0 | 1.0–2.5 | 1116 | $1,796 | $1.61 | 16d | 8 | 1.13mi |
| 711 Candlestick Dr Midland, TX | 3.0 | 2.0 | 1512 | $2,400 | $1.59 | 46d | 1 | 1.15mi |
| 711 Candlestick Dr Midland, TX | 3.0 | 2.0 | 1512 | $2,400 | $1.59 | 23d | 1 | 1.15mi |
| 4600 Andrews Hwy Midland, TX | 1.0–3.0 | 1.0–2.0 | 1117 | $2,590 | $2.32 | 46d | 5 | 1.20mi |
| 907 Candlestick Dr Midland, TX | 3.0 | 2.0 | 1715 | $2,500 | $1.46 | 16d | 1 | 1.20mi |
| 6406 Hall of Fame Blvd Midland, TX | 3.0 | 2.0 | 1718 | $2,850 | $1.66 | 16d | 1 | 1.21mi |
| 5313 Freedom Ct Midland, TX | 3.0 | 2.0 | 1794 | $2,550 | $1.42 | 23d | 1 | 1.29mi |
| 619 Victory Pkwy Midland, TX | 4.0 | 2.0 | 1824 | $3,200 | $1.75 | 16d | 1 | 1.31mi |
| 6418 Patriot Pkwy Midland, TX | 4.0 | 2.0 | 2178 | $3,200 | $1.47 | 46d | 1 | 1.35mi |
| 3811 Cedar Spring Dr Midland, TX | 4.0 | 2.0 | 1500 | $2,600 | $1.73 | 46d | 1 | 1.35mi |
| 3607 W Michigan Ave Midland, TX | 3.0 | 2.0 | 1535 | $2,500 | $1.63 | 23d | 1 | 1.37mi |
| 6606 Colony Rd Midland, TX | 3.0 | 2.0 | 1993 | $2,600 | $1.30 | 46d | 1 | 1.45mi |
| 6615 Colony Rd Midland, TX | 4.0 | 2.0 | 1916 | $2,900 | $1.51 | 46d | 1 | 1.48mi |
Listing history 20 events
-
2026-06-22status $242,500 Pending 22 DOM
-
2026-06-19days on market $242,500 Active Under Contract 22 DOM
-
2026-06-18days on market $242,500 Active Under Contract 21 DOM
-
2026-06-17days on market $242,500 Active Under Contract 20 DOM
-
2026-06-16days on market $242,500 Active Under Contract 19 DOM
-
2026-06-15days on market $242,500 Active Under Contract 18 DOM
-
2026-06-14days on market $242,500 Active Under Contract 16 DOM
-
2026-06-13days on market $242,500 Active Under Contract 15 DOM
-
2026-06-10days on market $242,500 Active Under Contract 13 DOM
-
2026-06-09days on market $242,500 Active Under Contract 12 DOM
-
2026-06-08days on market $242,500 Active Under Contract 11 DOM
-
2026-06-07days on market $242,500 Active Under Contract 10 DOM
-
2026-06-03days on market $242,500 Active Under Contract 6 DOM
-
2026-06-02statusdays on market $242,500 Active Under Contract 5 DOM
-
2026-06-01days on market $242,500 Active 4 DOM
-
2026-05-31days on market $242,500 Active 3 DOM
-
2026-05-30days on market $242,500 Active 2 DOM
-
2026-05-28$242,500 Active
-
2022-02-23soldstatus
-
1989-10-27soldstatus
ⓘ Source: listings_history table (triggers on properties + properties_extension) + one-shot
backfill from property_details.listing_events for pre-trigger history.
Tax reassessment forecast TX · Resets to sale price
- Current annual tax
- $3,038 · $253/mo
- Projected year-2 tax
- $4,438 · $370/mo
- Expected delta
- +$1,400/yr (+$117/mo · 46.1%)
ⓘ Screening estimate from a state-policy table — verify with the county assessor before closing.
Climate risk First Street
- Flood 1/10 Low FEMA zone X · 0% chance over 30 yrs
- Wildfire 8/10 Severe
- Heat 6/10 Major 7 d/yr ≥101°F today · 21 d/yr by 30 yrs out
- Wind 2/10 Low 3% chance of damaging wind over 30 yrs
- Air quality 1/10 Low 0 unhealthy d/yr today · 0 by 30 yrs out
Nearby sold comps map
Loading sold comps map…
Walkable amenities ~0.75 mi
Loading nearby amenities…
Taxation est. · year 1
- Rental income
- $27,187
- − Mortgage interest
- −$13,584
- − Property taxes
- −$3,038
- − Insurance
- −$1,212
- − Repairs & maintenance
- −$2,175
- − Management
- −$2,175
- − Depreciation
- −$7,055
- Taxable loss
- −$2,051
- Est. tax savings @ 24.0%
- +$492
- After-tax cash flow
- $2,460/yr
For passive investors: Depreciation is non-cash, so a rental often shows a tax loss while cash-flowing — sheltering income. Rental losses are passive: they offset passive income freely, and up to $25,000/yr can offset ordinary (W-2) income if you actively participate and your MAGI is under $100k (phasing out to $0 by $150k); unused losses carry forward. On sale, claimed depreciation is recaptured at up to 25%, and gains may owe capital-gains tax (a 1031 exchange can defer both). Figures are a year-1 estimate at your 24.0% rate — not tax advice; consult a CPA.
Schools (NCES district)
- District
- Midland ISD
- NCES district ID
- 4830570
- Math proficiency
- 34% ▼ -7.00%
- Reading proficiency
- 36% ▬ 0.00%
- Median HH income
- $63,457
- Composite
- 31.63/100
- National rank
- #5938
- State rank
- #477 of 826 in TX
Livability — Midland
- Score
- 79/100
- State rank
- #57
- US rank
- #2192
Category grades
Schools grade is shown separately in the Schools card above.
Census & demographics
- Census place
- Midland, TX
- County
- Midland County · 168,494 people
- City population
- 168,494
- Metro
- Midland, TX
- Population (ZIP)
- 20,419
- Household income
- $77,285
- Rent vs Own
- Severe rent burden
- 417.0
Population outlook (Midland County) Hauer SSP2
- Today (2025)
- 220,895 people
- By 2030
- 253,667 · +14.8%
- By 2040
- 325,498 · +47.4%
- By 2050
- 404,168 · +83.0%
- By 2075
- 609,802 · +176.1%
- By 2100
- 760,172 · +244.1%
Race, ethnicity, and origin ACS 2023
- Neighborhood character
- Diverse neighborhood (Simpson 0.59)
- Race & ethnicity
- Hispanic / Latino 54% White 34% Two or more races 16% Black 8% Asian 2%
- Hispanic origin (detail)
- Mexican 45% Cuban 4%
- Common ancestry
- Slovak 1% Italian 1% Serbian 1%
- Foreign-born
- 20% · Canada, Jamaica, Vietnam
- Languages at home
- 58% English-only · Spanish 38% Arabic 1% Chinese 1%
Political lean MEDSL · Midland
- 2024 margin
- Solid R (+60.5) · D 19.3% · R 79.8%
- 2008→2024 swing
- -3.3pp toward R · 2008: -57.3pp · 2024: -60.5pp
- All cycles
- 2024: R+60.5 2020: R+56.6 2016: R+55.2 2012: R+61.5 2008: R+57.3
Not yet ingested
- Civics
- —
Market trends
- HPI YoY
- ▼ -250.72%
- Current HPI
- 224.6222
- Rent YoY
- ▼ -0.33%
- Metro
- Midland, TX
- State GDP YoY
- ▲ 3.95%
- F500 in state
- 110
Industry mix (Fortune 500 HQ in TX)
| Industry | F500 HQs | Revenue |
|---|---|---|
| Energy | 16 | $1,198B |
|
||
| Technology | 5 | $198B |
|
||
| Engineering / Construction | 4 | $72B |
|
||
| Energy Services | 3 | $60B |
|
||
| Utilities | 3 | $41B |
|
||
| Healthcare | 2 | $330B |
|
||
Price history
3 events — show timeline
- 2026-05-28 Listed $242,500 PBBOR
- 2022-02-23 Sold (Public Records) — Public Records
- 1989-10-27 Sold (Public Records) — Public Records
Property tax history
+0.7%/yrLatest (2025): $3,038 · -4.9% YoY. Source: county tax records.
Cash-flow waterfall
monthlySold comps — $/sqft
last 12 mo · ≤1 miLoading sold comps…