13 Mill St · Bonne Terre, MO
Flood risk 1/10 · Minimal
- FEMA flood zone
- X (unshaded)
- Chance of flooding over 30 yrs
- 0.0%
- Est. flood insurance / yr
- $473 – $860
Fire risk 4/10 · Minor
- Est. fire insurance / yr
- $1,054 – $1,958
Heat risk 5/10 · Moderate
- Hot days now (above 105°F)
- 7 days/yr
- Hot days in 30 yrs
- 21 days/yr
Wind risk 2/10 · Minimal
- Chance of severe wind over 30 yrs
- 1.0%
Air-quality risk 1/10 · Minimal
- Unhealthy air days now
- 0 days/yr
- Unhealthy air days in 30 yrs
- 0 days/yr
Risk factors via First Street. Map © Google.
Why this score? — see what drove the C- grade
The composite is a weighted blend of 9 inputs, each scored 0–100. Each bar is that input's sub-score; the figure is the points it added to the 100-point composite (weight × sub-score).
- Cash flow +22.0/30.0
- ARV discount +7.5/15.0
- DSCR +7.0/10.0
- 1% rule +5.0/10.0
- Schools +3.0/10.0
- Livability +2.8/5.0
- Rent growth +2.5/5.0
- Condition / age +2.5/5.0
- Appreciation +0.0/10.0
$125,000
🖨 Deal sheet 📄 Offer letter ✓ Due diligence
Listing remarks
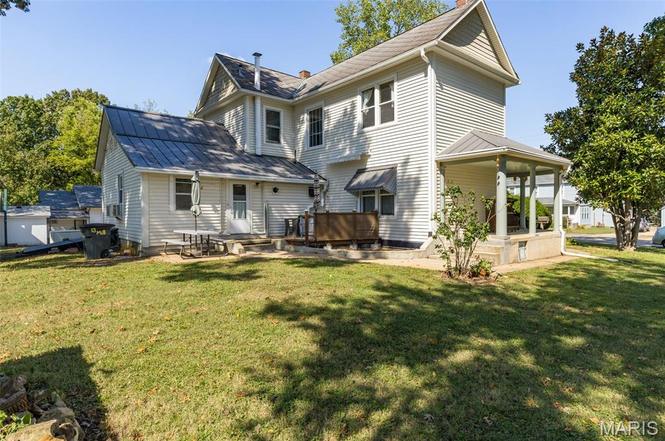
Investor special with serious upside in the heart of Bonne Terre! This 1890-built two-story offers over 2,300 sq ft on a large 0.73-acre city lot—now priced to allow room for renovation and profit. With strong bones and standout historic features like original hardwood floors, tall ceilings, detailed millwork, and cast-iron radiators, this property is a prime candidate for a flip, rental conversion, or long-term hold. The layout includes 4 large bedrooms, 2 full baths (upper bath needs repair), formal living and dining areas, and a spacious kitchen ready for updates. Generous room sizes and flexible spaces make it ideal for maximizing after-repair value. Main-level laundry and a funct
Key facts
- 0.73 acre lot
- Parking
- Built 1890
Property features AI
Finance
- Financial info: Lease not considered
Exterior
- Parking: Carport (1 space); Additional carports
- Utilities: Public water; Public sewer; Single-phase electric with 220 volts; Cable available, Phone available, Electricity connected, Natural gas connected, Sewer connected, Water connected
- Home design: Single-family residence; Two levels
- Construction: Vinyl siding; Metal and slate roof
- Exterior features: Covered front porch; Side porch; Wrap-around porch; Patio; Exterior storage; Workshop; City lot
Interior
- Kitchen: Gas oven, Gas range, Refrigerator
- Bedrooms: 4 bedrooms total — 1 on the main level, 3 on the upper level
- Bathrooms: 1 full bathroom on the main level; Additional upper-level bathroom needs repair/updating
- Heating & cooling: Natural gas heating with radiant system; Window air conditioning units
- Interior features: High ceilings; Partial basement
- Laundry & utility: Main-level laundry room
Neighborhood map
What this means for you Summary
Snapshot
- This is a 3-bed/1.0-bath other listed at $125k.
Deal economics
- At list price, monthly cash flow is $198 ($2k/yr) — positive.
- The deal already cash-flows at list — no discount required.
- Meets the 1% rule at list price ($1k rent vs $125k).
- Recommended offer: $110k (12.0% below list) — sets the bar for market timing.
- Cap rate 8.2% vs local median 4.4% in Bonne Terre — top-decile yield for the area; either an underpriced asset or a hidden risk that comps aren't pricing in. Stress-test before assuming the spread holds.
Location & tenants
- Location reads 56/100 on livability (#721 in MO) — a working-class tenant base; expect higher turnover. Strengths: cost of living A+, housing A+, crime B+; Watch: employment D, amenities F, commute F.
- North St. Francois County R-I (town): math 29% / reading 42% proficiency, ranked #214 of 324 in MO (top 66%) — families likely to look elsewhere, expect single-tenant / working-renter base with shorter leases.
- Zoned schools: North Co. Sr. High (math 25% / reading 56%, grade F, #240 of 521 statewide, top 46%, 873 students, 48% FRL) — zoned schools at 48% FRL track the district average.
- Market conditions: 131 active listings in the ZIP; 134 units permitted in St. Francois County in 2024 (32 in 5+ unit buildings).
Forward outlook
- Local home prices are declining (-3.0%/yr); year-one equity from $864 of loan paydown is wiped out by about $4k of value loss. Plan a longer hold.
Negotiation context
- It's been on market 236 days — a 12% lower offer ($110k) is reasonable based on typical stale-listing flexibility.
- 2 sale attempts; this cycle's ask has dropped $75k (37%) from the opening price — seller is motivated, your offer sets the floor, not the list.
Risks & watch-outs
- Watch-outs: built in 1890 — expect roof / HVAC / electrical / plumbing capex.
- Climate carrying-cost: extreme-heat days projected 7→21/yr by 2055 (HVAC capex compounding) — expect insurance premiums to compound above CPI over the hold.
Questions for the listing agent
- It's been on market 236 days. Have you received any prior offers? Is the seller open to a 12% concession, seller financing, or rate buy-down credit?
- Built in 1890 — when were the roof, HVAC, electrical panel, plumbing, and water heater last replaced?
- Why hasn't it sold? Are there any deal-killer items the seller is aware of (foundation, flood, title, zoning, code violations)?
- Is there a deadline driving the sale (1031 exchange, divorce, estate, relocation)? That informs how much negotiation room exists.
- Schools are F-rated, which usually means shorter tenancies and higher turnover. Who's the typical renter profile here, and what's been the actual vacancy rate?
- What's the average days-on-market for RENTAL listings here right now (not sales)? A rising rental-DOM trend means longer vacancies and softer asking-rent achievability than the comps imply.
- What's the recent tenant-quality profile in this submarket — average credit score on applications, eviction rate, late-payment / NSF rate, and stable-employment percentage? A property-management company in the area should have these aggregated.
- How much new for-sale + rental construction is in the pipeline within 1–3 miles? Heavy new supply typically softens prices + rents 12–24 months out; constrained supply supports both.
Investment metrics
- 1% rule
- 1.00% ✓
- Cap rate
- 8.19%
- Cash-on-cash
- 6.79%
- DSCR
- 1.30
- GRM
- 8.3
CMA / ARV
No comps found within radius.
Projected returns pro-forma
-3.0% appreciation · 3.0% rent growth · sell at horizon
- IRR
- -5.9%
- Equity multiple
- 0.78×
- Total profit
- $-7,663
- Equity at exit
- $18,638
- IRR
- 3.7%
- Equity multiple
- 1.27×
- Total profit
- $9,469
- Equity at exit
- $10,808
Cash invested: $35,000 (down + closing). Projections, not guarantees.
Landlord ↔ Tenant lean methodology
- Overall (STATE)
- 81 Strongly Landlord-Friendly
- State Missouri
- 81 Strongly Landlord-Friendly · R+10
- County
- — inherits STATE
- City
- — inherits STATE
ZIP-level market 63628
- Home prices YoY
- -7.2%
- Active inventory
- 131
- Price-to-rent
- 8.3×
Monthly cashflow live
- Estimated rent
- $1,251 medium interval (Pro) →
- Mortgage (P&I)
- −$656
- Tax from tax record
- −$82 /mo · $989/yr
- Insurance
- −$52
- HOA
- −$0
- Vacancy / Maint / Mgmt
- −$263
- Net cashflow
- $198
Break-even live
UW: 25.0% down · 7.5% · 30yr · 1.5% tax · 5.0% vac · 8.0% maint · 8.0% mgmt
Financing live
Cash to close
- Down payment
- $31,250
- Closing costs
- $3,750
- Reserves months
- —
- Total cash needed
- —
Loan-product check · same deal, 3 products live
Conventional
25% down · 7.5% · 30yr
- Down + closing
- —
- Monthly P&I
- —
- Monthly cashflow
- —
- DSCR
- —
- Eligible?
- —
Personal DTI + credit; lowest rate.
DSCR
20% down · 8.5% · 30yr
- Down + closing
- —
- Monthly P&I
- —
- Monthly cashflow
- —
- DSCR
- —
- Eligible?
- —
No personal income docs; deal must DSCR.
Hard money
10% down · 12.0% · 12mo
- Down + closing
- —
- Monthly P&I
- —
- Monthly cashflow
- —
- DSCR
- —
- Eligible?
- —
Short-term bridge; refi at stabilization.
Listing history 19 events
-
2026-06-18days on market $125,000 Active 236 DOM
-
2026-06-17days on market $125,000 Active 235 DOM
-
2026-06-16days on market $125,000 Active 234 DOM
-
2026-06-15days on market $125,000 Active 233 DOM
-
2026-06-13pricedays on market $125,000 Active 231 DOM
-
2026-06-12days on market $149,900 Active 230 DOM
-
2026-06-09days on market $149,900 Active 227 DOM
-
2026-06-08days on market $149,900 Active 226 DOM
-
2026-06-07days on market $149,900 Active 225 DOM
-
2026-06-07days on market $149,900 Active 224 DOM
-
2026-06-04days on market $149,900 Active 221 DOM
-
2026-06-02days on market $149,900 Active 220 DOM
-
2026-06-01days on market $149,900 Active 219 DOM
-
2026-05-31days on market $149,900 Active 218 DOM
-
2026-04-01status Active
-
2026-03-20price $149,900
-
2025-11-15price $175,000
-
2025-10-24$199,900 Active
-
2025-10-11historical $199,900
ⓘ Source: listings_history table (triggers on properties + properties_extension) + one-shot
backfill from property_details.listing_events for pre-trigger history.
Tax reassessment forecast MO · Resets to sale price
- Current annual tax
- $989 · $82/mo
- Projected year-2 tax
- $1,212 · $101/mo
- Expected delta
- +$224/yr (+$19/mo · 22.6%)
ⓘ Screening estimate from a state-policy table — verify with the county assessor before closing.
Climate risk First Street
- Flood 1/10 Low FEMA zone X (unshaded) · 0% chance over 30 yrs
- Wildfire 4/10 Moderate
- Heat 5/10 Major 7 d/yr ≥105°F today · 21 d/yr by 30 yrs out
- Wind 2/10 Low 100% chance of damaging wind over 30 yrs
- Air quality 1/10 Low 0 unhealthy d/yr today · 0 by 30 yrs out
Nearby sold comps map
Loading sold comps map…
Walkable amenities ~0.75 mi
Loading nearby amenities…
Taxation est. · year 1
- Rental income
- $15,009
- − Mortgage interest
- −$7,002
- − Property taxes
- −$989
- − Insurance
- −$625
- − Repairs & maintenance
- −$1,201
- − Management
- −$1,201
- − Depreciation
- −$3,636
- Taxable income
- $356
- Est. tax owed @ 24.0%
- −$85
- After-tax cash flow
- $2,292/yr
For passive investors: Depreciation is non-cash, so a rental often shows a tax loss while cash-flowing — sheltering income. Rental losses are passive: they offset passive income freely, and up to $25,000/yr can offset ordinary (W-2) income if you actively participate and your MAGI is under $100k (phasing out to $0 by $150k); unused losses carry forward. On sale, claimed depreciation is recaptured at up to 25%, and gains may owe capital-gains tax (a 1031 exchange can defer both). Figures are a year-1 estimate at your 24.0% rate — not tax advice; consult a CPA.
Schools (NCES district)
- District
- North St. Francois County R-I
- NCES district ID
- 2905430
- Math proficiency
- 29% ▼ -15.00%
- Reading proficiency
- 42% ▼ -5.00%
- Median HH income
- $40,156
- Composite
- 29.77/100
- National rank
- #6431
- State rank
- #214 of 324 in MO
Livability — Bonne Terre
- Score
- 56/100
- State rank
- #721
- US rank
- #23087
Category grades
Schools grade is shown separately in the Schools card above.
Census & demographics
- Census place
- Bonne Terre, MO
- Population (ZIP)
- 15,864
Population outlook (St. Francois County) Hauer SSP2
- Today (2025)
- 68,683 people
- By 2030
- 69,574 · +1.3%
- By 2040
- 70,665 · +2.9%
- By 2050
- 70,708 · +2.9%
- By 2075
- 67,917 · -1.1%
- By 2100
- 56,563 · -17.6%
Race, ethnicity, and origin ACS 2023
- Neighborhood character
- Predominantly White (87%)
- Race & ethnicity
- White 87% Black 5% Two or more races 5% Asian 1%
- Common ancestry
- Lithuanian 6% Italian 3% Slovak 2%
- Foreign-born
- 1% · Canada
- Languages at home
- 98% English-only · Other Indo-European 1%
Political lean MEDSL · St. Francois
- 2024 margin
- Solid R (+51.4) · D 23.8% · R 75.2%
- 2008→2024 swing
- -46.8pp toward R · 2008: -4.6pp · 2024: -51.4pp
- All cycles
- 2024: R+51.4 2020: R+48.1 2016: R+45.4 2012: R+19.5 2008: R+4.6
Not yet ingested
- Civics
- —
Market trends
- HPI YoY
- ▼ -18.15%
- Current HPI
- 234.0946
- Rent YoY
- —
- Metro
- —
- State GDP YoY
- ▲ 1.84%
- F500 in state
- 20
Industry mix (Fortune 500 HQ in MO)
| Industry | F500 HQs | Revenue |
|---|---|---|
| Healthcare | 1 | $163B |
|
||
| Insurance | 1 | $21B |
|
||
| Industrial Technology | 1 | $17B |
|
||
| Retail | 1 | $16B |
|
||
| Industrial Distribution | 1 | $10B |
|
||
| Utilities | 1 | $9B |
|
||
Price history
-25.0% since first listed5 events — show timeline
- 2026-04-01 Relisted — MARIS as Distributed by MLS Grid
- 2026-03-20 Price Changed $149,900 MARIS as Distributed by MLS Grid
- 2025-11-15 Price Changed $175,000 MARIS as Distributed by MLS Grid
- 2025-10-24 Listed $199,900 MARIS as Distributed by MLS Grid
- 2025-10-11 Coming Soon $199,900 MARIS as Distributed by MLS Grid
Property tax history
+3.9%/yrLatest (2025): $989 · +8.4% YoY. Source: county tax records.
Cash-flow waterfall
monthlySold comps — $/sqft
last 12 mo · ≤1 miLoading sold comps…