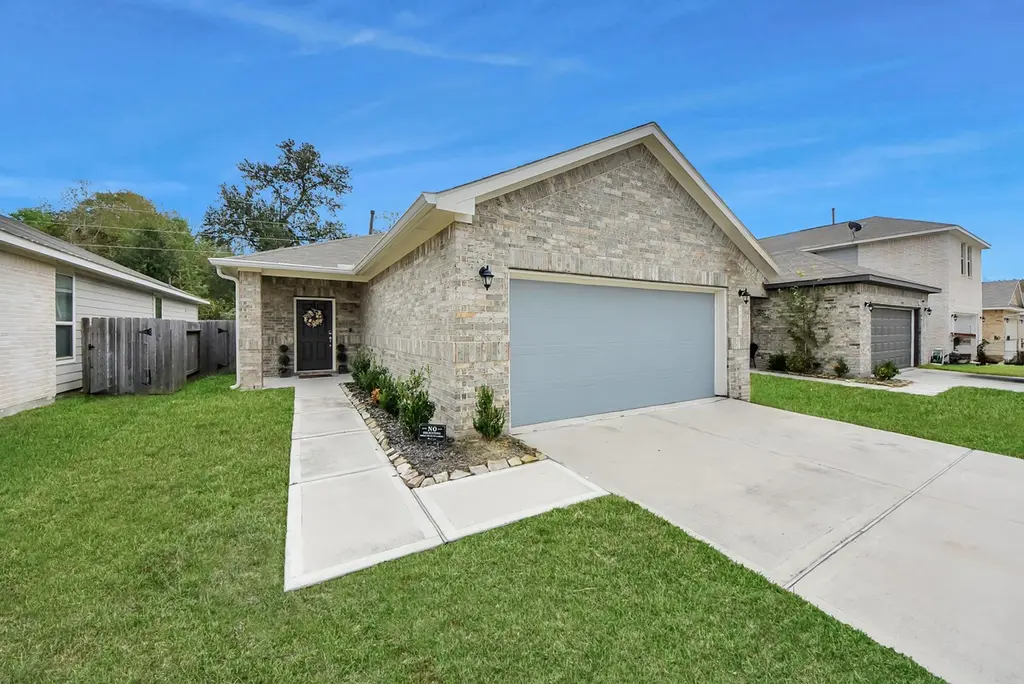
24718 Russet Bluff Trl · Houston, TX
Flood risk 1/10 · Minimal
- FEMA flood zone
- X (unshaded)
- Chance of flooding over 30 yrs
- 0.0%
- Est. flood insurance / yr
- $507 – $1,088
Fire risk 4/10 · Minor
- Est. fire insurance / yr
- $1,222 – $2,270
Heat risk 8/10 · Major
- Hot days now (above 112°F)
- 7 days/yr
- Hot days in 30 yrs
- 24 days/yr
Wind risk 9/10 · Severe
- Chance of severe wind over 30 yrs
- 99.0%
Air-quality risk 2/10 · Minimal
- Unhealthy air days now
- 2 days/yr
- Unhealthy air days in 30 yrs
- 2 days/yr
Risk factors via First Street. Map © Google.
Why this score? — see what drove the D+ grade
The composite is a weighted blend of 9 inputs, each scored 0–100. Each bar is that input's sub-score; the figure is the points it added to the 100-point composite (weight × sub-score).
- ARV discount +15.0/15.0
- Cash flow +10.6/30.0
- 1% rule +5.6/10.0
- Condition / age +4.0/5.0
- Livability +3.7/5.0
- DSCR +3.1/10.0
- Schools +3.1/10.0
- Rent growth +2.5/5.0
- Appreciation +0.7/10.0
$199,999
🖨 Deal sheet 📄 Offer letter ✓ Due diligence
Listing remarks MLS
Welcome to easy, modern living at 24718 Russet Bluff Trail, a Century home build. This light-filled 3-bedroom, 2-bath home offers a smart, open layout designed for everyday comfort and effortless entertaining. The spacious living area flows seamlessly into the kitchen and dining space, featuring granite countertops, ample cabinetry, and room to gather. Large windows and custom blinds throughout create a bright yet private retreat. Step outside to a fully fenced backyard—perfect for weekend barbecues, pets, or relaxing evenings at home. Built in 2021 and move-in ready, this home offers the peace of mind of newer construction with the convenience of nearby shopping, dining, and easy access to Lake Houston area amenities. A fantastic opportunity for anyone seeking a low-maintenance home that’s ready to enjoy from day one.
Key facts
- Ample cabinetry
- Spacious living area
- Newer construction
Tags
Neighborhood map
What this means for you Summary
Snapshot
- This is a 3-bed/2.0-bath single-family listed at $200k. Condition is rated good.
Deal economics
- At list price, monthly cash flow is $-98 ($-1k/yr) — negative.
- To cash-flow at today's rent, offer at most $183k (8.6% below list).
- Meets the 1% rule at list price ($2k rent vs $200k).
- Recommended offer: $183k (8.6% below list) — sets the bar for cash-flow.
- Cap rate 5.7% vs local median 3.2% in Houston — top-decile yield for the area; either an underpriced asset or a hidden risk that comps aren't pricing in. Stress-test before assuming the spread holds.
Location & tenants
- Location reads 74/100 on livability (#184 in TX, #4,771 nationally) — a middle-class / working-renter tenant base. Strengths: amenities A+, cost of living A+, housing A+; Watch: schools D, crime F.
- Huffman ISD (rural): math 32% / reading 35% proficiency, ranked #500 of 826 in TX (top 60%) — families likely to look elsewhere, expect single-tenant / working-renter base with shorter leases.
- Market conditions: 585 active listings in the ZIP; 6 comparable units currently listed for rent nearby; rentals lingering (median 44d on market — plan ~5-8 weeks vacancy on turnover, expect pricing pressure); 67% of comp listings sitting > 30 days — soft ceiling on asking rent; solid renter incomes; 29,883 units permitted in Harris County in 2024 (8,621 in 5+ unit buildings).
Forward outlook
- Local home prices are declining (-3.0%/yr); year-one equity from $1k of loan paydown is wiped out by about $6k of value loss. Plan a longer hold.
- Harris County population projected at +47% by 2050 — long-run rental-demand tailwind backs the buy-and-hold thesis.
Negotiation context
- It's been on market 54 days — a 3% lower offer ($194k) is reasonable based on typical stale-listing flexibility.
- 3 sale attempts since 5y ago; this cycle's ask has dropped $20k (9%) from the opening price — seller is motivated, your offer sets the floor, not the list.
Risks & watch-outs
- Watch-outs: property tax is 3.6% of price.
- Climate carrying-cost: severe wind risk, 99% chance of damaging wind over 30y; extreme-heat days projected 7→24/yr by 2055 (HVAC capex compounding) — expect insurance premiums to compound above CPI over the hold.
Questions for the listing agent
- What do current leases actually rent for vs. the listed asking? Can we see a recent rent roll and the last 12 months of T-12 income?
- It's been on market 54 days. Have you received any prior offers? Is the seller open to a 9% concession, seller financing, or rate buy-down credit?
- Property tax is high relative to price — has the assessment been appealed recently, and will the sale trigger a re-assessment?
- What does the HOA fee cover, when was the last increase, and are there any pending special assessments or reserve-fund shortfalls?
- Is there a deadline driving the sale (1031 exchange, divorce, estate, relocation)? That informs how much negotiation room exists.
- Schools are D-rated, which usually means shorter tenancies and higher turnover. Who's the typical renter profile here, and what's been the actual vacancy rate?
- Crime grade is F in this area — have there been break-ins, vandalism, or insurance claims at this property in the last 3 years? What carrier currently insures it and at what premium?
- The area grade is low — what's the realistic commute time and amenity access for the typical tenant pool here? Any planned neighborhood developments (good or bad) we should know about?
- What's the average days-on-market for RENTAL listings here right now (not sales)? A rising rental-DOM trend means longer vacancies and softer asking-rent achievability than the comps imply.
- What's the recent tenant-quality profile in this submarket — average credit score on applications, eviction rate, late-payment / NSF rate, and stable-employment percentage? A property-management company in the area should have these aggregated.
- How much new for-sale + rental construction is in the pipeline within 1–3 miles? Heavy new supply typically softens prices + rents 12–24 months out; constrained supply supports both.
Investment metrics
- 1% rule
- 1.06% ✓
- Cap rate
- 5.71%
- Cash-on-cash
- -2.10%
- DSCR
- 0.91
- GRM
- 7.9
CMA / ARV
- ARV (median comp)
- $240,257
- List price
- $199,999
- Delta
- -16.76%
- Verdict
- UNDERPRICED
- Comps
- 20 within 1.0 mi
Show comp detail 12 sales within ~0.75 mi
| Address | Dist | Beds/Ba | Sqft | Sold | Price | $/sf | Match |
|---|---|---|---|---|---|---|---|
| 24742 Russet Bluff Trl | 0.05mi | 3/2.0 | 1,367 (-1%) | 12mo | $210,000 | $154 | 86 |
| 723 Pas Trl | 0.45mi | 3/2.0 | 1,365 (-2%) | 4mo | $220,000 | $161 | 73 |
| 24318 Hard Wood Dr | 0.28mi | 3/2.0 | 1,276 (-8%) | 2mo | $190,000 | $149 | 72 |
| 24307 Silver Maple Dr | 0.30mi | 3/2.0 | 1,235 (-11%) | 4mo | $200,000 | $162 | 64 |
| 24311 Silver Maple Dr | 0.30mi | 3/2.0 | 1,235 (-11%) | 5mo | $179,900 | $146 | 64 |
| 526 Emerald Thicket Ln | 0.56mi | 3/2.0 | 1,267 (-9%) | 1mo | $234,990 | $185 | 59 |
| 24709 Stablewood Forest Ct | 0.66mi | 3/2.0 | 1,267 (-9%) | 2mo | $227,990 | $180 | 53 |
| 24717 Stablewood Frst | 0.66mi | 3/2.0 | 1,267 (-9%) | 3mo | $224,990 | $178 | 53 |
| 511 Emerald Thicket Ln | 0.59mi | 3/2.0 | 1,267 (-9%) | 11mo | $234,990 | $185 | 49 |
| 24712 Stablewood Forest Ct | 0.63mi | 3/2.5 | 1,556 (+12%) | 0mo | $180,000 | $116 | 48 |
| 24711 Thornbluff Briar Trl | 0.72mi | 3/2.0 | 1,243 (-10%) | 9mo | $234,990 | $189 | 42 |
| 24034 E Lake Houston Pkwy | 0.74mi | 3/2.0 | 1,558 (+12%) | 4mo | $255,999 | $164 | 41 |
Match score weights: distance 35% · size 25% · config 20% · recency 20%. Top-matched comps best support the ARV.
Projected returns pro-forma
-3.0% appreciation · 3.0% rent growth · sell at horizon
- IRR
- -19.6%
- Equity multiple
- 0.31×
- Total profit
- $-38,367
- Equity at exit
- $29,821
- IRR
- -12.0%
- Equity multiple
- 0.28×
- Total profit
- $-40,330
- Equity at exit
- $17,292
Cash invested: $56,000 (down + closing). Projections, not guarantees.
Landlord ↔ Tenant lean methodology
- Overall (STATE)
- 87 Strongly Landlord-Friendly
- State Texas
- 87 Strongly Landlord-Friendly · R+5
- County
- — inherits STATE
- City
- — inherits STATE
ZIP-level market 77336
- Home prices YoY
- -1.8%
- Active inventory
- 585
- Price-to-rent
- 7.9×
Monthly cashflow live
- Estimated rent
- $2,118 high interval (Pro) →
- Mortgage (P&I)
- −$1,049
- Tax from tax record
- −$606 /mo · $7,270/yr
- Insurance
- −$83
- HOA
- −$33
- Vacancy / Maint / Mgmt
- −$445
- Net cashflow
- $-98
Break-even live
UW: 25.0% down · 7.5% · 30yr · 1.5% tax · 5.0% vac · 8.0% maint · 8.0% mgmt
Financing live
Cash to close
- Down payment
- $50,000
- Closing costs
- $6,000
- Reserves months
- —
- Total cash needed
- —
Loan-product check · same deal, 3 products live
Conventional
25% down · 7.5% · 30yr
- Down + closing
- —
- Monthly P&I
- —
- Monthly cashflow
- —
- DSCR
- —
- Eligible?
- —
Personal DTI + credit; lowest rate.
DSCR
20% down · 8.5% · 30yr
- Down + closing
- —
- Monthly P&I
- —
- Monthly cashflow
- —
- DSCR
- —
- Eligible?
- —
No personal income docs; deal must DSCR.
Hard money
10% down · 12.0% · 12mo
- Down + closing
- —
- Monthly P&I
- —
- Monthly cashflow
- —
- DSCR
- —
- Eligible?
- —
Short-term bridge; refi at stabilization.
Rent comps 6 comps
| Address | Beds | Baths | Sqft | Rent | $/sqft | DOM | Units | Dist |
|---|---|---|---|---|---|---|---|---|
| 24730 Russet Bluff Trl Huffman, TX | 4.0 | 2.0 | 1604 | $2,150 | $1.34 | 1d | 1 | 0.04mi |
| 24719 Colony Meadow Trl Huffman, TX | 4.0 | 2.0 | 1613 | $2,200 | $1.36 | 43d | 1 | 0.12mi |
| 24118 Grey Fox Dr Huffman, TX | 3.0 | 2.0 | 1543 | $1,425 | $0.92 | 43d | 1 | 0.40mi |
| 408 Emerald Thicket Ln Huffman, TX | 3.0 | 2.5 | 1755 | $2,200 | $1.25 | 43d | 1 | 0.70mi |
| 24523 Whitesail Dr Huffman, TX | 3.0 | 2.0 | 1512 | $1,800 | $1.19 | 43d | 1 | 0.87mi |
| 2719 3rd St Huffman, TX | 3.0 | 2.0 | 902 | $655 | $0.73 | 24d | 1 | 1.41mi |
HOA detail
- Monthly dues
- $33 · $396/yr
Listing history 18 events
-
2026-06-13days on market $199,999 Active 54 DOM
-
2026-06-09days on market $199,999 Active 50 DOM
-
2026-06-08days on market $199,999 Active 49 DOM
-
2026-06-07days on market $199,999 Active 48 DOM
-
2026-06-04days on market $199,999 Active 45 DOM
-
2026-06-03days on market $199,999 Active 44 DOM
-
2026-06-02days on market $199,999 Active 43 DOM
-
2026-06-01days on market $199,999 Active 42 DOM
-
2026-05-31days on market $199,999 Active 41 DOM
-
2026-04-20historical
Show marketing remark (842 chars)
Welcome to easy, modern living at 24718 Russet Bluff Trail, a Century home build. This light-filled 3-bedroom, 2-bath home offers a smart, open layout designed for everyday comfort and effortless entertaining. The spacious living area flows seamlessly into the kitchen and dining space, featuring granite countertops, ample cabinetry, and room to gather. Large windows and custom blinds throughout create a bright yet private retreat. Step outside to a fully fenced backyard—perfect for weekend barbecues, pets, or relaxing evenings at home. Built in 2021 and move-in ready, this home offers the peace of mind of newer construction with the convenience of nearby shopping, dining, and easy access to Lake Houston area amenities. A fantastic opportunity for anyone seeking a low-maintenance home that’s ready to enjoy from day one.
-
2026-04-20$219,500 Active 842-char remark
Show marketing remark (842 chars)
Welcome to easy, modern living at 24718 Russet Bluff Trail, a Century home build. This light-filled 3-bedroom, 2-bath home offers a smart, open layout designed for everyday comfort and effortless entertaining. The spacious living area flows seamlessly into the kitchen and dining space, featuring granite countertops, ample cabinetry, and room to gather. Large windows and custom blinds throughout create a bright yet private retreat. Step outside to a fully fenced backyard—perfect for weekend barbecues, pets, or relaxing evenings at home. Built in 2021 and move-in ready, this home offers the peace of mind of newer construction with the convenience of nearby shopping, dining, and easy access to Lake Houston area amenities. A fantastic opportunity for anyone seeking a low-maintenance home that’s ready to enjoy from day one.
-
2026-03-11price $227,000
-
2025-12-01price $230,000
-
2025-12-01$220,000 Active
-
2022-02-28soldstatus Sold
-
2021-10-13status Pending
-
2021-10-07price $228,225
-
2021-09-29$226,225 Active
ⓘ Source: listings_history table (triggers on properties + properties_extension) + one-shot
backfill from property_details.listing_events for pre-trigger history.
Tax reassessment forecast TX · Resets to sale price
- Current annual tax
- $7,270 · $606/mo
- Projected year-2 tax
- $7,270 · $606/mo
- Expected delta
- $0/yr ($0/mo · 0.0%)
ⓘ Screening estimate from a state-policy table — verify with the county assessor before closing.
Climate risk First Street
- Flood 1/10 Low FEMA zone X (unshaded) · 0% chance over 30 yrs
- Wildfire 4/10 Moderate
- Heat 8/10 Severe 7 d/yr ≥112°F today · 24 d/yr by 30 yrs out
- Wind 9/10 Extreme 99% chance of damaging wind over 30 yrs
- Air quality 2/10 Low 2 unhealthy d/yr today · 2 by 30 yrs out
Nearby sold comps map
Loading sold comps map…
Walkable amenities ~0.75 mi
Loading nearby amenities…
Taxation est. · year 1
- Rental income
- $25,415
- − Mortgage interest
- −$11,203
- − Property taxes
- −$7,270
- − Insurance
- −$1,000
- − Repairs & maintenance
- −$2,033
- − Management
- −$2,033
- − HOA
- −$396
- − Depreciation
- −$5,818
- Taxable loss
- −$4,338
- Est. tax savings @ 24.0%
- +$1,041
- After-tax cash flow
- $-132/yr
For passive investors: Depreciation is non-cash, so a rental often shows a tax loss while cash-flowing — sheltering income. Rental losses are passive: they offset passive income freely, and up to $25,000/yr can offset ordinary (W-2) income if you actively participate and your MAGI is under $100k (phasing out to $0 by $150k); unused losses carry forward. On sale, claimed depreciation is recaptured at up to 25%, and gains may owe capital-gains tax (a 1031 exchange can defer both). Figures are a year-1 estimate at your 24.0% rate — not tax advice; consult a CPA.
Condition & rehab AI · 12 photos
This move-in ready home offers a modern, open layout with good condition throughout. It's a great opportunity for investors looking to add value with minor updates.
Value-add opportunities
- Both Painting exterior and interior walls — Fresh paint enhances curb appeal and interior aesthetics
- Both Landscaping improvements — Enhances curb appeal and adds value
- Resale Kitchen backsplash — Modern backsplash can add visual interest and functionality
- Resale Bathroom vanity — Modern vanity can enhance the bathroom's appearance and functionality
Renovation cost estimate screening
Value-add ROI direction
- Both Painting exterior and interior walls — Fresh paint enhances curb appeal and interior aesthetics ↑
- Both Landscaping improvements — Enhances curb appeal and adds value ↑
- Resale Kitchen backsplash — Modern backsplash can add visual interest and functionality ↑
- Resale Bathroom vanity — Modern vanity can enhance the bathroom's appearance and functionality ↑
ⓘ Cost ranges are severity-bucket heuristics (US national rule-of-thumb). Get contractor quotes + a written scope before underwriting a rehab budget.
Schools (NCES district)
- District
- Huffman ISD
- NCES district ID
- 4823820
- Math proficiency
- 32% ▼ -9.00%
- Reading proficiency
- 35% ▼ -9.00%
- Median HH income
- $65,848
- Composite
- 30.61/100
- National rank
- #6195
- State rank
- #500 of 826 in TX
Livability — Houston
- Score
- 74/100
- State rank
- #184
- US rank
- #4771
Category grades
Schools grade is shown separately in the Schools card above.
Census & demographics
- Census place
- Houston, TX
- County
- Harris County · 4,702,590 people
- City population
- 3,226,434
- Metro
- Houston-The Woodlands-Sugar Land, TX
- Population (ZIP)
- 14,342
- Household income
- $96,404
- Rent vs Own
- Severe rent burden
- 377.0
Population outlook (Harris County) Hauer SSP2
- Today (2025)
- 5,571,493 people
- By 2030
- 6,089,821 · +9.3%
- By 2040
- 7,142,806 · +28.2%
- By 2050
- 8,185,864 · +46.9%
- By 2075
- 10,574,329 · +89.8%
- By 2100
- 12,109,958 · +117.4%
Race, ethnicity, and origin ACS 2023
- Neighborhood character
- Majority White (65%)
- Race & ethnicity
- White 65% Hispanic / Latino 23% Two or more races 9% Black 5% Native American 4%
- Hispanic origin (detail)
- Mexican 20%
- Common ancestry
- Lithuanian 4% Slovak 2% Romanian 2%
- Foreign-born
- 9% · Canada
- Languages at home
- 79% English-only · Spanish 18% Other Indo-European 2%
Political lean MEDSL · Harris
- 2024 margin
- Lean D (+5.5) · D 52.0% · R 46.4% · Other 1.6%
- 2008→2024 swing
- +3.9pp toward D · 2008: 1.6pp · 2024: 5.5pp
- All cycles
- 2024: D+5.5 2020: D+13.3 2016: D+12.4 2012: D+0.1 2008: D+1.6
Not yet ingested
- Civics
- —
Market trends
- HPI YoY
- ▼ -8.59%
- Current HPI
- 472.03
- Rent YoY
- —
- Metro
- Houston-The Woodlands-Sugar Land, TX
- State GDP YoY
- ▲ 3.95%
- F500 in state
- 110
Industry mix (Fortune 500 HQ in TX)
| Industry | F500 HQs | Revenue |
|---|---|---|
| Energy | 16 | $1,198B |
|
||
| Technology | 5 | $198B |
|
||
| Engineering / Construction | 4 | $72B |
|
||
| Energy Services | 3 | $60B |
|
||
| Utilities | 3 | $41B |
|
||
| Healthcare | 2 | $330B |
|
||
Price history
-3.0% since first listed9 events — show timeline
- 2026-04-20 Listed $219,500 HARMLS
- 2026-04-20 Listing Removed — HARMLS
- 2026-03-11 Price Changed $227,000 HARMLS
- 2025-12-01 Price Changed $230,000 HARMLS
- 2025-12-01 Listed $220,000 HARMLS
- 2022-02-28 Sold (MLS) — HARMLS
- 2021-10-13 Pending — HARMLS
- 2021-10-07 Price Changed $228,225 HARMLS
- 2021-09-29 Listed $226,225 HARMLS
Property tax history
+72.6%/yrLatest (2025): $7,270 · +1.5% YoY. Source: county tax records.
Cash-flow waterfall
monthlySold comps — $/sqft
last 12 mo · ≤1 miLoading sold comps…