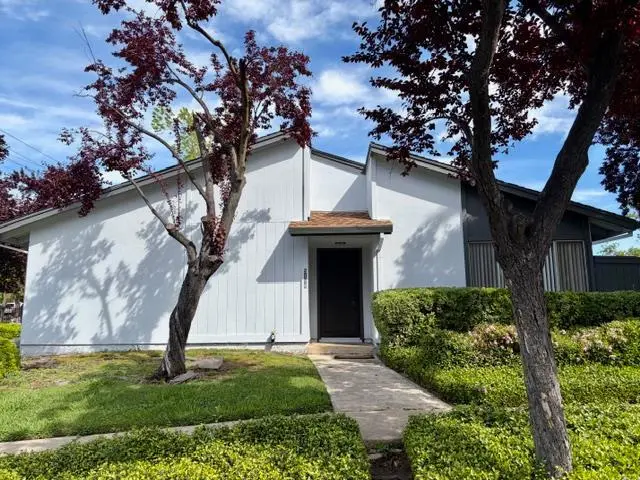
5186 Greenberry Dr · Carmichael, CA
Flood risk 1/10 · Minimal
- FEMA flood zone
- X (unshaded)
- Chance of flooding over 30 yrs
- 0.0%
- Est. flood insurance / yr
- $507 – $1,088
Fire risk 1/10 · Minimal
- Est. fire insurance / yr
- $659 – $1,223
Heat risk 7/10 · Major
- Hot days now (above 102°F)
- 7 days/yr
- Hot days in 30 yrs
- 16 days/yr
Wind risk 1/10 · Minimal
- Chance of severe wind over 30 yrs
- —
Air-quality risk 10/10 · Severe
- Unhealthy air days now
- 34 days/yr
- Unhealthy air days in 30 yrs
- 36 days/yr
Risk factors via First Street. Map © Google.
Why this score? — see what drove the D- grade
The composite is a weighted blend of 9 inputs, each scored 0–100. Each bar is that input's sub-score; the figure is the points it added to the 100-point composite (weight × sub-score).
- Cash flow +9.1/30.0
- ARV discount +7.5/15.0
- Schools +4.4/10.0
- 1% rule +3.9/10.0
- Livability +3.2/5.0
- DSCR +2.5/10.0
- Condition / age +2.5/5.0
- Rent growth +2.2/5.0
- Appreciation +0.0/10.0
$199,900
🖨 Deal sheet (PDF) 📄 Offer letter ✓ Due diligence
Listing remarks
Residing at 5186 Greenberry Dr in Sacramento, CA, USA, this residential property presents itself as a truly inviting home, ready for immediate enjoyment. The heart of this residence embraces an open floor plan, creating a spacious and welcoming environment where daily activities unfold with ease and comfort. Within this expansive setting, the kitchen features a practical peninsula, providing a versatile surface for culinary endeavors and casual gatherings alike, fostering a sense of togetherness within the living space. Beyond the interior, a private patio offers an ideal setting for moments of quiet reflection or outdoor enjoyment, extending the living area into the fresh air. This tranqui
Key facts
- $357 HOA
- Garage
- Community pool
Neighborhood map
What this means for you Summary
Snapshot
- This is a 2-bed/1.0-bath condo listed at $200k.
Deal economics
- At list price, monthly cash flow is $-155 ($-2k/yr) — negative.
- To cash-flow at today's rent, offer at most $173k (13.7% below list).
- To meet the 1% rule (rent ≥ 1% of price), the offer needs to be $177k (11.4% below list).
- Recommended offer: $173k (13.7% below list) — sets the bar for cash-flow.
- Cap rate 5.4% vs local median 2.6% in Carmichael — top-decile yield for the area; either an underpriced asset or a hidden risk that comps aren't pricing in. Stress-test before assuming the spread holds.
Location & tenants
- Location reads 63/100 on livability (#471 in CA) — a middle-class / working-renter tenant base. Strengths: amenities A-, housing B+, employment B; Watch: crime F, commute F, cost of living F.
- San Juan Unified (suburban): math 40% / reading 62% proficiency, ranked #138 of 517 in CA (top 27%) — acceptable for families but not a draw, mixed tenant base, ~2y average lease.
- Zoned schools: Orangevale Open K-8 (572 students, 22% FRL); Winston Churchill Middle (935 students, 44% FRL); Mira Loma High (math 77% / reading 87%, grade A, #34 of 1,170 statewide, top 3%, 1,678 students, 57% FRL) — zoned schools at 41% FRL track the district average.
- Zoned-school proficiency averages 82% at this address vs 51% district-wide (+31 pts) — the actual schools serving this property are materially stronger than the San Juan Unified average implies; a family-tenant draw the district grade alone would hide.
- Market conditions: Rents soft (-1.1%/yr); 83 active listings in the ZIP; 40 comparable units currently listed for rent nearby; rentals leasing fast (median 13d on market — plan ~1-2 weeks tenant-placement turnaround); 6,825 units permitted in Sacramento County in 2024 (1,752 in 5+ unit buildings).
- This rent runs 35% of the median local income ($61k/yr) — at the standard rent-burdened threshold; future hikes will face affordability resistance.
Forward outlook
- Local home prices are declining (-3.0%/yr); year-one equity from $1k of loan paydown is wiped out by about $6k of value loss. Plan a longer hold.
- Sacramento County population projected at +17% by 2050 — long-run rental-demand tailwind backs the buy-and-hold thesis.
Negotiation context
- Only 14 days on market — expect competitive offers; lowballing is unlikely to land.
- Current owner paid $170k; 18% above their basis — modest negotiation headroom, anchor on the comps not their cost.
Risks & watch-outs
- Watch-outs: HOA is 20% of rent.
- Climate carrying-cost: extreme-heat days projected 7→16/yr by 2055 (HVAC capex compounding) — expect insurance premiums to compound above CPI over the hold.
Questions for the listing agent
- What do current leases actually rent for vs. the listed asking? Can we see a recent rent roll and the last 12 months of T-12 income?
- Built in 1974 — when were the roof, HVAC, electrical panel, plumbing, and water heater last replaced?
- What does the HOA fee cover, when was the last increase, and are there any pending special assessments or reserve-fund shortfalls?
- Any open or pending special assessments — roof, HVAC, plumbing, elevator, façade? What's the per-unit balance and payoff schedule, and is the seller paying it off at close or rolling it to the buyer?
- Is there a deadline driving the sale (1031 exchange, divorce, estate, relocation)? That informs how much negotiation room exists.
- Crime grade is F in this area — have there been break-ins, vandalism, or insurance claims at this property in the last 3 years? What carrier currently insures it and at what premium?
- The area grade is low — what's the realistic commute time and amenity access for the typical tenant pool here? Any planned neighborhood developments (good or bad) we should know about?
- What's the average days-on-market for RENTAL listings here right now (not sales)? A rising rental-DOM trend means longer vacancies and softer asking-rent achievability than the comps imply.
- What's the recent tenant-quality profile in this submarket — average credit score on applications, eviction rate, late-payment / NSF rate, and stable-employment percentage? A property-management company in the area should have these aggregated.
- How much new apartment / multifamily construction is in the pipeline within 1–3 miles? Heavy new supply (>2% of stock underway) typically softens rents 12–24 months out; light construction supports rent growth.
Investment metrics
- 1% rule
- 0.89% ✗
- Cap rate
- 5.36%
- Cash-on-cash
- -3.32%
- DSCR
- 0.85
- GRM
- 9.4
CMA / ARV
No comps found within radius.
Projected returns pro-forma
-3.0% appreciation · 0.0% rent growth · sell at horizon
- IRR
- -25.7%
- Equity multiple
- 0.15×
- Total profit
- $-47,301
- Equity at exit
- $29,806
- IRR
- -38.4%
- Equity multiple
- -0.31×
- Total profit
- $-73,389
- Equity at exit
- $17,284
Cash invested: $55,972 (down + closing). Projections, not guarantees.
Landlord ↔ Tenant lean methodology
- Overall (STATE)
- 18 Strongly Tenant-Friendly
- State California
- 18 Strongly Tenant-Friendly · D+13
- County
- — inherits STATE
- City
- — inherits STATE
ZIP-level market 95841
- Rents YoY
- -1.1%
- Active inventory
- 83
- Price-to-rent
- 9.4×
Monthly cashflow live
- Estimated rent
- $1,770 high interval (Pro) →
- Mortgage (P&I)
- −$1,048
- Tax from tax record
- −$65 /mo · $776/yr
- Insurance
- −$83
- HOA
- −$357
- Vacancy / Maint / Mgmt
- −$372
- Net cashflow
- $-155
Break-even live
Sensitivity live
| Price | -10% $-42 | -5% $-98 | +0% $-155 | +5% $-211 | +10% $-268 |
|---|---|---|---|---|---|
| Rent | -10% $-295 | -5% $-225 | +0% $-155 | +5% $-85 | +10% $-15 |
| Rate | -1.0pp $-54 | -0.5pp $-104 | base $-155 | +0.5pp $-207 | +1.0pp $-259 |
UW: 25.0% down · 7.5% · 30yr · 1.5% tax · 5.0% vac · 8.0% maint · 8.0% mgmt
Financing live
Cash to close
- Down payment
- $49,975
- Closing costs
- $5,997
- Reserves months
- —
- Total cash needed
- —
Loan-product check · same deal, 3 products live
Conventional
25% down · 7.5% · 30yr
- Down + closing
- —
- Monthly P&I
- —
- Monthly cashflow
- —
- DSCR
- —
- Eligible?
- —
Personal DTI + credit; lowest rate.
DSCR
20% down · 8.5% · 30yr
- Down + closing
- —
- Monthly P&I
- —
- Monthly cashflow
- —
- DSCR
- —
- Eligible?
- —
No personal income docs; deal must DSCR.
Hard money
10% down · 12.0% · 12mo
- Down + closing
- —
- Monthly P&I
- —
- Monthly cashflow
- —
- DSCR
- —
- Eligible?
- —
Short-term bridge; refi at stabilization.
Rent comps 40 comps
| Address | Beds | Baths | Sqft | Rent | $/sqft | DOM | Units | Dist |
|---|---|---|---|---|---|---|---|---|
| 5755 Callie Ln Sacramento, CA | 1.0–2.0 | 1.0–2.0 | 723 | $2,000 | $2.76 | 5d | 13 | 0.22mi |
| 5133 Connecticut Dr #3 Sacramento, CA | 2.0 | 1.0 | 840 | $1,495 | $1.78 | 23d | 1 | 0.22mi |
| 5129 Connecticut Dr #1 Sacramento, CA | 2.0 | 1.0 | 795 | $1,595 | $2.01 | 18d | 1 | 0.22mi |
| 5100 Garfield Ave Sacramento, CA | 1.0–2.0 | 1.0 | 917 | $1,970 | $2.15 | 45d | 1 | 0.33mi |
| 5244 Hackberry Ln Sacramento, CA | 2.0 | 1.0 | 712 | $1,712 | $2.41 | 45d | 1 | 0.35mi |
| 4789 Manzanita Ave Carmichael, CA | 2.0 | 1.0–2.0 | 970 | $1,775 | $1.83 | 6d | 2 | 0.38mi |
| 5121 Garfield Ave Sacramento, CA | 1.0 | 1.0 | 813 | $1,738 | $2.14 | 25d | 2 | 0.39mi |
| 5300 Winfield Way #2 Sacramento, CA | 3.0 | 1.5 | 1105 | $2,100 | $1.90 | 25d | 1 | 0.40mi |
| 5233 Columbine Way Carmichael, CA | 3.0 | 2.0 | 1008 | $2,375 | $2.36 | 6d | 1 | 0.42mi |
| 5308 Winfield Way #2 Sacramento, CA | 3.0 | 1.5 | 1105 | $2,100 | $1.90 | 45d | 1 | 0.43mi |
| 4729 Manzanita Ave Carmichael, CA | 1.0–2.0 | 1.0 | 709 | $1,699 | $2.39 | 6d | 4 | 0.48mi |
| 6005 Rye Way Carmichael, CA | 2.0 | 1.0 | 832 | $1,895 | $2.28 | 45d | 1 | 0.49mi |
| 5402 Mona Way Sacramento, CA | 2.0 | 1.0 | 863 | $1,750 | $2.03 | 23d | 1 | 0.55mi |
| 6004 Rutland Dr Unit 128 Carmichael, CA | 2.0 | 1.0 | 900 | $1,495 | $1.66 | 6d | 1 | 0.59mi |
| 5226 Hemlock St #35 Sacramento, CA | 1.0 | 1.0 | 682 | $1,650 | $2.42 | 25d | 1 | 0.60mi |
| 5425 Garfield Ave Sacramento, CA | 1.0–2.0 | 1.0–2.0 | 787 | $1,650 | $2.10 | 22d | 5 | 0.63mi |
| 5738 Windmill Way Carmichael, CA | 1.0 | 1.0 | 652 | $1,350 | $2.07 | 4d | 3 | 0.69mi |
| 5322 Hemlock St Sacramento, CA | 1.0–2.0 | 1.0 | 800 | $1,875 | $2.34 | 3d | 2 | 0.71mi |
| 4451 Manzanita Ave Carmichael, CA | 2.0 | 1.0 | 926 | $1,800 | $1.94 | 9d | 1 | 0.79mi |
| 4494 Mary Lynn Ln Carmichael, CA | 1.0–2.0 | 1.0–1.5 | 1062 | $1,950 | $1.84 | 5d | 3 | 0.81mi |
| 5012 Sunshine Ln Sacramento, CA | 2.0 | 1.0 | 970 | $1,775 | $1.83 | 12d | 1 | 0.82mi |
| 4901 Little Oak Ln Sacramento, CA | 1.0–3.0 | 1.0–2.0 | 915 | $1,540 | $1.68 | 3d | 7 | 0.86mi |
| 5500 Foothill Garden Ct Sacramento, CA | 1.0 | 1.0 | 750 | $1,472 | $1.96 | 3d | 2 | 0.89mi |
| 6225 Wildomar Way Carmichael, CA | 3.0 | 1.0 | 1040 | $3,000 | $2.88 | 45d | 1 | 0.92mi |
| 4930 College Oak Dr Sacramento, CA | 1.0 | 1.0 | 670 | $1,450 | $2.16 | 3d | 1 | 0.92mi |
| 5341 Walnut Ave Sacramento, CA | 1.0–2.0 | 1.0 | 750 | $1,795 | $2.39 | 3d | 6 | 0.97mi |
| 4219 Casa Blanca Ln Unit 4219 Carmichael, CA | 2.0 | 2.0 | 1084 | $1,850 | $1.71 | 45d | 1 | 1.03mi |
| 5501 Keoncrest Cir Unit 1 Sacramento, CA | 2.0 | 1.0 | 750 | $1,300 | $1.73 | 3d | 1 | 1.04mi |
| Venuto Way North Highlands, CA | 2.0 | 1.0 | 906 | $2,095 | $2.31 | 12d | 2 | 1.04mi |
| 4247 Hackberry Ln Carmichael, CA | 2.0 | 1.0–1.5 | 912 | $1,899 | $2.08 | 4d | 11 | 1.04mi |
| 5718 Manzanita Ave Carmichael, CA | 2.0 | 1.0 | 980 | $2,000 | $2.04 | 45d | 1 | 1.04mi |
| 5587 Keoncrest Cir Unit 2 Sacramento, CA | 2.0 | 1.5 | 900 | $2,000 | $2.22 | 3d | 1 | 1.07mi |
| 4841 Myrtle Ave Sacramento, CA | 1.0 | 1.0 | 600 | $1,350 | $2.25 | 3d | 1 | 1.08mi |
| 4815 College Oak Dr Sacramento, CA | 2.0 | 1.0–1.5 | 1000 | $1,662 | $1.66 | 9d | 2 | 1.09mi |
| 4806 Myrtle Ave Sacramento, CA | 1.0 | 1.0 | 650 | $1,338 | $2.06 | 45d | 1 | 1.13mi |
| 4200 Manzanita Ave Carmichael, CA | 1.0 | 1.0 | 622 | $1,365 | $2.19 | 45d | 3 | 1.13mi |
| 5840 Garfield Ave Sacramento, CA | 2.0 | 1.0 | 850 | $1,545 | $1.82 | 3d | 2 | 1.13mi |
| 5844 Garden Park Ct Unit RV 5853-D Carmichael, CA | 2.0 | 1.0 | 915 | $1,525 | $1.67 | 18d | 1 | 1.14mi |
| 5844 Garden Park Ct Unit RV 5877-B Carmichael, CA | 2.0 | 1.0 | 915 | $1,575 | $1.72 | 18d | 1 | 1.14mi |
| 5008 Bremner Way #3 Sacramento, CA | 2.0 | 1.0 | 850 | $1,650 | $1.94 | 3d | 1 | 1.15mi |
HOA detail condo
- Monthly dues
- $357 · $4,284/yr
- Assessments
- None detected in remarks — confirm with the listing agent.
Listing history 2 events
-
2004-09-24soldstatus $170,000
-
1983-10-19soldstatus $58,000
ⓘ Source: listings_history table (triggers on properties + properties_extension) + one-shot
backfill from property_details.listing_events for pre-trigger history.
Tax reassessment forecast CA · Resets to sale price
- Current annual tax
- $776 · $65/mo
- Projected year-2 tax
- $1,519 · $127/mo
- Expected delta
- +$744/yr (+$62/mo · 95.9%)
ⓘ Screening estimate from a state-policy table — verify with the county assessor before closing.
Climate risk First Street
- Flood 1/10 Low FEMA zone X (unshaded) · 0% chance over 30 yrs
- Wildfire 1/10 Low
- Heat 7/10 Severe 7 d/yr ≥102°F today · 16 d/yr by 30 yrs out
- Wind 1/10 Low
- Air quality 10/10 Extreme 34 unhealthy d/yr today · 36 by 30 yrs out
Nearby sold comps map
Loading sold comps map…
Walkable amenities ~0.75 mi
Loading nearby amenities…
Taxation est. · year 1
- Rental income
- $21,243
- − Mortgage interest
- −$11,198
- − Property taxes
- −$776
- − Insurance
- −$1,000
- − Repairs & maintenance
- −$1,699
- − Management
- −$1,699
- − HOA
- −$4,284
- − Depreciation
- −$5,815
- Taxable loss
- −$5,227
- Est. tax savings @ 24.0%
- +$1,255
- After-tax cash flow
- $-602/yr
For passive investors: Depreciation is non-cash, so a rental often shows a tax loss while cash-flowing — sheltering income. Rental losses are passive: they offset passive income freely, and up to $25,000/yr can offset ordinary (W-2) income if you actively participate and your MAGI is under $100k (phasing out to $0 by $150k); unused losses carry forward. On sale, claimed depreciation is recaptured at up to 25%, and gains may owe capital-gains tax (a 1031 exchange can defer both). Figures are a year-1 estimate at your 24.0% rate — not tax advice; consult a CPA.
Schools (NCES district)
- District
- San Juan Unified
- NCES district ID
- 0634620
- Math proficiency
- 40% ▲ 3.00%
- Reading proficiency
- 62% ▲ 16.00%
- Median HH income
- $55,655
- Composite
- 44.07/100
- National rank
- #2878
- State rank
- #138 of 517 in CA
Livability — Carmichael
- Score
- 63/100
- State rank
- #471
- US rank
- #15996
Category grades
Schools grade is shown separately in the Schools card above.
Census & demographics
- Census place
- Carmichael, CA
- County
- Sacramento County · 1,539,646 people
- City population
- 61,440
- Metro
- Sacramento-Roseville-Folsom, CA
- Population (ZIP)
- 20,500
- Household income
- $61,054
- Rent vs Own
- Severe rent burden
- 1353.0
Population outlook (Sacramento County) Hauer SSP2
- Today (2025)
- 1,660,763 people
- By 2030
- 1,732,990 · +4.3%
- By 2040
- 1,855,755 · +11.7%
- By 2050
- 1,941,335 · +16.9%
- By 2075
- 2,046,162 · +23.2%
- By 2100
- 1,961,444 · +18.1%
Race, ethnicity, and origin ACS 2023
- Neighborhood character
- Diverse neighborhood (Simpson 0.59)
- Race & ethnicity
- White 61% Hispanic / Latino 17% Two or more races 13% Black 9% Asian 6%
- Hispanic origin (detail)
- Mexican 13%
- Common ancestry
- Subsaharan African 5% Scotch-Irish 4% Lithuanian 2%
- Foreign-born
- 24% · Canada, China, Vietnam
- Languages at home
- 70% English-only · Russian/Polish/Slavic 11% Spanish 7% Other Indo-European 5%
Political lean MEDSL · Sacramento
- 2024 margin
- D (+19.7) · D 58.1% · R 38.4% · Other 3.5%
- 2008→2024 swing
- +0.7pp no change · 2008: 19.0pp · 2024: 19.7pp
- All cycles
- 2024: D+19.7 2020: D+25.3 2016: D+23.7 2012: D+16.3 2008: D+19.0
Not yet ingested
- Civics
- —
Market trends
- HPI YoY
- ▼ -227.82%
- Current HPI
- 369.8991
- Rent YoY
- ▼ -1.08%
- Metro
- Sacramento-Roseville-Folsom, CA
- State GDP YoY
- ▲ 3.21%
- F500 in state
- 116
Industry mix (Fortune 500 HQ in CA)
| Industry | F500 HQs | Revenue |
|---|---|---|
| Technology | 27 | $1,492B |
|
||
| Financial Services | 3 | $174B |
|
||
| Retail | 3 | $44B |
|
||
| Insurance | 3 | $26B |
|
||
| Media / Entertainment | 2 | $115B |
|
||
| Pharmaceuticals / Biotech | 2 | $62B |
|
||
Price history
+193.1% since first listed2 events — show timeline
- 2004-09-24 Sold (Public Records) $170,000 Public Records
- 1983-10-19 Sold (Public Records) $58,000 Public Records
Property tax history
-4.7%/yrLatest (2025): $776 · +0.9% YoY. Source: county tax records.
Cash-flow waterfall
monthlySold comps — $/sqft
last 12 mo · ≤1 miLoading sold comps…