 🏷️ Likely Rental
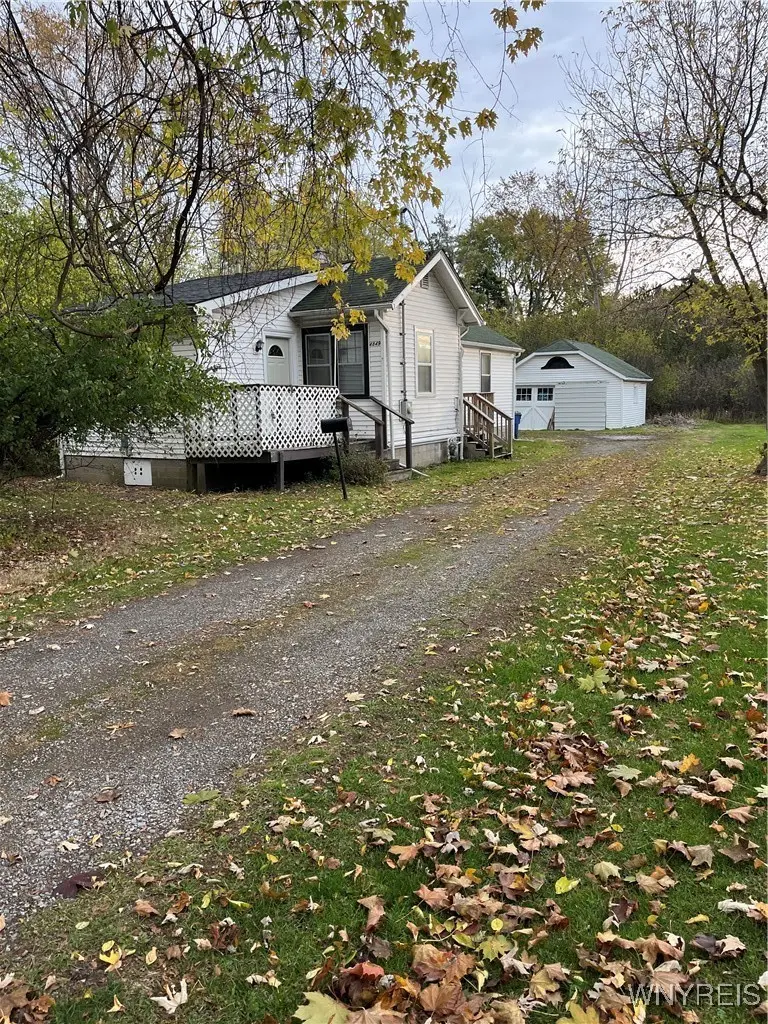
4849 Harlem Rd · Eggertsville, NY
Flood risk 6/10 · Moderate
- FEMA flood zone
- X (unshaded)
- Chance of flooding over 30 yrs
- 0.7%
- Est. flood insurance / yr
- $507 – $1,088
Fire risk 1/10 · Minimal
- Est. fire insurance / yr
- $691 – $1,283
Heat risk 2/10 · Minimal
- Hot days now (above 92°F)
- 7 days/yr
- Hot days in 30 yrs
- 14 days/yr
Wind risk 1/10 · Minimal
- Chance of severe wind over 30 yrs
- —
Air-quality risk 3/10 · Minor
- Unhealthy air days now
- 2 days/yr
- Unhealthy air days in 30 yrs
- 3 days/yr
Risk factors via First Street. Map © Google.
Why this score? — see what drove the C grade
The composite is a weighted blend of 9 inputs, each scored 0–100. Each bar is that input's sub-score; the figure is the points it added to the 100-point composite (weight × sub-score).
- ARV discount +15.0/15.0
- Cash flow +14.8/30.0
- Schools +5.3/10.0
- 1% rule +4.9/10.0
- Rent growth +4.8/5.0
- DSCR +4.5/10.0
- Livability +4.2/5.0
- Condition / age +2.5/5.0
- Appreciation +0.0/10.0
$165,000
🖨 Deal sheet 📄 Offer letter ✓ Due diligence
Listing remarks MLS
Seller Inherited Family Property. Very old home in need of everything. .41 acre lot with 270 Ft depth allows for new build of any size. Property is tenant occupied for many years.
Key facts
- .41 acre lot
- 270 ft depth
- 0.41 acre lot
Tags
Neighborhood map
What this means for you Summary
Snapshot
- This is a 2-bed/1.0-bath single-family listed at $165k.
Deal economics
- At list price, monthly cash flow is $45 ($536/yr) — positive.
- The deal already cash-flows at list — no discount required.
- To meet the 1% rule (rent ≥ 1% of price), the offer needs to be $163k (1.4% below list).
- Recommended offer: $145k (12.0% below list) — sets the bar for market timing.
- Cap rate 6.6% vs local median 4.5% in Eggertsville — top-decile yield for the area; either an underpriced asset or a hidden risk that comps aren't pricing in. Stress-test before assuming the spread holds.
Location & tenants
- Location reads 85/100 on livability (#34 in NY, #534 nationally) — a professional / high-income tenant draw. Strengths: commute A+, housing A+, health & safety A+; Watch: crime C-, amenities C-.
- Amherst Central School District (suburban): math 53% / reading 68% proficiency, ranked #209 of 590 in NY (top 35%) — acceptable for families but not a draw, mixed tenant base, ~2y average lease.
- Market conditions: Rents rising fast (+9.0%/yr); 143 active listings in the ZIP; 8 comparable units currently listed for rent nearby; rentals at typical pace (median 24d on market — plan ~3-4 weeks tenant-placement turnaround); solid renter incomes; 1,244 units permitted in Erie County in 2024 (563 in 5+ unit buildings).
Forward outlook
- Local home prices are declining (-3.0%/yr); year-one equity from $1k of loan paydown is wiped out by about $5k of value loss. Plan a longer hold.
Negotiation context
- It's been on market 226 days — a 12% lower offer ($145k) is reasonable based on typical stale-listing flexibility.
Risks & watch-outs
- Watch-outs: built in 1940 — expect roof / HVAC / electrical / plumbing capex.
- Climate carrying-cost: major flood risk — expect insurance premiums to compound above CPI over the hold.
Questions for the listing agent
- It's been on market 226 days. Have you received any prior offers? Is the seller open to a 12% concession, seller financing, or rate buy-down credit?
- Built in 1940 — when were the roof, HVAC, electrical panel, plumbing, and water heater last replaced?
- Why hasn't it sold? Are there any deal-killer items the seller is aware of (foundation, flood, title, zoning, code violations)?
- Is there a deadline driving the sale (1031 exchange, divorce, estate, relocation)? That informs how much negotiation room exists.
- Schools are B-rated — typically a magnet for longer-tenancy family renters. What's the average tenant stay here, and is there a school-zone premium baked into asking?
- What's the average days-on-market for RENTAL listings here right now (not sales)? A rising rental-DOM trend means longer vacancies and softer asking-rent achievability than the comps imply.
- What's the recent tenant-quality profile in this submarket — average credit score on applications, eviction rate, late-payment / NSF rate, and stable-employment percentage? A property-management company in the area should have these aggregated.
- How much new for-sale + rental construction is in the pipeline within 1–3 miles? Heavy new supply typically softens prices + rents 12–24 months out; constrained supply supports both.
Investment metrics
- 1% rule
- 0.99% ✗
- Cap rate
- 6.62%
- Cash-on-cash
- 1.16%
- DSCR
- 1.05
- GRM
- 8.5
CMA / ARV
- ARV (median comp)
- $227,293
- List price
- $165,000
- Delta
- -27.41%
- Verdict
- UNDERPRICED
- Comps
- 5 within 1.0 mi
Show comp detail 1 sale within ~0.75 mi
| Address | Dist | Beds/Ba | Sqft | Sold | Price | $/sf | Match |
|---|---|---|---|---|---|---|---|
| 706 Longmeadow Rd | 0.70mi | 2/1.5 | 768 (+11%) | 8mo | $200,000 | $260 | 41 |
Match score weights: distance 35% · size 25% · config 20% · recency 20%. Top-matched comps best support the ARV.
Projected returns pro-forma
-3.0% appreciation · 8.0% rent growth · sell at horizon
- IRR
- -8.5%
- Equity multiple
- 0.67×
- Total profit
- $-15,207
- Equity at exit
- $24,602
- IRR
- 6.9%
- Equity multiple
- 1.65×
- Total profit
- $29,900
- Equity at exit
- $14,266
Cash invested: $46,200 (down + closing). Projections, not guarantees.
Landlord ↔ Tenant lean methodology
- Overall (STATE)
- 15 Strongly Tenant-Friendly
- State New York
- 15 Strongly Tenant-Friendly · D+10
- County
- — inherits STATE
- City
- — inherits STATE
ZIP-level market 14226
- Rents YoY
- 9.0%
- Active inventory
- 143
- Price-to-rent
- 8.5×
Monthly cashflow live
- Estimated rent
- $1,627 high interval (Pro) →
- Mortgage (P&I)
- −$865
- Tax from tax record
- −$306 /mo · $3,676/yr
- Insurance
- −$69
- HOA
- −$0
- Vacancy / Maint / Mgmt
- −$342
- Net cashflow
- $45
Break-even live
UW: 25.0% down · 7.5% · 30yr · 1.5% tax · 5.0% vac · 8.0% maint · 8.0% mgmt
Financing live
Cash to close
- Down payment
- $41,250
- Closing costs
- $4,950
- Reserves months
- —
- Total cash needed
- —
Loan-product check · same deal, 3 products live
Conventional
25% down · 7.5% · 30yr
- Down + closing
- —
- Monthly P&I
- —
- Monthly cashflow
- —
- DSCR
- —
- Eligible?
- —
Personal DTI + credit; lowest rate.
DSCR
20% down · 8.5% · 30yr
- Down + closing
- —
- Monthly P&I
- —
- Monthly cashflow
- —
- DSCR
- —
- Eligible?
- —
No personal income docs; deal must DSCR.
Hard money
10% down · 12.0% · 12mo
- Down + closing
- —
- Monthly P&I
- —
- Monthly cashflow
- —
- DSCR
- —
- Eligible?
- —
Short-term bridge; refi at stabilization.
Rent comps 8 comps
| Address | Beds | Baths | Sqft | Rent | $/sqft | DOM | Units | Dist |
|---|---|---|---|---|---|---|---|---|
| 1335 Millersport Hwy Unit 1335-06 Buffalo, NY | 1.0 | 1.0 | 560 | $1,415 | $2.53 | 43d | 1 | 1.02mi |
| 1335 Millersport Hwy Buffalo, NY | 2.0 | 1.0 | 713 | $1,595 | $2.24 | 11d | 1 | 1.02mi |
| 1335 Millersport Hwy Unit 04 Buffalo, NY | 2.0 | 1.0 | 713 | $1,595 | $2.24 | 1d | 1 | 1.02mi |
| 1357 Millersport Hwy Unit 1335-06 Buffalo, NY | 1.0 | 1.0 | 560 | $1,415 | $2.53 | 43d | 1 | 1.03mi |
| 1357 Millersport Hwy Unit 1357-03 Buffalo, NY | 2.0 | 1.0 | 713 | $1,595 | $2.24 | 43d | 1 | 1.03mi |
| 1357 Millersport Hwy Buffalo, NY | 1.0–2.0 | 1.0 | 636 | $1,595 | $2.51 | 1d | 2 | 1.03mi |
| 4865 Main St Unit 2 Buffalo, NY | 1.0 | 1.0 | 700 | $2,500 | $3.57 | 11d | 1 | 1.19mi |
| 1233 Eggert Rd Buffalo, NY | 1.0 | 1.0 | 700 | $1,175 | $1.68 | 23d | 1 | 1.34mi |
Listing history 16 events
-
2026-06-18days on market $165,000 Active 226 DOM
-
2026-06-17days on market $165,000 Active 225 DOM
-
2026-06-16days on market $165,000 Active 224 DOM
-
2026-06-15days on market $165,000 Active 223 DOM
-
2026-06-13days on market $165,000 Active 221 DOM
-
2026-06-13days on market $165,000 Active 220 DOM
-
2026-06-10days on market $165,000 Active 218 DOM
-
2026-06-09days on market $165,000 Active 217 DOM
-
2026-06-08days on market $165,000 Active 216 DOM
-
2026-06-07days on market $165,000 Active 215 DOM
-
2026-06-05days on market $165,000 Active 212 DOM
-
2026-06-03days on market $165,000 Active 211 DOM
-
2026-06-02days on market $165,000 Active 210 DOM
-
2026-06-01days on market $165,000 Active 209 DOM
-
2026-05-31days on market $165,000 Active 208 DOM
-
2025-11-03$165,000 Active 179-char remark
Show marketing remark (179 chars)
Seller Inherited Family Property. Very old home in need of everything. .41 acre lot with 270 Ft depth allows for new build of any size. Property is tenant occupied for many years.
ⓘ Source: listings_history table (triggers on properties + properties_extension) + one-shot
backfill from property_details.listing_events for pre-trigger history.
Tax reassessment forecast NY · Partial reset (capped growth)
- Current annual tax
- $3,676 · $306/mo
- Projected year-2 tax
- $3,676 · $306/mo
- Expected delta
- $0/yr ($0/mo · 0.0%)
ⓘ Screening estimate from a state-policy table — verify with the county assessor before closing.
Climate risk First Street
- Flood 6/10 Major FEMA zone X (unshaded) · 70% chance over 30 yrs
- Wildfire 1/10 Low
- Heat 2/10 Low 7 d/yr ≥92°F today · 14 d/yr by 30 yrs out
- Wind 1/10 Low
- Air quality 3/10 Moderate 2 unhealthy d/yr today · 3 by 30 yrs out
Nearby sold comps map
Loading sold comps map…
Walkable amenities ~0.75 mi
Loading nearby amenities…
Taxation est. · year 1
- Rental income
- $19,520
- − Mortgage interest
- −$9,243
- − Property taxes
- −$3,676
- − Insurance
- −$825
- − Repairs & maintenance
- −$1,562
- − Management
- −$1,562
- − Depreciation
- −$4,800
- Taxable loss
- −$2,147
- Est. tax savings @ 24.0%
- +$515
- After-tax cash flow
- $1,052/yr
For passive investors: Depreciation is non-cash, so a rental often shows a tax loss while cash-flowing — sheltering income. Rental losses are passive: they offset passive income freely, and up to $25,000/yr can offset ordinary (W-2) income if you actively participate and your MAGI is under $100k (phasing out to $0 by $150k); unused losses carry forward. On sale, claimed depreciation is recaptured at up to 25%, and gains may owe capital-gains tax (a 1031 exchange can defer both). Figures are a year-1 estimate at your 24.0% rate — not tax advice; consult a CPA.
Schools (NCES district)
- District
- Amherst Central School District
- NCES district ID
- 3602920
- Math proficiency
- 53% ▼ -16.00%
- Reading proficiency
- 68% ▲ 4.00%
- Median HH income
- $68,551
- Composite
- 53.21/100
- National rank
- #1502
- State rank
- #209 of 590 in NY
Livability — Eggertsville
- Score
- 85/100
- State rank
- #34
- US rank
- #534
Category grades
Schools grade is shown separately in the Schools card above.
Census & demographics
- County
- Erie County · 714,559 people
- City population
- 29,482
- Metro
- Buffalo-Cheektowaga, NY
- Population (ZIP)
- 29,159
- Household income
- $84,325
- Rent vs Own
- Severe rent burden
- 856.0
Population outlook (Erie County) Hauer SSP2
- Today (2025)
- 933,037 people
- By 2030
- 935,181 · +0.2%
- By 2040
- 928,531 · -0.5%
- By 2050
- 905,725 · -2.9%
- By 2075
- 834,037 · -10.6%
- By 2100
- 708,033 · -24.1%
Race, ethnicity, and origin ACS 2023
- Neighborhood character
- Predominantly White (74%)
- Race & ethnicity
- White 74% Black 10% Asian 7% Two or more races 6% Hispanic / Latino 5%
- Common ancestry
- Romanian 7% Lithuanian 2% Slovak 1%
- Foreign-born
- 13% · Canada, China, India
- Languages at home
- 87% English-only · Other Indo-European 4% Spanish 2% Arabic 1%
Political lean MEDSL · Erie
- 2024 margin
- Lean D (+9.7) · D 54.8% · R 45.2%
- 2008→2024 swing
- -7.9pp toward R · 2008: 17.5pp · 2024: 9.7pp
- All cycles
- 2024: D+9.7 2020: D+14.7 2016: D+4.8 2012: D+15.6 2008: D+17.5
Not yet ingested
- Civics
- —
Market trends
- HPI YoY
- ▼ -270.71%
- Current HPI
- 331.1929
- Rent YoY
- ▲ 9.01%
- Metro
- Buffalo-Cheektowaga, NY
- State GDP YoY
- ▲ 2.60%
- F500 in state
- 92
Industry mix (Fortune 500 HQ in NY)
| Industry | F500 HQs | Revenue |
|---|---|---|
| Financial Services | 10 | $950B |
|
||
| Consumer Goods | 9 | $162B |
|
||
| Insurance | 4 | $225B |
|
||
| Telecommunications | 2 | $144B |
|
||
| Pharmaceuticals | 2 | $112B |
|
||
| Media / Entertainment | 2 | $69B |
|
||
Price history
1 event — show timeline
- 2025-11-03 Listed $165,000 WNYREIS
Property tax history
+3.4%/yrLatest (2025): $3,676 · +8.4% YoY. Source: county tax records.
Cash-flow waterfall
monthlySold comps — $/sqft
last 12 mo · ≤1 miLoading sold comps…