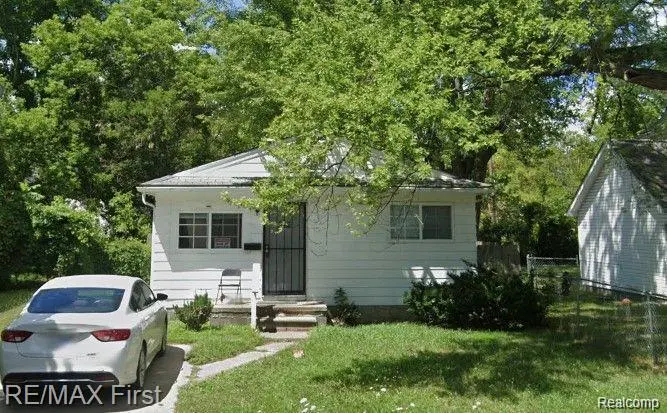
15739 Dolphin St · Detroit, MI
Flood risk 1/10 · Minimal
- FEMA flood zone
- X (unshaded)
- Chance of flooding over 30 yrs
- 0.0%
- Est. flood insurance / yr
- $507 – $1,088
Fire risk 1/10 · Minimal
- Est. fire insurance / yr
- $784 – $1,456
Heat risk 3/10 · Minor
- Hot days now (above 98°F)
- 7 days/yr
- Hot days in 30 yrs
- 15 days/yr
Wind risk 2/10 · Minimal
- Chance of severe wind over 30 yrs
- —
Air-quality risk 3/10 · Minor
- Unhealthy air days now
- 2 days/yr
- Unhealthy air days in 30 yrs
- 3 days/yr
Risk factors via First Street. Map © Google.
Why this score? — see what drove the C+ grade
The composite is a weighted blend of 9 inputs, each scored 0–100. Each bar is that input's sub-score; the figure is the points it added to the 100-point composite (weight × sub-score).
- Cash flow +30.0/30.0
- 1% rule +10.0/10.0
- DSCR +10.0/10.0
- Livability +3.7/5.0
- Rent growth +2.5/5.0
- Condition / age +2.5/5.0
- Schools +1.3/10.0
- ARV discount +0.3/15.0
- Appreciation +0.0/10.0
$71,900
🖨 Deal sheet 📄 Offer letter ✓ Due diligence
Listing remarks MLS
Renovated in 2021, this residence is perfect for a first time home buyer, or as an addition to an investor's portfolio. Come check it out. The accuracy of all information, regardless of the source is not guaranteed or warranted. All information should be independently verified. Contact the agent for showing and the best price.
Key facts
- 4,356 sq ft lot
- Built 1972
- Listed 134 days
Neighborhood map
What this means for you Summary
Snapshot
- This is a 3-bed/1.0-bath single-family listed at $72k.
Deal economics
- At list price, monthly cash flow is $487 ($6k/yr) — positive.
- The deal already cash-flows at list — no discount required.
- Meets the 1% rule at list price ($1k rent vs $72k).
- Recommended offer: $63k (12.0% below list) — sets the bar for market timing.
- Cap rate 14.4% vs local median 10.2% in Detroit — top-decile yield for the area; either an underpriced asset or a hidden risk that comps aren't pricing in. Stress-test before assuming the spread holds.
Location & tenants
- Location reads 73/100 on livability (#218 in MI) — a middle-class / working-renter tenant base. Strengths: amenities A+, commute A+, cost of living A+; Watch: schools F, crime F, employment F.
- Detroit Public Schools Community District (urban): math 10% / reading 24% proficiency, ranked #499 of 540 in MI (top 92%) — low school quality limits family demand, transient renter base, plan for 1-2y turnover; 90% free/reduced lunch — lower-income household profile, screen leases tightly.
- Market conditions: 158 active listings in the ZIP; 40 comparable units currently listed for rent nearby; rentals lingering (median 44d on market — plan ~5-8 weeks vacancy on turnover, expect pricing pressure); 52% of comp listings sitting > 30 days — soft ceiling on asking rent; lower-income renter base — watch delinquency; 2,639 units permitted in Wayne County in 2024 (1,216 in 5+ unit buildings).
- This rent runs 34% of the median local income ($45k/yr) — at the standard rent-burdened threshold; future hikes will face affordability resistance.
Forward outlook
- Local home prices are declining (-3.0%/yr); year-one equity from $497 of loan paydown is wiped out by about $2k of value loss. Plan a longer hold.
- Wayne County population projected at -17% by 2050 — secular population decline; favor cash flow + early exit over multi-decade hold.
- At projected returns (-3.0% appreciation + 3.0% rent growth), your $20k cash investment doubles in ~5 years — after that, you're playing with house money.
Negotiation context
- It's been on market 134 days — a 12% lower offer ($63k) is reasonable based on typical stale-listing flexibility.
- 6 sale attempts since 2y ago with the ask held roughly flat each time — persistent listings suggest the price (not the market) is what's stuck; bring a comps-based counter.
Questions for the listing agent
- It's been on market 134 days. Have you received any prior offers? Is the seller open to a 12% concession, seller financing, or rate buy-down credit?
- Built in 1972 — when were the roof, HVAC, electrical panel, plumbing, and water heater last replaced?
- Why hasn't it sold? Are there any deal-killer items the seller is aware of (foundation, flood, title, zoning, code violations)?
- Is there a deadline driving the sale (1031 exchange, divorce, estate, relocation)? That informs how much negotiation room exists.
- Schools are F-rated, which usually means shorter tenancies and higher turnover. Who's the typical renter profile here, and what's been the actual vacancy rate?
- Crime grade is F in this area — have there been break-ins, vandalism, or insurance claims at this property in the last 3 years? What carrier currently insures it and at what premium?
- What's the average days-on-market for RENTAL listings here right now (not sales)? A rising rental-DOM trend means longer vacancies and softer asking-rent achievability than the comps imply.
- What's the recent tenant-quality profile in this submarket — average credit score on applications, eviction rate, late-payment / NSF rate, and stable-employment percentage? A property-management company in the area should have these aggregated.
- How much new for-sale + rental construction is in the pipeline within 1–3 miles? Heavy new supply typically softens prices + rents 12–24 months out; constrained supply supports both.
Investment metrics
- 1% rule
- 1.74% ✓
- Cap rate
- 14.42%
- Cash-on-cash
- 29.03%
- DSCR
- 2.29
- GRM
- 4.8
CMA / ARV
- ARV (median comp)
- $61,940
- List price
- $71,900
- Delta
- 16.08%
- Verdict
- OVERPRICED
- Comps
- 20 within 1.0 mi
Show comp detail 12 sales within ~0.75 mi
| Address | Dist | Beds/Ba | Sqft | Sold | Price | $/sf | Match |
|---|---|---|---|---|---|---|---|
| 15757 Dacosta St | 0.07mi | 3/1.0 | 960 (-5%) | 2mo | $65,000 | $68 | 88 |
| 15411 Lahser Rd | 0.21mi | 3/2.0 | 1,025 (+2%) | 4mo | $42,000 | $41 | 80 |
| 16165 W Parkway St | 0.48mi | 3/1.0 | 1,022 (+1%) | 5mo | $50,000 | $49 | 71 |
| 15835 Burgess St | 0.27mi | 3/1.0 | 918 (-9%) | 9mo | $93,000 | $101 | 65 |
| 15885 Beaverland St | 0.35mi | 3/2.0 | 1,100 (+9%) | 3mo | $51,500 | $47 | 62 |
| 16555 Bramell St | 0.47mi | 3/1.0 | 918 (-9%) | 3mo | $60,000 | $65 | 61 |
| 22482 W Mcnichols Rd | 0.73mi | 3/1.5 | 1,031 (+2%) | 2mo | $61,000 | $59 | 58 |
| 14931 Rockdale St | 0.52mi | 3/1.0 | 1,100 (+9%) | 8mo | $39,900 | $36 | 54 |
| 16836 Beaverland St | 0.66mi | 3/1.0 | 1,100 (+9%) | 6mo | $65,500 | $60 | 48 |
| 16616 Blackstone St | 0.69mi | 2/1.0 (-1) | 1,102 (+9%) | 0mo | $45,000 | $41 | 47 |
| 16122 Trinity St | 0.63mi | 3/2.5 | 1,152 (+14%) | 4mo | $169,900 | $147 | 38 |
| 16115 Burt Rd | 0.66mi | 2/1.0 (-1) | 859 (-15%) | 5mo | $57,000 | $66 | 35 |
Match score weights: distance 35% · size 25% · config 20% · recency 20%. Top-matched comps best support the ARV.
Projected returns pro-forma
-3.0% appreciation · 3.0% rent growth · sell at horizon
- IRR
- 23.4%
- Equity multiple
- 1.96×
- Total profit
- $19,397
- Equity at exit
- $10,721
- IRR
- 31.4%
- Equity multiple
- 3.83×
- Total profit
- $56,933
- Equity at exit
- $6,217
Cash invested: $20,132 (down + closing). Projections, not guarantees.
Landlord ↔ Tenant lean methodology
- Overall (STATE)
- 62 Landlord-Friendly
- State Michigan
- 62 Landlord-Friendly · EVEN
- County
- — inherits STATE
- City
- — inherits STATE
ZIP-level market 48223
- Active inventory
- 158
- Price-to-rent
- 4.8×
Monthly cashflow live
- Estimated rent
- $1,254 high interval (Pro) →
- Mortgage (P&I)
- −$377
- Tax from tax record
- −$97 /mo · $1,162/yr
- Insurance
- −$30
- HOA
- −$0
- Vacancy / Maint / Mgmt
- −$263
- Net cashflow
- $487
Break-even live
UW: 25.0% down · 7.5% · 30yr · 1.5% tax · 5.0% vac · 8.0% maint · 8.0% mgmt
Financing live
Cash to close
- Down payment
- $17,975
- Closing costs
- $2,157
- Reserves months
- —
- Total cash needed
- —
Loan-product check · same deal, 3 products live
Conventional
25% down · 7.5% · 30yr
- Down + closing
- —
- Monthly P&I
- —
- Monthly cashflow
- —
- DSCR
- —
- Eligible?
- —
Personal DTI + credit; lowest rate.
DSCR
20% down · 8.5% · 30yr
- Down + closing
- —
- Monthly P&I
- —
- Monthly cashflow
- —
- DSCR
- —
- Eligible?
- —
No personal income docs; deal must DSCR.
Hard money
10% down · 12.0% · 12mo
- Down + closing
- —
- Monthly P&I
- —
- Monthly cashflow
- —
- DSCR
- —
- Eligible?
- —
Short-term bridge; refi at stabilization.
Rent comps 40 comps
| Address | Beds | Baths | Sqft | Rent | $/sqft | DOM | Units | Dist |
|---|---|---|---|---|---|---|---|---|
| 15847 Chatham St Detroit, MI | 3.0 | 1.0 | 909 | $1,325 | $1.46 | 5d | 1 | 0.21mi |
| 16700 Lahser Rd Apt 18 Detroit, MI | 2.0 | 1.0 | 750 | $900 | $1.20 | 44d | 1 | 0.47mi |
| 16717 Trinity St Detroit, MI | 3.0 | 1.5 | 1101 | $1,250 | $1.14 | 44d | 1 | 0.73mi |
| 15340 Braile St Detroit, MI | 3.0 | 1.0 | 883 | $1,000 | $1.13 | 5d | 1 | 0.82mi |
| 16131 Dale St Detroit, MI | 3.0 | 1.0 | 1100 | $1,500 | $1.36 | 18d | 1 | 0.83mi |
| 22241 Lyndon St Detroit, MI | 3.0 | 1.0 | 960 | $1,100 | $1.15 | 17d | 1 | 0.84mi |
| 17328 McIntyre St Unit 2 Detroit, MI | 3.0 | 1.0 | 1200 | $1,250 | $1.04 | 44d | 1 | 0.89mi |
| 17355 McIntyre St Detroit, MI | 3.0 | 1.0 | 1500 | $1,250 | $0.83 | 44d | 1 | 0.92mi |
| 17274 Bentler St Detroit, MI | 2.0 | 1.0 | 700 | $838 | $1.20 | 24d | 2 | 0.92mi |
| 17274 Bentler St Detroit, MI | 2.0 | 1.0 | 700 | $850 | $1.21 | 44d | 2 | 0.92mi |
| 16194 Fielding St Unit 2 Detroit, MI | 2.0 | 1.0 | 750 | $950 | $1.27 | 15d | 1 | 0.93mi |
| 17274 Bentler St #46 Detroit, MI | 2.0 | 1.0 | 700 | $850 | $1.21 | 17d | 1 | 0.93mi |
| 17255 Westbrook St Detroit, MI | 3.0 | 2.0 | 1500 | $1,450 | $0.97 | 11d | 1 | 0.95mi |
| 16800 Telegraph Rd Detroit, MI | 2.0 | 1.0 | 775 | $875 | $1.13 | 44d | 1 | 0.97mi |
| 16207 Woodbine St Detroit, MI | 3.0 | 1.0 | 1000 | $1,294 | $1.29 | 5d | 1 | 0.98mi |
| 15318 Kentfield St Detroit, MI | 3.0 | 1.5 | 900 | $1,400 | $1.56 | 44d | 1 | 1.04mi |
| 14280 Bramell St Detroit, MI | 3.0 | 1.0 | 1100 | $1,500 | $1.36 | 17d | 1 | 1.05mi |
| 21440 Bennett St Detroit, MI | 3.0 | 1.0 | 1037 | $1,394 | $1.34 | 17d | 1 | 1.07mi |
| 16581 Wormer St Detroit, MI | 2.0 | 1.0 | 720 | $1,100 | $1.53 | 44d | 1 | 1.08mi |
| 16800 Wormer St Detroit, MI | 3.0 | 1.0 | 912 | $1,250 | $1.37 | 18d | 1 | 1.10mi |
| 15712 Vaughan St Detroit, MI | 3.0 | 1.0 | 1280 | $1,400 | $1.09 | 15d | 1 | 1.11mi |
| 15815 Evergreen Rd Detroit, MI | 3.0 | 1.0 | 1350 | $1,300 | $0.96 | 44d | 1 | 1.13mi |
| 14177 Bentler St Detroit, MI | 4.0 | 1.0 | 1000 | $1,475 | $1.48 | 44d | 1 | 1.15mi |
| 18025 Bentler St Detroit, MI | 3.0 | 1.0 | 728 | $1,250 | $1.72 | 24d | 1 | 1.15mi |
| 21451 Glenco St Detroit, MI | 3.0 | 1.0 | 1026 | $1,400 | $1.36 | 17d | 1 | 1.16mi |
| 15712 Evergreen Rd Detroit, MI | 2.0 | 1.0 | 850 | $1,050 | $1.24 | 44d | 1 | 1.16mi |
| 15519 Plainview Ave Detroit, MI | 3.0 | 1.0 | 900 | $1,396 | $1.55 | 17d | 1 | 1.20mi |
| 15490 Dixie Redford, MI | 3.0 | 1.0 | 912 | $1,600 | $1.75 | 5d | 1 | 1.21mi |
| 14541 Kentfield St Detroit, MI | 3.0 | 1.0 | 797 | $1,300 | $1.63 | 17d | 1 | 1.25mi |
| 17721 Westbrook St Detroit, MI | 4.0 | 1.0 | 1040 | $1,125 | $1.08 | 24d | 1 | 1.25mi |
| 14230 Riverview St Detroit, MI | 2.0 | 1.0 | 900 | $1,050 | $1.17 | 44d | 1 | 1.27mi |
| 14226 Riverview St Detroit, MI | 2.0 | 1.0 | 900 | $1,050 | $1.17 | 44d | 1 | 1.27mi |
| 14228 Riverview St Detroit, MI | 2.0 | 1.0 | 900 | $1,050 | $1.17 | 44d | 1 | 1.27mi |
| 14234 Riverview St Detroit, MI | 2.0 | 1.0 | 900 | $1,050 | $1.17 | 44d | 1 | 1.27mi |
| 14238 Riverview St Detroit, MI | 2.0 | 1.0 | 900 | $900 | $1.00 | 44d | 1 | 1.27mi |
| 14224 Riverview St Detroit, MI | 2.0 | 1.0 | 900 | $1,050 | $1.17 | 44d | 1 | 1.28mi |
| 14222 Riverview St Detroit, MI | 2.0 | 1.0 | 900 | $1,050 | $1.17 | 44d | 1 | 1.28mi |
| 14240 Riverview St Detroit, MI | 2.0 | 1.0 | 900 | $900 | $1.00 | 44d | 1 | 1.28mi |
| 14264 Riverview St Detroit, MI | 2.0 | 1.0 | 900 | $900 | $1.00 | 44d | 1 | 1.28mi |
| 14268 Riverview St Detroit, MI | 2.0 | 1.0 | 900 | $850 | $0.94 | 44d | 1 | 1.28mi |
Listing history 31 events
-
2026-06-18days on market $71,900 Active 134 DOM
-
2026-06-17days on market $71,900 Active 133 DOM
-
2026-06-15days on market $71,900 Active 131 DOM
-
2026-06-13days on market $71,900 Active 129 DOM
-
2026-06-13days on market $71,900 Active 128 DOM
-
2026-06-09days on market $71,900 Active 125 DOM
-
2026-06-08days on market $71,900 Active 124 DOM
-
2026-06-07days on market $71,900 Active 123 DOM
-
2026-06-04days on market $71,900 Active 120 DOM
-
2026-06-03days on market $71,900 Active 119 DOM
-
2026-06-01days on market $71,900 Active 117 DOM
-
2026-05-31days on market $71,900 Active 116 DOM
-
2026-03-21price $71,900 328-char remark
Show marketing remark (328 chars)
Renovated in 2021, this residence is perfect for a first time home buyer, or as an addition to an investor's portfolio. Come check it out. The accuracy of all information, regardless of the source is not guaranteed or warranted. All information should be independently verified. Contact the agent for showing and the best price.
-
2026-02-22price $72,900 328-char remark
Show marketing remark (328 chars)
Renovated in 2021, this residence is perfect for a first time home buyer, or as an addition to an investor's portfolio. Come check it out. The accuracy of all information, regardless of the source is not guaranteed or warranted. All information should be independently verified. Contact the agent for showing and the best price.
-
2026-02-21price $72,900 328-char remark
Show marketing remark (328 chars)
Renovated in 2021, this residence is perfect for a first time home buyer, or as an addition to an investor's portfolio. Come check it out. The accuracy of all information, regardless of the source is not guaranteed or warranted. All information should be independently verified. Contact the agent for showing and the best price.
-
2026-02-04$73,400 Active 328-char remark
Show marketing remark (328 chars)
Renovated in 2021, this residence is perfect for a first time home buyer, or as an addition to an investor's portfolio. Come check it out. The accuracy of all information, regardless of the source is not guaranteed or warranted. All information should be independently verified. Contact the agent for showing and the best price.
-
2026-01-27historical
-
2026-01-27historical
-
2025-12-14price $73,400
-
2025-12-13price $73,400
-
2025-09-21price $73,900
-
2025-09-21price $73,900
-
2025-07-30$74,900 Active
-
2025-07-30$74,900 Active
-
2025-01-01historical
-
2025-01-01historical
-
2024-08-31$72,900 Active
-
2024-08-31$72,900 Active
-
2019-01-03soldstatus $420,000
ⓘ Source: listings_history table (triggers on properties + properties_extension) + one-shot
backfill from property_details.listing_events for pre-trigger history.
Tax reassessment forecast MI · Partial reset (capped growth)
- Current annual tax
- $1,162 · $97/mo
- Projected year-2 tax
- $1,162 · $97/mo
- Expected delta
- $0/yr ($0/mo · 0.0%)
ⓘ Screening estimate from a state-policy table — verify with the county assessor before closing.
Climate risk First Street
- Flood 1/10 Low FEMA zone X (unshaded) · 0% chance over 30 yrs
- Wildfire 1/10 Low
- Heat 3/10 Moderate 7 d/yr ≥98°F today · 15 d/yr by 30 yrs out
- Wind 2/10 Low
- Air quality 3/10 Moderate 2 unhealthy d/yr today · 3 by 30 yrs out
Nearby sold comps map
Loading sold comps map…
Walkable amenities ~0.75 mi
Loading nearby amenities…
Taxation est. · year 1
- Rental income
- $15,053
- − Mortgage interest
- −$4,028
- − Property taxes
- −$1,162
- − Insurance
- −$360
- − Repairs & maintenance
- −$1,204
- − Management
- −$1,204
- − Depreciation
- −$2,092
- Taxable income
- $5,003
- Est. tax owed @ 24.0%
- −$1,201
- After-tax cash flow
- $4,644/yr
For passive investors: Depreciation is non-cash, so a rental often shows a tax loss while cash-flowing — sheltering income. Rental losses are passive: they offset passive income freely, and up to $25,000/yr can offset ordinary (W-2) income if you actively participate and your MAGI is under $100k (phasing out to $0 by $150k); unused losses carry forward. On sale, claimed depreciation is recaptured at up to 25%, and gains may owe capital-gains tax (a 1031 exchange can defer both). Figures are a year-1 estimate at your 24.0% rate — not tax advice; consult a CPA.
Schools (NCES district)
- District
- Detroit Public Schools Community District
- NCES district ID
- 2601103
- Math proficiency
- 10% ▼ -2.00%
- Reading proficiency
- 24% ▲ 6.00%
- Median HH income
- $25,815
- Composite
- 13.06/100
- National rank
- #9564
- State rank
- #499 of 540 in MI
Livability — Detroit
- Score
- 73/100
- State rank
- #218
- US rank
- #5427
Category grades
Schools grade is shown separately in the Schools card above.
Census & demographics
- Census place
- Detroit, MI
- County
- Wayne County · 1,562,939 people
- City population
- 572,865
- Metro
- Detroit-Warren-Dearborn, MI
- Population (ZIP)
- 22,622
- Household income
- $44,512
- Rent vs Own
- Severe rent burden
- 1151.0
Population outlook (Wayne County) Hauer SSP2
- Today (2025)
- 1,675,273 people
- By 2030
- 1,620,300 · -3.3%
- By 2040
- 1,502,341 · -10.3%
- By 2050
- 1,384,039 · -17.4%
- By 2075
- 1,124,592 · -32.9%
- By 2100
- 881,193 · -47.4%
Race, ethnicity, and origin ACS 2023
- Neighborhood character
- Predominantly Black (86%)
- Race & ethnicity
- Black 86% White 7% Two or more races 5% Hispanic / Latino 2%
- Common ancestry
- Romanian 1% Iranian 1%
- Foreign-born
- 1% · Canada
- Languages at home
- 97% English-only · Spanish 2%
Political lean MEDSL · Wayne
- 2024 margin
- Strong D (+29.0) · D 62.7% · R 33.7% · Other 3.6%
- 2008→2024 swing
- -20.5pp toward R · 2008: 49.5pp · 2024: 29.0pp
- All cycles
- 2024: D+29.0 2020: D+38.1 2016: D+37.3 2012: D+46.9 2008: D+49.5
Not yet ingested
- Civics
- —
Market trends
- HPI YoY
- ▼ -303.41%
- Current HPI
- 138.2779
- Rent YoY
- —
- Metro
- Detroit-Warren-Dearborn, MI
- State GDP YoY
- ▲ 1.37%
- F500 in state
- 28
Industry mix (Fortune 500 HQ in MI)
| Industry | F500 HQs | Revenue |
|---|---|---|
| Automotive Parts | 3 | $48B |
|
||
| Automotive | 2 | $372B |
|
||
| Chemicals | 1 | $45B |
|
||
| Automotive Retail | 1 | $29B |
|
||
| Healthcare / Medical Devices | 1 | $23B |
|
||
| Automotive Technology | 1 | $20B |
|
||
Price history
-82.9% since first listed19 events — show timeline
- 2026-03-21 Price Changed $71,900 MiRealSource-MiMLS
- 2026-03-21 Price Changed $71,900 REALCOMP
- 2026-02-22 Price Changed $72,900 MiRealSource-MiMLS
- 2026-02-21 Price Changed $72,900 REALCOMP
- 2026-02-04 Listed $73,400 REALCOMP
- 2026-02-04 Listed $73,400 MiRealSource-MiMLS
- 2026-01-27 Listing Removed — REALCOMP
- 2026-01-27 Listing Removed — MiRealSource-MiMLS
- 2025-12-14 Price Changed $73,400 MiRealSource-MiMLS
- 2025-12-13 Price Changed $73,400 REALCOMP
- 2025-09-21 Price Changed $73,900 MiRealSource-MiMLS
- 2025-09-21 Price Changed $73,900 REALCOMP
- 2025-07-30 Listed $74,900 REALCOMP
- 2025-07-30 Listed $74,900 MiRealSource-MiMLS
- 2025-01-01 Listing Removed — MiRealSource-MiMLS
- 2025-01-01 Listing Removed — REALCOMP
- 2024-08-31 Listed $72,900 REALCOMP
- 2024-08-31 Listed $72,900 MiRealSource-MiMLS
- 2019-01-03 Sold (Public Records) $420,000 Public Records
Property tax history
+2.0%/yrLatest (2025): $1,162 · -53.9% YoY. Source: county tax records.
Cash-flow waterfall
monthlySold comps — $/sqft
last 12 mo · ≤1 miLoading sold comps…