 Multi-family
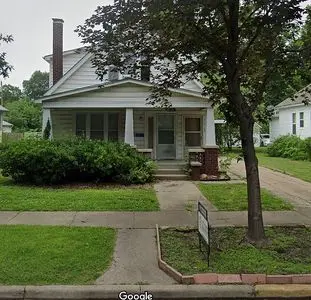
608 Moro St · Manhattan, KS
Flood risk 3/10 · Minor
- FEMA flood zone
- X (shaded)
- Chance of flooding over 30 yrs
- 0.1%
- Est. flood insurance / yr
- $473 – $860
Fire risk 2/10 · Minimal
- Est. fire insurance / yr
- $1,154 – $2,142
Heat risk 4/10 · Minor
- Hot days now (above 107°F)
- 7 days/yr
- Hot days in 30 yrs
- 16 days/yr
Wind risk 2/10 · Minimal
- Chance of severe wind over 30 yrs
- —
Air-quality risk 2/10 · Minimal
- Unhealthy air days now
- 2 days/yr
- Unhealthy air days in 30 yrs
- 2 days/yr
Risk factors via First Street. Map © Google.
Why this score? — see what drove the C grade
The composite is a weighted blend of 9 inputs, each scored 0–100. Each bar is that input's sub-score; the figure is the points it added to the 100-point composite (weight × sub-score).
- Cash flow +22.8/30.0
- ARV discount +7.5/15.0
- DSCR +7.3/10.0
- 1% rule +5.9/10.0
- Livability +4.2/5.0
- Rent growth +4.0/5.0
- Schools +3.6/10.0
- Condition / age +2.5/5.0
- Appreciation +0.0/10.0
$274,900
🖨 Deal sheet 📄 Offer letter ✓ Due diligence
Multi-family units
County records classify this as Multi-Family (5+ Unit). Listing-text estimate: 1 unit. estimate disagrees with records
5+ unit building — per-unit beds/baths from public records are typically unavailable; the breakdown below (if shown) is an estimate from the listing text.
Listing remarks MLS
This multi-family home is split into 3 units. Each unit is currently income generating with a 12 month lease in place. Please contact for more details for rent roll and information. New roof 2024. Onsite laundry also offered. Unit 1 - 2bd/1ba - first floor living Unit 2 - 2bd/1ba - second floor living Unit 3 - 1bd/1ba - Above garage living
Key facts
- Onsite laundry
- Income generating
- Multi-family home
Tags
Neighborhood map
What this means for you Summary
Snapshot
- This is a 5-bed/3.0-bath multifamily listed at $275k.
Deal economics
- At list price, monthly cash flow is $480 ($6k/yr) — positive.
- The deal already cash-flows at list — no discount required.
- Meets the 1% rule at list price ($3k rent vs $275k).
- Recommended offer: $267k (3.0% below list) — sets the bar for market timing.
Location & tenants
- Location reads 83/100 on livability (#6 in KS, #979 nationally) — a professional / high-income tenant draw. Strengths: amenities A+, commute A+, cost of living A+; Watch: crime C-, employment C-.
- Manhattan-Ogden (urban): math 39% / reading 46% proficiency, ranked #26 of 169 in KS (top 15%) — families likely to look elsewhere, expect single-tenant / working-renter base with shorter leases.
- Market conditions: Rents rising fast (+6.0%/yr); 336 active listings in the ZIP; 132 units permitted in Riley County in 2024 (35 in 5+ unit buildings).
- At $2,996/mo this rent would consume 66% of the median local household income ($55k/yr) (locally 3089% of renters already pay >50% of income on rent) — very limited rent-growth headroom before tenants either downsize or default.
Forward outlook
- Local home prices are declining (-3.0%/yr); year-one equity from $2k of loan paydown is wiped out by about $8k of value loss. Plan a longer hold.
- Riley County population projected at +30% by 2050 — long-run rental-demand tailwind backs the buy-and-hold thesis.
- At projected returns (-3.0% appreciation + 6.0% rent growth), your $77k cash investment doubles in ~10 years — after that, you're playing with house money.
Negotiation context
- It's been on market 38 days — a 3% lower offer ($267k) is reasonable based on typical stale-listing flexibility.
- 7 sale attempts since 14y ago with the ask held roughly flat each time — persistent listings suggest the price (not the market) is what's stuck; bring a comps-based counter.
Risks & watch-outs
- Watch-outs: built in 1890 — expect roof / HVAC / electrical / plumbing capex.
Questions for the listing agent
- It's been on market 38 days. Have you received any prior offers? Is the seller open to a 3% concession, seller financing, or rate buy-down credit?
- Built in 1890 — when were the roof, HVAC, electrical panel, plumbing, and water heater last replaced?
- Is there a deadline driving the sale (1031 exchange, divorce, estate, relocation)? That informs how much negotiation room exists.
- What's the average days-on-market for RENTAL listings here right now (not sales)? A rising rental-DOM trend means longer vacancies and softer asking-rent achievability than the comps imply.
- What's the recent tenant-quality profile in this submarket — average credit score on applications, eviction rate, late-payment / NSF rate, and stable-employment percentage? A property-management company in the area should have these aggregated.
- How much new apartment / multifamily construction is in the pipeline within 1–3 miles? Heavy new supply (>2% of stock underway) typically softens rents 12–24 months out; light construction supports rent growth.
Investment metrics
- 1% rule
- 1.09% ✓
- Cap rate
- 8.39%
- Cash-on-cash
- 7.48%
- DSCR
- 1.33
- GRM
- 7.6
CMA / ARV
No comps found within radius.
Projected returns pro-forma
-3.0% appreciation · 6.02% rent growth · sell at horizon
- IRR
- -1.5%
- Equity multiple
- 0.94×
- Total profit
- $-4,581
- Equity at exit
- $40,988
- IRR
- 11.1%
- Equity multiple
- 1.99×
- Total profit
- $76,449
- Equity at exit
- $23,768
Cash invested: $76,972 (down + closing). Projections, not guarantees.
Landlord ↔ Tenant lean methodology
- Overall (STATE)
- 83 Strongly Landlord-Friendly
- State Kansas
- 83 Strongly Landlord-Friendly · R+10
- County
- — inherits STATE
- City
- — inherits STATE
ZIP-level market 66502
- Rents YoY
- 6.0%
- Active inventory
- 336
- Price-to-rent
- 22.3×
Monthly cashflow live
- Estimated rent
- $2,996 medium interval (Pro) →
- Mortgage (P&I)
- −$1,442
- Tax from tax record
- −$331 /mo · $3,973/yr
- Insurance
- −$115
- HOA
- −$0
- Vacancy / Maint / Mgmt
- −$629
- Net cashflow
- $480
Break-even live
3-unit breakdown (identical units grouped — click to expand)
| Units | Beds | Baths | Est. rent |
|---|---|---|---|
| 2× units | 2 | 1 | $2,050 |
| #1 | 2 | 1 | $1,025 |
| #2 | 2 | 1 | $1,025 |
| 1× unit | 1 | 1 | $946 |
| Total (3 units) | $2,996 | ||
UW: 25.0% down · 7.5% · 30yr · 1.5% tax · 5.0% vac · 8.0% maint · 8.0% mgmt
Financing live
Cash to close
- Down payment
- $68,725
- Closing costs
- $8,247
- Reserves months
- —
- Total cash needed
- —
Loan-product check · same deal, 3 products live
Conventional
25% down · 7.5% · 30yr
- Down + closing
- —
- Monthly P&I
- —
- Monthly cashflow
- —
- DSCR
- —
- Eligible?
- —
Personal DTI + credit; lowest rate.
DSCR
20% down · 8.5% · 30yr
- Down + closing
- —
- Monthly P&I
- —
- Monthly cashflow
- —
- DSCR
- —
- Eligible?
- —
No personal income docs; deal must DSCR.
Hard money
10% down · 12.0% · 12mo
- Down + closing
- —
- Monthly P&I
- —
- Monthly cashflow
- —
- DSCR
- —
- Eligible?
- —
Short-term bridge; refi at stabilization.
Listing history 32 events
-
2026-06-19days on market $274,900 Active 38 DOM
-
2026-06-18days on market $274,900 Active 37 DOM
-
2026-06-17days on market $274,900 Active 36 DOM
-
2026-06-16days on market $274,900 Active 35 DOM
-
2026-06-15days on market $274,900 Active 34 DOM
-
2026-06-14days on market $274,900 Active 32 DOM
-
2026-06-13days on market $274,900 Active 31 DOM
-
2026-06-10days on market $274,900 Active 29 DOM
-
2026-06-09days on market $274,900 Active 28 DOM
-
2026-06-08days on market $274,900 Active 27 DOM
-
2026-06-07days on market $274,900 Active 26 DOM
-
2026-06-03days on market $274,900 Active 22 DOM
-
2026-06-02days on market $274,900 Active 21 DOM
-
2026-06-01days on market $274,900 Active 20 DOM
-
2026-05-31days on market $274,900 Active 19 DOM
-
2026-05-30days on market $274,900 Active 273 DOM
-
2026-05-12$274,900 Active 341-char remark
Show marketing remark (341 chars)
This multi-family home is split into 3 units. Each unit is currently income generating with a 12 month lease in place. Please contact for more details for rent roll and information. New roof 2024. Onsite laundry also offered. Unit 1 - 2bd/1ba - first floor living Unit 2 - 2bd/1ba - second floor living Unit 3 - 1bd/1ba - Above garage living
-
2025-08-29$274,900 Active
-
2024-09-04soldstatus
-
2024-09-03soldstatus 479-char remark
Show marketing remark (479 chars)
Gross rents for this property are currently $2365 per month and the property is already leased thru 2025 for $2525 per month! This property is professionally managed through American Property Management and has a strong rental history through then. Tenants are responsible for their own utilities. Please allow 24 hours notice for showings. 3D tours and additional documents available upon request. Don't miss out on your chance to add this cash flowing rental to your portfolio?
-
2024-03-25$225,000 479-char remark
Show marketing remark (479 chars)
Gross rents for this property are currently $2365 per month and the property is already leased thru 2025 for $2525 per month! This property is professionally managed through American Property Management and has a strong rental history through then. Tenants are responsible for their own utilities. Please allow 24 hours notice for showings. 3D tours and additional documents available upon request. Don't miss out on your chance to add this cash flowing rental to your portfolio?
-
2024-03-14historical $700
-
2024-03-14historical $700
-
2024-03-13$700
-
2024-03-13$1,095
-
2024-01-28historical $1,095
-
2024-01-21$1,095
-
2022-11-22historical
-
2021-12-06soldstatus
-
2013-04-16soldstatus
-
2013-04-15soldstatus
-
2012-09-10$160,000
ⓘ Source: listings_history table (triggers on properties + properties_extension) + one-shot
backfill from property_details.listing_events for pre-trigger history.
Tax reassessment forecast KS · Resets to sale price
- Current annual tax
- $3,973 · $331/mo
- Projected year-2 tax
- $3,973 · $331/mo
- Expected delta
- $0/yr ($0/mo · 0.0%)
ⓘ Screening estimate from a state-policy table — verify with the county assessor before closing.
Climate risk First Street
- Flood 3/10 Moderate FEMA zone X (shaded) · 10% chance over 30 yrs
- Wildfire 2/10 Low
- Heat 4/10 Moderate 7 d/yr ≥107°F today · 16 d/yr by 30 yrs out
- Wind 2/10 Low
- Air quality 2/10 Low 2 unhealthy d/yr today · 2 by 30 yrs out
Nearby sold comps map
Loading sold comps map…
Walkable amenities ~0.75 mi
Loading nearby amenities…
Taxation est. · year 1
- Rental income
- $35,952
- − Mortgage interest
- −$15,399
- − Property taxes
- −$3,973
- − Insurance
- −$1,374
- − Repairs & maintenance
- −$2,876
- − Management
- −$2,876
- − Depreciation
- −$7,997
- Taxable income
- $1,457
- Est. tax owed @ 24.0%
- −$350
- After-tax cash flow
- $5,406/yr
For passive investors: Depreciation is non-cash, so a rental often shows a tax loss while cash-flowing — sheltering income. Rental losses are passive: they offset passive income freely, and up to $25,000/yr can offset ordinary (W-2) income if you actively participate and your MAGI is under $100k (phasing out to $0 by $150k); unused losses carry forward. On sale, claimed depreciation is recaptured at up to 25%, and gains may owe capital-gains tax (a 1031 exchange can defer both). Figures are a year-1 estimate at your 24.0% rate — not tax advice; consult a CPA.
Schools (NCES district)
- District
- Manhattan-Ogden
- NCES district ID
- 2009180
- Math proficiency
- 39% ▼ -1.00%
- Reading proficiency
- 46% ▲ 1.00%
- Median HH income
- $44,001
- Composite
- 35.97/100
- National rank
- #4795
- State rank
- #26 of 169 in KS
Livability — Manhattan
- Score
- 83/100
- State rank
- #6
- US rank
- #979
Category grades
Schools grade is shown separately in the Schools card above.
Census & demographics
- Census place
- Manhattan, KS
- County
- Riley County · 62,662 people
- City population
- 60,966
- Metro
- Manhattan, KS
- Population (ZIP)
- 43,693
- Household income
- $54,833
- Rent vs Own
- Severe rent burden
- 3089.0
Population outlook (Riley County) Hauer SSP2
- Today (2025)
- 83,656 people
- By 2030
- 89,075 · +6.5%
- By 2040
- 99,100 · +18.5%
- By 2050
- 109,146 · +30.5%
- By 2075
- 134,178 · +60.4%
- By 2100
- 153,653 · +83.7%
Race, ethnicity, and origin ACS 2023
- Neighborhood character
- Predominantly White (78%)
- Race & ethnicity
- White 78% Hispanic / Latino 9% Two or more races 8% Black 4% Asian 3% Native American 1%
- Hispanic origin (detail)
- Mexican 6%
- Common ancestry
- Slovak 3% Italian 3% Lithuanian 2%
- Foreign-born
- 8% · Canada, China
- Languages at home
- 91% English-only · Spanish 5% Other Indo-European 2% Chinese 1%
Political lean MEDSL · Riley
- 2024 margin
- Toss-up / Even · D 49.6% · R 47.8% · Other 2.5%
- 2008→2024 swing
- +8.8pp toward D · 2008: -7.0pp · 2024: 1.8pp
- All cycles
- 2024: D+1.8 2020: D+3.2 2016: R+4.5 2012: R+12.7 2008: R+7.0
Not yet ingested
- Civics
- —
Market trends
- HPI YoY
- ▼ -283.54%
- Current HPI
- 172.7795
- Rent YoY
- ▲ 6.02%
- Metro
- Manhattan, KS
- State GDP YoY
- —
- F500 in state
- 0
Price history
+71.8% since first listed16 events — show timeline
- 2026-05-12 Listed $274,900 FSBO.com
- 2025-08-29 Listed $274,900 Fizber.com
- 2024-09-04 Sold (Public Records) — Public Records
- 2024-09-03 Sold (MLS) — Sunflower MLS as distributed by MLS GRID
- 2024-03-25 Listed $225,000 Sunflower MLS as distributed by MLS GRID
- 2024-03-14 Rental Removed $700 APPFOLIO
- 2024-03-14 Rental Removed $700 APPFOLIO
- 2024-03-13 Listed for Rent $700 APPFOLIO
- 2024-03-13 Listed for Rent $1,095 APPFOLIO
- 2024-01-28 Rental Removed $1,095 APPFOLIO
- 2024-01-21 Listed for Rent $1,095 APPFOLIO
- 2022-11-22 Rental Removed — RENT.
- 2021-12-06 Sold (Public Records) — Public Records
- 2013-04-16 Sold (MLS) — FHAOR as distributed by MLS GRID
- 2013-04-15 Sold (Public Records) — Public Records
- 2012-09-10 Listed $160,000 FHAOR as distributed by MLS GRID
Property tax history
+5.0%/yrLatest (2025): $3,973 · +44.4% YoY. Source: county tax records.
Cash-flow waterfall
monthlySold comps — $/sqft
last 12 mo · ≤1 miLoading sold comps…