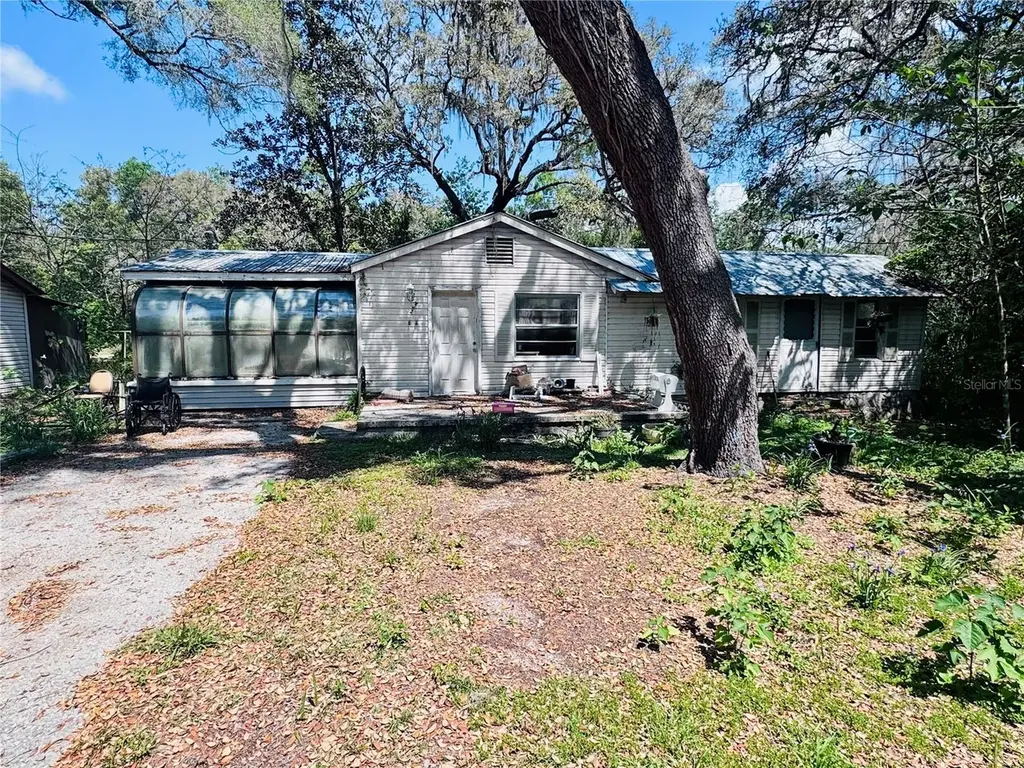
1318 Andrew St · Inverness, FL
Flood risk 3/10 · Minor
- FEMA flood zone
- X (unshaded)
- Chance of flooding over 30 yrs
- 0.2%
- Est. flood insurance / yr
- $507 – $1,088
Fire risk 5/10 · Moderate
- Est. fire insurance / yr
- $947 – $1,759
Heat risk 8/10 · Major
- Hot days now (above 108°F)
- 7 days/yr
- Hot days in 30 yrs
- 22 days/yr
Wind risk 9/10 · Severe
- Chance of severe wind over 30 yrs
- 99.0%
Air-quality risk 2/10 · Minimal
- Unhealthy air days now
- 2 days/yr
- Unhealthy air days in 30 yrs
- 2 days/yr
Risk factors via First Street. Map © Google.
Why this score? — see what drove the C- grade
The composite is a weighted blend of 9 inputs, each scored 0–100. Each bar is that input's sub-score; the figure is the points it added to the 100-point composite (weight × sub-score).
- Cash flow +16.6/30.0
- ARV discount +15.0/15.0
- DSCR +5.2/10.0
- 1% rule +4.6/10.0
- Schools +4.1/10.0
- Livability +3.4/5.0
- Rent growth +2.5/5.0
- Condition / age +2.5/5.0
- Appreciation +0.0/10.0
$145,000
🖨 Deal sheet 📄 Offer letter ✓ Due diligence
Listing remarks
Investor special with strong income potential. This fixer-upper offers a rare opportunity to own two separate dwellings on one property, creating the possibility for dual rental income or multi-generational living. Each unit has its own space, allowing for flexibility in leasing or occupancy. Centrally located with convenient access to major roads, shopping, dining, and local amenities. The property requires renovation and is priced accordingly, making it ideal for investors or buyers looking to add value and build equity. Bring your vision and restore this property to its full potential. Opportunities like this, with multiple income streams, are limited.
Key facts
- Convenient access
- Dual rental income
- Local amenities
Tags
Property features AI
Finance
- Other: Property type: Residential — Single Family Residence; Zoning: IM
- Financial info: No investor or income/expense information provided
- HOA & community: No HOA
Exterior
- Parking: No parking details provided
- Security: No security features listed
- Utilities: Private water; Public sewer; Electricity available
- Home design: Single family residence; One story; Faces north
- Construction: Frame construction; Metal roof; Slab foundation; Built on a 0.34-acre lot (approx. 150 x 100)
- Exterior features: Limerock road access
Interior
- Kitchen: Range; Refrigerator
- Bedrooms: 3 bedrooms
- Flooring: Carpet; Linoleum
- Bathrooms: 2 full bathrooms
- Heating & cooling: No heating listed; Central air; Wall/window unit(s)
- Interior features: No notable interior features listed
- Laundry & utility: Outdoor laundry area
Neighborhood map
What this means for you Summary
Snapshot
- This is a 2-bed/1.0-bath single-family listed at $145k.
Deal economics
- At list price, monthly cash flow is $88 ($1k/yr) — positive.
- The deal already cash-flows at list — no discount required.
- To meet the 1% rule (rent ≥ 1% of price), the offer needs to be $139k (4.4% below list).
- Recommended offer: $139k (4.4% below list) — sets the bar for 1% rule.
- Cap rate 7.0% vs local median 4.9% in Inverness — top-decile yield for the area; either an underpriced asset or a hidden risk that comps aren't pricing in. Stress-test before assuming the spread holds.
Location & tenants
- Location reads 67/100 on livability (#564 in FL) — a middle-class / working-renter tenant base. Strengths: cost of living A+, housing A-; Watch: health & safety C-, amenities F, commute F.
- Citrus (rural): math 49% / reading 50% proficiency, ranked #44 of 73 in FL (top 60%) — families likely to look elsewhere, expect single-tenant / working-renter base with shorter leases.
- Market conditions: 421 active listings in the ZIP; 3 comparable units currently listed for rent nearby; rentals at typical pace (median 21d on market — plan ~3-4 weeks tenant-placement turnaround); 2,443 units permitted in Citrus County in 2024 (0 in 5+ unit buildings).
Forward outlook
- Local home prices are declining (-3.0%/yr); year-one equity from $1k of loan paydown is wiped out by about $4k of value loss. Plan a longer hold.
- Citrus County population projected to shrink 10% by 2050 — rents likely to lag national; underwrite the cash flow, not the appreciation.
Negotiation context
- It's been on market 60 days — a 3% lower offer ($141k) is reasonable based on typical stale-listing flexibility.
Risks & watch-outs
- Watch-outs: built in 1958 — expect roof / HVAC / electrical / plumbing capex.
- Climate carrying-cost: severe wind risk, 99% chance of damaging wind over 30y; moderate wildfire risk; extreme-heat days projected 7→22/yr by 2055 (HVAC capex compounding) — expect insurance premiums to compound above CPI over the hold.
Questions for the listing agent
- It's been on market 60 days. Have you received any prior offers? Is the seller open to a 4% concession, seller financing, or rate buy-down credit?
- Built in 1958 — when were the roof, HVAC, electrical panel, plumbing, and water heater last replaced?
- Is there a deadline driving the sale (1031 exchange, divorce, estate, relocation)? That informs how much negotiation room exists.
- Schools are B-rated — typically a magnet for longer-tenancy family renters. What's the average tenant stay here, and is there a school-zone premium baked into asking?
- What's the average days-on-market for RENTAL listings here right now (not sales)? A rising rental-DOM trend means longer vacancies and softer asking-rent achievability than the comps imply.
- What's the recent tenant-quality profile in this submarket — average credit score on applications, eviction rate, late-payment / NSF rate, and stable-employment percentage? A property-management company in the area should have these aggregated.
- How much new for-sale + rental construction is in the pipeline within 1–3 miles? Heavy new supply typically softens prices + rents 12–24 months out; constrained supply supports both.
Investment metrics
- 1% rule
- 0.96% ✗
- Cap rate
- 7.02%
- Cash-on-cash
- 2.61%
- DSCR
- 1.12
- GRM
- 8.7
CMA / ARV
- ARV (on-the-fly)
- $177,450
- Comps found
- 9
Show comp detail 9 sales within ~0.75 mi
| Address | Dist | Beds/Ba | Sqft | Sold | Price | $/sf | Match |
|---|---|---|---|---|---|---|---|
| 5403 E Tangelo Ln | 0.51mi | 2/1.0 | 964 (-1%) | 2mo | $169,000 | $175 | 73 |
| 636 Whispering Pines Blvd | 0.66mi | 2/2.0 | 971 (-0%) | 2mo | $170,000 | $175 | 63 |
| 5175 E Tangelo Ln | 0.47mi | 2/1.0 | 848 (-13%) | 4mo | $175,000 | $206 | 53 |
| 1019 E Turner Camp Rd | 0.66mi | 2/2.0 | 988 (+1%) | 12mo | $144,000 | $146 | 53 |
| 654 Whispering Pines Blvd | 0.62mi | 2/2.0 | 971 (-0%) | 18mo | $182,000 | $187 | 51 |
| 1867 Elderberry Ln | 0.71mi | 2/2.0 | 991 (+2%) | 16mo | $178,000 | $180 | 47 |
| 1864 Juneberry Ln | 0.72mi | 2/2.0 | 959 (-2%) | 22mo | $174,999 | $182 | 41 |
| 1018 Jones Ave | 0.63mi | 3/1.0 (+1) | 1,066 (+9%) | 15mo | $199,900 | $188 | 38 |
| 904 Russell Ave | 0.61mi | 2/1.0 | 1,102 (+13%) | 19mo | $215,000 | $195 | 34 |
Match score weights: distance 35% · size 25% · config 20% · recency 20%. Top-matched comps best support the ARV.
Projected returns pro-forma
-3.0% appreciation · 3.0% rent growth · sell at horizon
- IRR
- -12.2%
- Equity multiple
- 0.56×
- Total profit
- $-17,850
- Equity at exit
- $21,620
- IRR
- -3.0%
- Equity multiple
- 0.80×
- Total profit
- $-8,208
- Equity at exit
- $12,537
Cash invested: $40,600 (down + closing). Projections, not guarantees.
Landlord ↔ Tenant lean methodology
- Overall (STATE)
- 87 Strongly Landlord-Friendly
- State Florida
- 87 Strongly Landlord-Friendly · R+3
- County
- — inherits STATE
- City
- — inherits STATE
ZIP-level market 34453
- Home prices YoY
- -26.1%
- Active inventory
- 421
- Price-to-rent
- 8.7×
Monthly cashflow live
- Estimated rent
- $1,386 medium interval (Pro) →
- Mortgage (P&I)
- −$760
- Tax from tax record
- −$186 /mo · $2,227/yr
- Insurance
- −$60
- HOA
- −$0
- Vacancy / Maint / Mgmt
- −$291
- Net cashflow
- $88
Break-even live
UW: 25.0% down · 7.5% · 30yr · 1.5% tax · 5.0% vac · 8.0% maint · 8.0% mgmt
Financing live
Cash to close
- Down payment
- $36,250
- Closing costs
- $4,350
- Reserves months
- —
- Total cash needed
- —
Loan-product check · same deal, 3 products live
Conventional
25% down · 7.5% · 30yr
- Down + closing
- —
- Monthly P&I
- —
- Monthly cashflow
- —
- DSCR
- —
- Eligible?
- —
Personal DTI + credit; lowest rate.
DSCR
20% down · 8.5% · 30yr
- Down + closing
- —
- Monthly P&I
- —
- Monthly cashflow
- —
- DSCR
- —
- Eligible?
- —
No personal income docs; deal must DSCR.
Hard money
10% down · 12.0% · 12mo
- Down + closing
- —
- Monthly P&I
- —
- Monthly cashflow
- —
- DSCR
- —
- Eligible?
- —
Short-term bridge; refi at stabilization.
Rent comps 3 comps
| Address | Beds | Baths | Sqft | Rent | $/sqft | DOM | Units | Dist |
|---|---|---|---|---|---|---|---|---|
| 2400 Forest Dr Inverness, FL | 2.0 | 2.0 | 1035 | $1,425 | $1.38 | 20d | 2 | 1.12mi |
| 512 Long Ave Unit B Inverness, FL | 2.0 | 1.0 | 765 | $1,170 | $1.53 | 20d | 1 | 1.19mi |
| 412 Tompkins St Unit 4 Inverness, FL | 2.0 | 1.0 | 810 | $1,300 | $1.60 | 20d | 1 | 1.47mi |
Listing history 16 events
-
2026-06-19days on market $145,000 Active 60 DOM
-
2026-06-18days on market $145,000 Active 59 DOM
-
2026-06-17days on market $145,000 Active 58 DOM
-
2026-06-16days on market $145,000 Active 57 DOM
-
2026-06-15days on market $145,000 Active 56 DOM
-
2026-06-14days on market $145,000 Active 54 DOM
-
2026-06-13days on market $145,000 Active 53 DOM
-
2026-06-09days on market $145,000 Active 50 DOM
-
2026-06-08days on market $145,000 Active 49 DOM
-
2026-06-07days on market $145,000 Active 48 DOM
-
2026-06-03days on market $145,000 Active 44 DOM
-
2026-06-02days on market $145,000 Active 43 DOM
-
2026-06-01days on market $145,000 Active 42 DOM
-
2026-05-31days on market $145,000 Active 41 DOM
-
2026-05-30days on market $145,000 Active 40 DOM
-
2026-04-20$145,000 Active
ⓘ Source: listings_history table (triggers on properties + properties_extension) + one-shot
backfill from property_details.listing_events for pre-trigger history.
Tax reassessment forecast FL · Resets to sale price
- Current annual tax
- $2,227 · $186/mo
- Projected year-2 tax
- $2,227 · $186/mo
- Expected delta
- $0/yr ($0/mo · 0.0%)
ⓘ Screening estimate from a state-policy table — verify with the county assessor before closing.
Climate risk First Street
- Flood 3/10 Moderate FEMA zone X (unshaded) · 20% chance over 30 yrs
- Wildfire 5/10 Major
- Heat 8/10 Severe 7 d/yr ≥108°F today · 22 d/yr by 30 yrs out
- Wind 9/10 Extreme 99% chance of damaging wind over 30 yrs
- Air quality 2/10 Low 2 unhealthy d/yr today · 2 by 30 yrs out
Nearby sold comps map
Loading sold comps map…
Walkable amenities ~0.75 mi
Loading nearby amenities…
Taxation est. · year 1
- Rental income
- $16,628
- − Mortgage interest
- −$8,122
- − Property taxes
- −$2,227
- − Insurance
- −$725
- − Repairs & maintenance
- −$1,330
- − Management
- −$1,330
- − Depreciation
- −$4,218
- Taxable loss
- −$1,325
- Est. tax savings @ 24.0%
- +$318
- After-tax cash flow
- $1,377/yr
For passive investors: Depreciation is non-cash, so a rental often shows a tax loss while cash-flowing — sheltering income. Rental losses are passive: they offset passive income freely, and up to $25,000/yr can offset ordinary (W-2) income if you actively participate and your MAGI is under $100k (phasing out to $0 by $150k); unused losses carry forward. On sale, claimed depreciation is recaptured at up to 25%, and gains may owe capital-gains tax (a 1031 exchange can defer both). Figures are a year-1 estimate at your 24.0% rate — not tax advice; consult a CPA.
Schools (NCES district)
- District
- Citrus
- NCES district ID
- 1200270
- Math proficiency
- 49% ▼ -10.00%
- Reading proficiency
- 50% ▼ -6.00%
- Median HH income
- $38,618
- Composite
- 41.28/100
- National rank
- #3519
- State rank
- #44 of 73 in FL
Livability — Inverness
- Score
- 67/100
- State rank
- #564
- US rank
- #10791
Category grades
Schools grade is shown separately in the Schools card above.
Census & demographics
- Census place
- Inverness, FL
- County
- Citrus County · 111,314 people
- City population
- 10,621
- Metro
- Homosassa Springs, FL
- Population (ZIP)
- 10,621
- Household income
- $57,568
- Rent vs Own
- Severe rent burden
- 240.0
Population outlook (Citrus County) Hauer SSP2
- Today (2025)
- 138,622 people
- By 2030
- 136,886 · -1.3%
- By 2040
- 132,009 · -4.8%
- By 2050
- 125,196 · -9.7%
- By 2075
- 108,570 · -21.7%
- By 2100
- 84,454 · -39.1%
Race, ethnicity, and origin ACS 2023
- Neighborhood character
- Predominantly White (87%)
- Race & ethnicity
- White 87% Hispanic / Latino 6% Black 3% Two or more races 3% Asian 2%
- Hispanic origin (detail)
- Puerto Rican 2%
- Common ancestry
- Lithuanian 3% Romanian 3% Italian 3%
- Foreign-born
- 4% · Canada
- Languages at home
- 94% English-only · Spanish 4% Tagalog/Filipino 1% Other Asian/Pacific 0%
Political lean MEDSL · Citrus
- 2024 margin
- Solid R (+45.9) · D 26.8% · R 72.6%
- 2008→2024 swing
- -29.8pp toward R · 2008: -16.1pp · 2024: -45.9pp
- All cycles
- 2024: R+45.9 2020: R+41.0 2016: R+39.7 2012: R+21.9 2008: R+16.1
Not yet ingested
- Civics
- —
Market trends
- HPI YoY
- ▼ -103.32%
- Current HPI
- 291.8965
- Rent YoY
- —
- Metro
- Homosassa Springs, FL
- State GDP YoY
- ▲ 3.28%
- F500 in state
- 36
Industry mix (Fortune 500 HQ in FL)
| Industry | F500 HQs | Revenue |
|---|---|---|
| Industrial Technology | 2 | $29B |
|
||
| Insurance | 2 | $17B |
|
||
| Retail | 1 | $60B |
|
||
| Technology Distribution | 1 | $58B |
|
||
| Homebuilding | 1 | $35B |
|
||
| Technology Manufacturing | 1 | $35B |
|
||
Price history
1 event — show timeline
- 2026-04-20 Listed $145,000 Stellar MLS as Distributed by MLS Grid
Property tax history
+11.8%/yrLatest (2025): $2,227 · +4.6% YoY. Source: county tax records.
Cash-flow waterfall
monthlySold comps — $/sqft
last 12 mo · ≤1 miLoading sold comps…