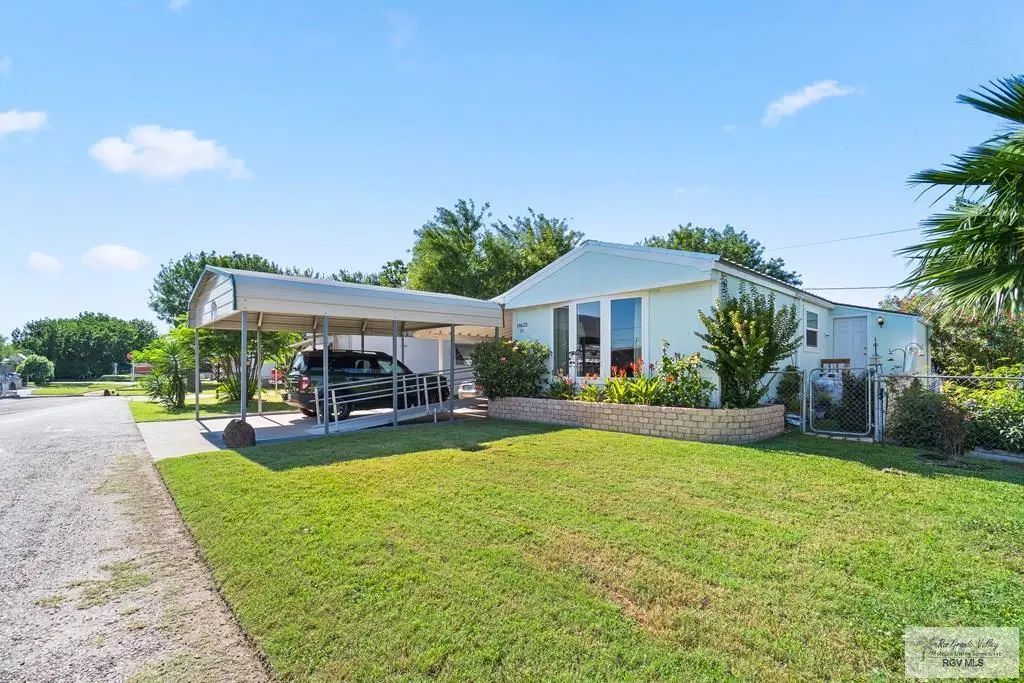
14623 Oak St #76 · Harlingen, TX
Flood risk 1/10 · Minimal
- FEMA flood zone
- X (shaded)
- Chance of flooding over 30 yrs
- 0.0%
- Est. flood insurance / yr
- $507 – $1,088
Fire risk 5/10 · Moderate
- Est. fire insurance / yr
- $1,222 – $2,270
Heat risk 9/10 · Severe
- Hot days now (above 111°F)
- 6 days/yr
- Hot days in 30 yrs
- 20 days/yr
Wind risk 8/10 · Major
- Chance of severe wind over 30 yrs
- 99.0%
Air-quality risk 1/10 · Minimal
- Unhealthy air days now
- 0 days/yr
- Unhealthy air days in 30 yrs
- 0 days/yr
Risk factors via First Street. Map © Google.
Why this score? — see what drove the B- grade
The composite is a weighted blend of 9 inputs, each scored 0–100. Each bar is that input's sub-score; the figure is the points it added to the 100-point composite (weight × sub-score).
- Cash flow +30.0/30.0
- DSCR +10.0/10.0
- 1% rule +9.2/10.0
- ARV discount +4.9/15.0
- Condition / age +3.8/5.0
- Livability +3.7/5.0
- Schools +2.5/10.0
- Rent growth +2.0/5.0
- Appreciation +0.0/10.0
$89,950
🖨 Deal sheet 📄 Offer letter ✓ Due diligence
Listing remarks
Located in a desirable 55+ community, this well-maintained 2-bedroom, 2-bath home features both a garage and carport for ample parking. The property includes a handicap-accessible ramp, recently installed plank flooring, and a metal roof that is only 2 years old. The kitchen offers abundant cabinet space along with beautiful granite countertops. Brand-new double-pane windows provide improved energy efficiency and comfort
Key facts
- Metal roof
- Plenty of cabinets
- Granite counters
Tags
Property features AI
Finance
- Other: Residential property
- HOA & community: Senior community
Exterior
- Parking: Attached garage (1 car)
- Security: Smoke detector(s)
- Utilities: Public water; Septic tank sewer
- Home design: Manufactured home; Single-story
- Construction: Vinyl siding
- Exterior features: Metal roof; Lot in Sun Valley Acres subdivision; 0.11-acre lot
Interior
- Kitchen: No kitchen appliance details provided
- Bedrooms: Manufactured home bedrooms
- Flooring: Carpet; Laminate
- Bathrooms: 2 full bathrooms
- Heating & cooling: Central heating (electric); Central air
- Interior features: Ceiling fan(s); Smoke detector(s)
- Laundry & utility: No laundry details provided
Neighborhood map
What this means for you Summary
Snapshot
- This is a 2-bed/2.0-bath manufactured listed at $90k. Condition is rated good.
Deal economics
- At list price, monthly cash flow is $385 ($5k/yr) — positive.
- The deal already cash-flows at list — no discount required.
- Meets the 1% rule at list price ($1k rent vs $90k).
- Recommended offer: $89k (1.5% below list) — sets the bar for market timing.
- Cap rate 11.4% vs local median 3.8% in Harlingen — top-decile yield for the area; either an underpriced asset or a hidden risk that comps aren't pricing in. Stress-test before assuming the spread holds.
Location & tenants
- Location reads 73/100 on livability (#217 in TX) — a middle-class / working-renter tenant base. Strengths: amenities A+, cost of living A+, housing A+; Watch: crime C-, commute F, employment F.
- La Feria ISD (suburban): math 27% / reading 35% proficiency, ranked #630 of 826 in TX (top 76%) — families likely to look elsewhere, expect single-tenant / working-renter base with shorter leases.
- Zoned schools: La Feria H S (math 32% / reading 52%, grade F, #730 of 1,632 statewide, top 47%, 909 students, 85% FRL) — zoned schools average 85% FRL vs 50% district-wide (35 pts higher); higher-poverty schools than district average — tighter screening recommended.
- Market conditions: Rents soft (-1.9%/yr); 534 active listings in the ZIP; 2,326 units permitted in Cameron County in 2024 (503 in 5+ unit buildings).
Forward outlook
- Local home prices are declining (-3.0%/yr); year-one equity from $622 of loan paydown is wiped out by about $3k of value loss. Plan a longer hold.
- Cameron County population projected at +3% by 2050 — modest demand growth; plan on rents tracking national, not racing it.
- At projected returns (-3.0% appreciation + 0.0% rent growth), your $25k cash investment doubles in ~9 years — after that, you're playing with house money.
Negotiation context
- It's been on market 25 days — a 2% lower offer ($89k) is reasonable based on typical stale-listing flexibility.
Risks & watch-outs
- Climate carrying-cost: severe wind risk, 99% chance of damaging wind over 30y; moderate wildfire risk; extreme-heat days projected 6→20/yr by 2055 (HVAC capex compounding) — expect insurance premiums to compound above CPI over the hold.
Questions for the listing agent
- Is there a deadline driving the sale (1031 exchange, divorce, estate, relocation)? That informs how much negotiation room exists.
- Schools are D-rated, which usually means shorter tenancies and higher turnover. Who's the typical renter profile here, and what's been the actual vacancy rate?
- What's the average days-on-market for RENTAL listings here right now (not sales)? A rising rental-DOM trend means longer vacancies and softer asking-rent achievability than the comps imply.
- What's the recent tenant-quality profile in this submarket — average credit score on applications, eviction rate, late-payment / NSF rate, and stable-employment percentage? A property-management company in the area should have these aggregated.
- How much new for-sale + rental construction is in the pipeline within 1–3 miles? Heavy new supply typically softens prices + rents 12–24 months out; constrained supply supports both.
Investment metrics
- 1% rule
- 1.42% ✓
- Cap rate
- 11.43%
- Cash-on-cash
- 18.34%
- DSCR
- 1.82
- GRM
- 5.9
CMA / ARV
- ARV (median comp)
- $85,000
- List price
- $89,950
- Delta
- 5.82%
- Verdict
- FAIR
- Comps
- 5 within 1.0 mi
Show comp detail 2 sales within ~0.75 mi
| Address | Dist | Beds/Ba | Sqft | Sold | Price | $/sf | Match |
|---|---|---|---|---|---|---|---|
| 14611 Ash St | 0.10mi | 2/2.0 | 1,152 (+5%) | 2mo | $85,000 | $74 | 86 |
| 14610 Oak St | 0.03mi | 3/1.5 (+1) | 1,052 (-4%) | 4mo | $56,999 | $54 | 82 |
Match score weights: distance 35% · size 25% · config 20% · recency 20%. Top-matched comps best support the ARV.
Projected returns pro-forma
-3.0% appreciation · 0.0% rent growth · sell at horizon
- IRR
- 6.6%
- Equity multiple
- 1.25×
- Total profit
- $6,227
- Equity at exit
- $13,412
- IRR
- 13.1%
- Equity multiple
- 1.90×
- Total profit
- $22,640
- Equity at exit
- $7,777
Cash invested: $25,186 (down + closing). Projections, not guarantees.
Landlord ↔ Tenant lean methodology
- Overall (STATE)
- 87 Strongly Landlord-Friendly
- State Texas
- 87 Strongly Landlord-Friendly · R+5
- County
- — inherits STATE
- City
- — inherits STATE
ZIP-level market 78552
- Home prices YoY
- -13.8%
- Rents YoY
- -1.9%
- Active inventory
- 534
- Price-to-rent
- 5.9×
Monthly cashflow live
- Estimated rent
- $1,274 medium interval (Pro) →
- Mortgage (P&I)
- −$472
- Tax est. 1.5%
- −$112 /mo · $1,349/yr
- Insurance
- −$37
- HOA
- −$0
- Vacancy / Maint / Mgmt
- −$268
- Net cashflow
- $385
Break-even live
UW: 25.0% down · 7.5% · 30yr · 1.5% tax · 5.0% vac · 8.0% maint · 8.0% mgmt
Financing live
Cash to close
- Down payment
- $22,488
- Closing costs
- $2,698
- Reserves months
- —
- Total cash needed
- —
Loan-product check · same deal, 3 products live
Conventional
25% down · 7.5% · 30yr
- Down + closing
- —
- Monthly P&I
- —
- Monthly cashflow
- —
- DSCR
- —
- Eligible?
- —
Personal DTI + credit; lowest rate.
DSCR
20% down · 8.5% · 30yr
- Down + closing
- —
- Monthly P&I
- —
- Monthly cashflow
- —
- DSCR
- —
- Eligible?
- —
No personal income docs; deal must DSCR.
Hard money
10% down · 12.0% · 12mo
- Down + closing
- —
- Monthly P&I
- —
- Monthly cashflow
- —
- DSCR
- —
- Eligible?
- —
Short-term bridge; refi at stabilization.
Listing history 9 events
-
2026-06-09status $89,950 Pending 25 DOM
-
2026-06-08days on market $89,950 Active 25 DOM
-
2026-06-07days on market $89,950 Active 24 DOM
-
2026-06-03days on market $89,950 Active 20 DOM
-
2026-06-02days on market $89,950 Active 19 DOM
-
2026-06-01days on market $89,950 Active 18 DOM
-
2026-05-31days on market $89,950 Active 17 DOM
-
2026-05-30days on market $89,950 Active 16 DOM
-
2026-05-09$89,950 Active 424-char remark
ⓘ Source: listings_history table (triggers on properties + properties_extension) + one-shot
backfill from property_details.listing_events for pre-trigger history.
Climate risk First Street
- Flood 1/10 Low FEMA zone X (shaded) · 0% chance over 30 yrs
- Wildfire 5/10 Major
- Heat 9/10 Extreme 6 d/yr ≥111°F today · 20 d/yr by 30 yrs out
- Wind 8/10 Severe 99% chance of damaging wind over 30 yrs
- Air quality 1/10 Low 0 unhealthy d/yr today · 0 by 30 yrs out
Nearby sold comps map
Loading sold comps map…
Walkable amenities ~0.75 mi
Loading nearby amenities…
Taxation est. · year 1
- Rental income
- $15,290
- − Mortgage interest
- −$5,039
- − Property taxes
- −$1,349
- − Insurance
- −$450
- − Repairs & maintenance
- −$1,223
- − Management
- −$1,223
- − Depreciation
- −$2,617
- Taxable income
- $3,389
- Est. tax owed @ 24.0%
- −$813
- After-tax cash flow
- $3,806/yr
For passive investors: Depreciation is non-cash, so a rental often shows a tax loss while cash-flowing — sheltering income. Rental losses are passive: they offset passive income freely, and up to $25,000/yr can offset ordinary (W-2) income if you actively participate and your MAGI is under $100k (phasing out to $0 by $150k); unused losses carry forward. On sale, claimed depreciation is recaptured at up to 25%, and gains may owe capital-gains tax (a 1031 exchange can defer both). Figures are a year-1 estimate at your 24.0% rate — not tax advice; consult a CPA.
Condition & rehab AI · 17 photos
This well-maintained 2-bedroom, 2-bath home in a desirable 55+ community is ready for a fresh coat of paint and some minor updates to the kitchen and flooring to maximize its resale and rental value.
Value-add opportunities
- Both Paint exterior walls — Enhances curb appeal and value
- Both Replace double-pane windows with energy-efficient ones — Improves energy efficiency and comfort
- Both Replace kitchen countertops with quartz or granite — Modernizes the kitchen and adds value
- Both Replace flooring with hardwood or tile — Modernizes the home and adds value
Renovation cost estimate screening
Value-add ROI direction
- Both Paint exterior walls — Enhances curb appeal and value ↑
- Both Replace double-pane windows with energy-efficient ones — Improves energy efficiency and comfort ↑
- Both Replace kitchen countertops with quartz or granite — Modernizes the kitchen and adds value ↑
- Both Replace flooring with hardwood or tile — Modernizes the home and adds value ↑
ⓘ Cost ranges are severity-bucket heuristics (US national rule-of-thumb). Get contractor quotes + a written scope before underwriting a rehab budget.
Schools (NCES district)
- District
- La Feria ISD
- NCES district ID
- 4826040
- Math proficiency
- 27% ▼ -25.00%
- Reading proficiency
- 35% ▼ -4.00%
- Median HH income
- $33,306
- Composite
- 25.41/100
- National rank
- #7460
- State rank
- #630 of 826 in TX
Livability — Harlingen
- Score
- 73/100
- State rank
- #217
- US rank
- #5347
Category grades
Schools grade is shown separately in the Schools card above.
Census & demographics
- County
- Cameron County · 310,734 people
- City population
- 95,667
- Metro
- Brownsville-Harlingen, TX
- Population (ZIP)
- 42,332
- Household income
- $69,811
- Rent vs Own
- Severe rent burden
- 487.0
Population outlook (Cameron County) Hauer SSP2
- Today (2025)
- 441,603 people
- By 2030
- 448,113 · +1.5%
- By 2040
- 456,385 · +3.3%
- By 2050
- 456,294 · +3.3%
- By 2075
- 423,851 · -4.0%
- By 2100
- 342,787 · -22.4%
Race, ethnicity, and origin ACS 2023
- Neighborhood character
- Predominantly Hispanic (80%)
- Race & ethnicity
- Hispanic / Latino 80% Two or more races 31% White 16% Asian 2%
- Hispanic origin (detail)
- Mexican 75%
- Common ancestry
- Lithuanian 1% Romanian 1% Slovak 1%
- Foreign-born
- 15% · Canada
- Languages at home
- 49% English-only · Spanish 49% Vietnamese 1%
Political lean MEDSL · Cameron
- 2024 margin
- Lean R (+5.8) · D 46.7% · R 52.5%
- 2008→2024 swing
- -34.6pp toward R · 2008: 28.8pp · 2024: -5.8pp
- All cycles
- 2024: R+5.8 2020: D+13.2 2016: D+32.5 2012: D+32.4 2008: D+28.8
Not yet ingested
- Civics
- —
Market trends
- HPI YoY
- ▼ -31.61%
- Current HPI
- 197.1906
- Rent YoY
- ▼ -1.87%
- Metro
- Brownsville-Harlingen, TX
- State GDP YoY
- ▲ 3.95%
- F500 in state
- 110
Industry mix (Fortune 500 HQ in TX)
| Industry | F500 HQs | Revenue |
|---|---|---|
| Energy | 16 | $1,198B |
|
||
| Technology | 5 | $198B |
|
||
| Engineering / Construction | 4 | $72B |
|
||
| Energy Services | 3 | $60B |
|
||
| Utilities | 3 | $41B |
|
||
| Healthcare | 2 | $330B |
|
||
Price history
2 events — show timeline
- 2026-06-08 Pending — RGVMLS
- 2026-05-09 Listed $89,950 RGVMLS
Cash-flow waterfall
monthlySold comps — $/sqft
last 12 mo · ≤1 miLoading sold comps…