103 Catron St Unit 48-B · Santa Fe, NM
Flood risk 1/10 · Minimal
- FEMA flood zone
- X (unshaded)
- Chance of flooding over 30 yrs
- 0.0%
- Est. flood insurance / yr
- $507 – $1,088
Fire risk 5/10 · Moderate
- Est. fire insurance / yr
- $706 – $1,312
Heat risk 2/10 · Minimal
- Hot days now (above 87°F)
- 8 days/yr
- Hot days in 30 yrs
- 22 days/yr
Wind risk 1/10 · Minimal
- Chance of severe wind over 30 yrs
- —
Air-quality risk 2/10 · Minimal
- Unhealthy air days now
- 1 days/yr
- Unhealthy air days in 30 yrs
- 1 days/yr
Risk factors via First Street. Map © Google.
Why this score? — see what drove the D+ grade
The composite is a weighted blend of 9 inputs, each scored 0–100. Each bar is that input's sub-score; the figure is the points it added to the 100-point composite (weight × sub-score).
- Cash flow +15.0/30.0
- ARV discount +7.5/15.0
- 1% rule +5.0/10.0
- DSCR +5.0/10.0
- Schools +4.5/10.0
- Livability +3.7/5.0
- Rent growth +3.2/5.0
- Condition / age +2.5/5.0
- Appreciation +0.0/10.0
$48,000
🖨 Deal sheet 📄 Offer letter ✓ Due diligence
Listing remarks MLS
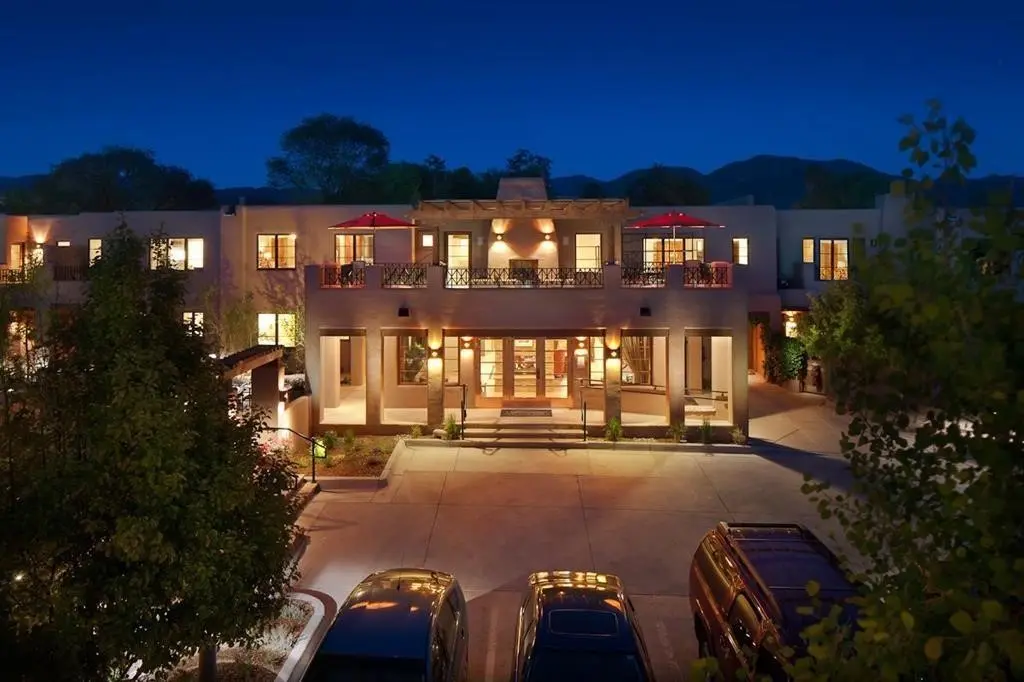
Managed by the Hyatt Vacation Club, this is a fractional (1/8 share) share condo at El Corazon de Santa Fe. It is a deeded 1/8th share in Terra floorplan #48B. There are seven Terra floorplan units, but it isn’t a given that an owner will always stay in 48-B but they will always stay in one of the Terra units. Owners get 4 weeks per year, with the possibility of more time if it's available. Two luxurious bedrooms and bathrooms, 1300 square feet in a single level. There is a main living room with fireplace, state-of-the-art kitchen with stainless steel appliances, separate dining area, main living area with fireplace, master bath with dual vanities and jetted tub, private patio or balcony, and outdoor and covered garage parking available, accessed with key code. Cleaning fee due before you leave. Owners can exchange time through the Hyatt Vacation Club and Registry Collection.
Key facts
- Garage
- Built 2007
- Listed 277 days
Tags
Neighborhood map
What this means for you Summary
Snapshot
- This is a 2-bed/2.0-bath timeshare listed at $48k.
Deal economics
- At list price, monthly cash flow is $1k ($15k/yr) — positive.
- The deal already cash-flows at list — no discount required.
- Meets the 1% rule at list price ($3k rent vs $48k).
- Recommended offer: $42k (12.0% below list) — sets the bar for market timing.
- Cap rate 37.5% vs local median 2.4% in Santa Fe — top-decile yield for the area; either an underpriced asset or a hidden risk that comps aren't pricing in. Stress-test before assuming the spread holds.
Location & tenants
- Location reads 74/100 on livability (#9 in NM, #4,641 nationally) — a middle-class / working-renter tenant base. Strengths: amenities A+, commute A+, health & safety A+; Watch: schools D-, crime F.
- Santa Fe Public Schools (urban): math 34% / reading 70% proficiency, ranked #6 of 29 in NM (top 21%) — acceptable for families but not a draw, mixed tenant base, ~2y average lease; 64% free/reduced lunch — lower-income household profile, screen leases tightly.
- Market conditions: Rents rising (+2.6%/yr); 235 active listings in the ZIP; 18 comparable units currently listed for rent nearby; rentals lingering (median 44d on market — plan ~5-8 weeks vacancy on turnover, expect pricing pressure); 67% of comp listings sitting > 30 days — soft ceiling on asking rent; solid renter incomes; 244 units permitted in Santa Fe County in 2024 (0 in 5+ unit buildings).
- At $3,005/mo this rent would consume 45% of the median local household income ($80k/yr) (locally 905% of renters already pay >50% of income on rent) — very limited rent-growth headroom before tenants either downsize or default.
Forward outlook
- Local home prices are declining (-3.0%/yr); year-one equity from $332 of loan paydown is wiped out by about $1k of value loss. Plan a longer hold.
- At projected returns (-3.0% appreciation + 2.6% rent growth), your $13k cash investment doubles in ~1 year — after that, you're playing with house money.
Negotiation context
- It's been on market 278 days — a 12% lower offer ($42k) is reasonable based on typical stale-listing flexibility.
- 2 sale attempts since 7y ago with the ask held roughly flat each time — persistent listings suggest the price (not the market) is what's stuck; bring a comps-based counter.
Risks & watch-outs
- Watch-outs: HOA is 26% of rent.
- Climate carrying-cost: moderate wildfire risk — expect insurance premiums to compound above CPI over the hold.
Questions for the listing agent
- It's been on market 278 days. Have you received any prior offers? Is the seller open to a 12% concession, seller financing, or rate buy-down credit?
- What does the HOA fee cover, when was the last increase, and are there any pending special assessments or reserve-fund shortfalls?
- Why hasn't it sold? Are there any deal-killer items the seller is aware of (foundation, flood, title, zoning, code violations)?
- Is there a deadline driving the sale (1031 exchange, divorce, estate, relocation)? That informs how much negotiation room exists.
- Schools are D-rated, which usually means shorter tenancies and higher turnover. Who's the typical renter profile here, and what's been the actual vacancy rate?
- Crime grade is F in this area — have there been break-ins, vandalism, or insurance claims at this property in the last 3 years? What carrier currently insures it and at what premium?
- The area grade is low — what's the realistic commute time and amenity access for the typical tenant pool here? Any planned neighborhood developments (good or bad) we should know about?
- What's the average days-on-market for RENTAL listings here right now (not sales)? A rising rental-DOM trend means longer vacancies and softer asking-rent achievability than the comps imply.
- What's the recent tenant-quality profile in this submarket — average credit score on applications, eviction rate, late-payment / NSF rate, and stable-employment percentage? A property-management company in the area should have these aggregated.
- How much new for-sale + rental construction is in the pipeline within 1–3 miles? Heavy new supply typically softens prices + rents 12–24 months out; constrained supply supports both.
Investment metrics
- 1% rule
- 6.26% ✓
- Cap rate
- 37.49%
- Cash-on-cash
- 111.42%
- DSCR
- 5.96
- GRM
- 1.3
CMA / ARV
No comps found within radius.
Projected returns pro-forma
-3.0% appreciation · 2.65% rent growth · sell at horizon
- IRR
- —
- Equity multiple
- 6.30×
- Total profit
- $71,182
- Equity at exit
- $7,157
- IRR
- —
- Equity multiple
- 13.07×
- Total profit
- $162,198
- Equity at exit
- $4,150
Cash invested: $13,440 (down + closing). Projections, not guarantees.
Landlord ↔ Tenant lean methodology
- Overall (STATE)
- 55 Moderately Landlord-Leaning
- State New Mexico
- 55 Moderately Landlord-Leaning · D+3
- County
- — inherits STATE
- City
- — inherits STATE
ZIP-level market 87501
- Rents YoY
- 2.6%
- Active inventory
- 235
- Price-to-rent
- 1.3×
Monthly cashflow live
- Estimated rent
- $3,005 high interval (Pro) →
- Mortgage (P&I)
- −$252
- Tax est. 1.5%
- −$60 /mo · $720/yr
- Insurance
- −$20
- HOA
- −$794
- Vacancy / Maint / Mgmt
- −$631
- Net cashflow
- $1,248
Break-even live
UW: 25.0% down · 7.5% · 30yr · 1.5% tax · 5.0% vac · 8.0% maint · 8.0% mgmt
Financing live
Cash to close
- Down payment
- $12,000
- Closing costs
- $1,440
- Reserves months
- —
- Total cash needed
- —
Loan-product check · same deal, 3 products live
Conventional
25% down · 7.5% · 30yr
- Down + closing
- —
- Monthly P&I
- —
- Monthly cashflow
- —
- DSCR
- —
- Eligible?
- —
Personal DTI + credit; lowest rate.
DSCR
20% down · 8.5% · 30yr
- Down + closing
- —
- Monthly P&I
- —
- Monthly cashflow
- —
- DSCR
- —
- Eligible?
- —
No personal income docs; deal must DSCR.
Hard money
10% down · 12.0% · 12mo
- Down + closing
- —
- Monthly P&I
- —
- Monthly cashflow
- —
- DSCR
- —
- Eligible?
- —
Short-term bridge; refi at stabilization.
Rent comps 18 comps
| Address | Beds | Baths | Sqft | Rent | $/sqft | DOM | Units | Dist |
|---|---|---|---|---|---|---|---|---|
| 326 Staab St Unit NA Santa Fe, NM | 3.0 | 2.0 | 1800 | $3,900 | $2.17 | 43d | 1 | 0.17mi |
| 326 Staab St Santa Fe, NM | 3.0 | 2.0 | 1800 | $3,900 | $2.17 | 21d | 1 | 0.17mi |
| 602 Griffin St Santa Fe, NM | 2.0 | 2.0 | 1500 | $3,500 | $2.33 | 43d | 1 | 0.29mi |
| 101 Williams St Unit A Santa Fe, NM | 2.0 | 2.0 | 1314 | $3,500 | $2.66 | 43d | 1 | 0.51mi |
| 602 Agua Fria St Santa Fe, NM | 2.0 | 1.5 | 1300 | $2,950 | $2.27 | 43d | 1 | 0.61mi |
| 231 W Manhattan Ave Unit A Santa Fe, NM | 2.0 | 2.0 | 1250 | $3,500 | $2.80 | 43d | 1 | 0.67mi |
| 125 Martinez St Santa Fe, NM | 1.0 | 1.0 | 963 | $1,795 | $1.86 | 43d | 1 | 0.70mi |
| 1433 Paseo de Peralta Santa Fe, NM | 2.0 | 1.0 | 1200 | $2,300 | $1.92 | 43d | 1 | 0.79mi |
| 216 Miramonte St Santa Fe, NM | 3.0 | 1.5 | 1300 | $2,850 | $2.19 | 43d | 1 | 0.86mi |
| 1250 Avenida Morelia #101 Santa Fe, NM | 1.0 | 1.0 | 1024 | $2,300 | $2.25 | 43d | 1 | 0.96mi |
| 825 Calle Mejia Santa Fe, NM | 2.0 | 1.0–2.0 | 947 | $2,199 | $2.32 | 21d | 5 | 0.97mi |
| 701 Camino de la Familia Santa Fe, NM | 1.0 | 2.0 | 1408 | $3,375 | $2.40 | 21d | 1 | 0.98mi |
| 945 Agua Fria St Unit B Santa Fe, NM | 1.0 | 1.0 | 1100 | $2,250 | $2.05 | 43d | 1 | 1.05mi |
| 903 Don Gaspar Ave Santa Fe, NM | 2.0 | 1.0 | 1600 | $3,500 | $2.19 | 21d | 1 | 1.10mi |
| 909 Don Gaspar Ave Santa Fe, NM | 2.0 | 1.0 | 1000 | $2,500 | $2.50 | 21d | 1 | 1.11mi |
| 537 Kathryn Ave Unit C Santa Fe, NM | 1.0 | 1.0 | 1174 | $1,805 | $1.54 | 43d | 1 | 1.17mi |
| 406 Cortez Pl Santa Fe, NM | 3.0 | 2.0 | 1450 | $2,650 | $1.83 | 43d | 1 | 1.19mi |
| 950 W Cordova Rd Santa Fe, NM | 1.0–2.0 | 1.0–2.0 | 781 | $2,562 | $3.28 | 21d | 7 | 1.46mi |
HOA detail
- Monthly dues
- $794 · $9,528/yr
Listing history 19 events
-
2026-06-19days on market $48,000 Active 278 DOM
-
2026-06-18days on market $48,000 Active 277 DOM
-
2026-06-17days on market $48,000 Active 276 DOM
-
2026-06-16days on market $48,000 Active 275 DOM
-
2026-06-15days on market $48,000 Active 274 DOM
-
2026-06-14days on market $48,000 Active 272 DOM
-
2026-06-13days on market $48,000 Active 271 DOM
-
2026-06-10days on market $48,000 Active 269 DOM
-
2026-06-09days on market $48,000 Active 268 DOM
-
2026-06-08days on market $48,000 Active 267 DOM
-
2026-06-07days on market $48,000 Active 266 DOM
-
2026-06-03days on market $48,000 Active 262 DOM
-
2026-06-02days on market $48,000 Active 261 DOM
-
2026-06-01days on market $48,000 Active 260 DOM
-
2026-05-31days on market $48,000 Active 259 DOM
-
2026-05-30days on market $48,000 Active 258 DOM
-
2025-09-14$48,000 Active 894-char remark
Show marketing remark (894 chars)
Managed by the Hyatt Vacation Club, this is a fractional (1/8 share) share condo at El Corazon de Santa Fe. It is a deeded 1/8th share in Terra floorplan #48B. There are seven Terra floorplan units, but it isn’t a given that an owner will always stay in 48-B but they will always stay in one of the Terra units. Owners get 4 weeks per year, with the possibility of more time if it's available. Two luxurious bedrooms and bathrooms, 1300 square feet in a single level. There is a main living room with fireplace, state-of-the-art kitchen with stainless steel appliances, separate dining area, main living area with fireplace, master bath with dual vanities and jetted tub, private patio or balcony, and outdoor and covered garage parking available, accessed with key code. Cleaning fee due before you leave. Owners can exchange time through the Hyatt Vacation Club and Registry Collection.
-
2020-01-02historical
-
2019-01-17$80,000 Active
ⓘ Source: listings_history table (triggers on properties + properties_extension) + one-shot
backfill from property_details.listing_events for pre-trigger history.
Climate risk First Street
- Flood 1/10 Low FEMA zone X (unshaded) · 0% chance over 30 yrs
- Wildfire 5/10 Major
- Heat 2/10 Low 8 d/yr ≥87°F today · 22 d/yr by 30 yrs out
- Wind 1/10 Low
- Air quality 2/10 Low 1 unhealthy d/yr today · 1 by 30 yrs out
Nearby sold comps map
Loading sold comps map…
Walkable amenities ~0.75 mi
Loading nearby amenities…
Taxation est. · year 1
- Rental income
- $36,055
- − Mortgage interest
- −$2,689
- − Property taxes
- −$720
- − Insurance
- −$240
- − Repairs & maintenance
- −$2,884
- − Management
- −$2,884
- − HOA
- −$9,528
- − Depreciation
- −$1,396
- Taxable income
- $15,713
- Est. tax owed @ 24.0%
- −$3,771
- After-tax cash flow
- $11,204/yr
For passive investors: Depreciation is non-cash, so a rental often shows a tax loss while cash-flowing — sheltering income. Rental losses are passive: they offset passive income freely, and up to $25,000/yr can offset ordinary (W-2) income if you actively participate and your MAGI is under $100k (phasing out to $0 by $150k); unused losses carry forward. On sale, claimed depreciation is recaptured at up to 25%, and gains may owe capital-gains tax (a 1031 exchange can defer both). Figures are a year-1 estimate at your 24.0% rate — not tax advice; consult a CPA.
Schools (NCES district)
- District
- Santa Fe Public Schools
- NCES district ID
- 3502370
- Math proficiency
- 34% ▲ 16.00%
- Reading proficiency
- 70% ▲ 40.00%
- Median HH income
- $55,031
- Composite
- 44.78/100
- National rank
- #2744
- State rank
- #6 of 29 in NM
Livability — Santa Fe
- Score
- 74/100
- State rank
- #9
- US rank
- #4641
Category grades
Schools grade is shown separately in the Schools card above.
Census & demographics
- Census place
- Santa Fe, NM
- County
- Santa Fe County · 118,003 people
- City population
- 118,003
- Metro
- Santa Fe, NM
- Population (ZIP)
- 16,007
- Household income
- $79,603
- Rent vs Own
- Severe rent burden
- 905.0
Population outlook (Santa Fe County) Hauer SSP2
- Today (2025)
- 156,674 people
- By 2030
- 159,422 · +1.8%
- By 2040
- 160,891 · +2.7%
- By 2050
- 159,966 · +2.1%
- By 2075
- 161,318 · +3.0%
- By 2100
- 157,302 · +0.4%
Race, ethnicity, and origin ACS 2023
- Neighborhood character
- Majority White (64%)
- Race & ethnicity
- White 64% Hispanic / Latino 28% Two or more races 15% Native American 1% Asian 1%
- Hispanic origin (detail)
- Mexican 12%
- Common ancestry
- Italian 4% Slovak 3% Lithuanian 3%
- Foreign-born
- 8% · Canada, Dominican Republic, China
- Languages at home
- 82% English-only · Spanish 12% German/W. Germanic 1% Other Indo-European 1%
Political lean MEDSL · Santa Fe
- 2024 margin
- Solid D (+48.9) · D 73.3% · R 24.4% · Other 2.2%
- 2008→2024 swing
- -6.1pp toward R · 2008: 55.0pp · 2024: 48.9pp
- All cycles
- 2024: D+48.9 2020: D+53.8 2016: D+51.0 2012: D+51.0 2008: D+55.0
Not yet ingested
- Civics
- —
Market trends
- HPI YoY
- ▼ -595.93%
- Current HPI
- 250.8292
- Rent YoY
- ▲ 2.65%
- Metro
- Santa Fe, NM
- State GDP YoY
- —
- F500 in state
- 0
Price history
-40.0% since first listed3 events — show timeline
- 2025-09-14 Listed $48,000 Santa Fe MLS
- 2020-01-02 Delisted — Santa Fe MLS
- 2019-01-17 Listed $80,000 Santa Fe MLS
Cash-flow waterfall
monthlySold comps — $/sqft
last 12 mo · ≤1 miLoading sold comps…