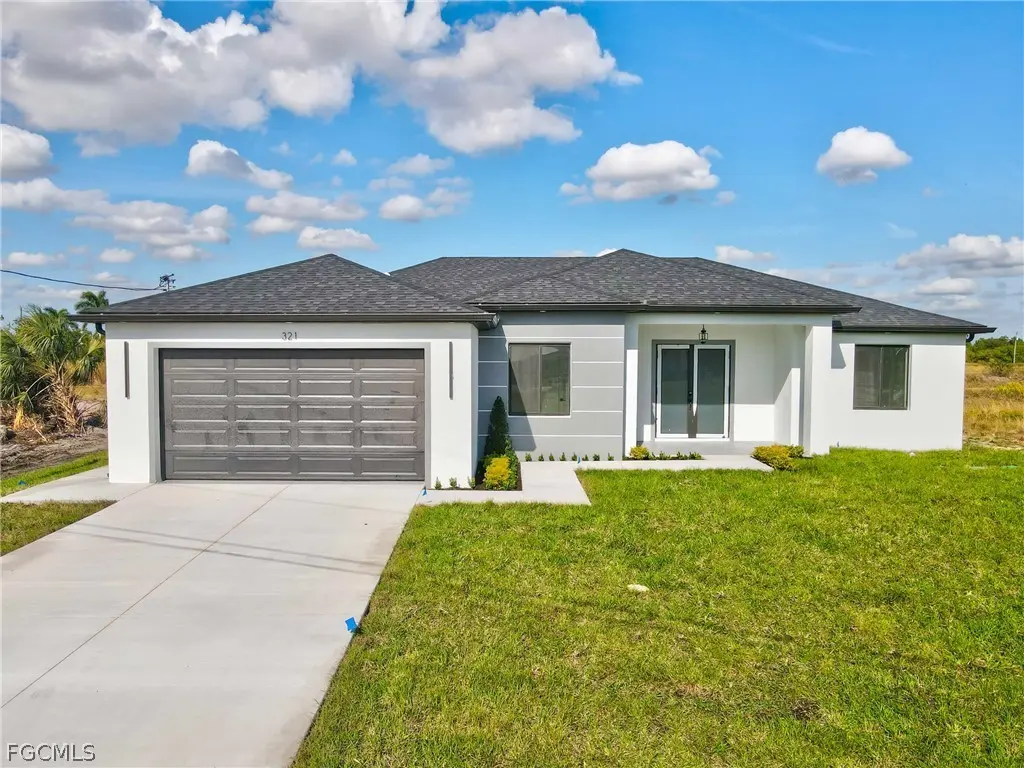
321 Peerless St · Lehigh Acres, FL
Flood risk 8/10 · Major
- FEMA flood zone
- X (unshaded)
- Chance of flooding over 30 yrs
- 0.99%
- Est. flood insurance / yr
- $507 – $1,088
Fire risk 4/10 · Minor
- Est. fire insurance / yr
- $947 – $1,759
Heat risk 10/10 · Severe
- Hot days now (above 107°F)
- 7 days/yr
- Hot days in 30 yrs
- 28 days/yr
Wind risk 10/10 · Severe
- Chance of severe wind over 30 yrs
- 99.0%
Air-quality risk 2/10 · Minimal
- Unhealthy air days now
- 1 days/yr
- Unhealthy air days in 30 yrs
- 2 days/yr
Risk factors via First Street. Map © Google.
Why this score? — see what drove the F grade
The composite is a weighted blend of 9 inputs, each scored 0–100. Each bar is that input's sub-score; the figure is the points it added to the 100-point composite (weight × sub-score).
- Appreciation +10.0/10.0
- ARV discount +7.5/15.0
- Cash flow +5.5/30.0
- Schools +4.1/10.0
- Livability +3.0/5.0
- Condition / age +2.5/5.0
- Rent growth +1.3/5.0
- 1% rule +1.0/10.0
- DSCR +0.0/10.0
$349,000
🖨 Deal sheet 📄 Offer letter ✓ Due diligence
Listing remarks MLS
Great opportunity to buy now and build later, no rear neighbor.
Key facts
- Stem wall-built home
- Outdoor kitchen
- 0.28 acre lot
Tags
Neighborhood map
What this means for you Summary
Snapshot
- This is a 3-bed/2.5-bath land listed at $349k.
Deal economics
- At list price, monthly cash flow is $-816 ($-10k/yr) — negative.
- To cash-flow at today's rent, offer at most $231k (33.8% below list).
- To meet the 1% rule (rent ≥ 1% of price), the offer needs to be $210k (39.7% below list).
- Recommended offer: $210k (39.7% below list) — sets the bar for 1% rule.
- Cap rate 3.7% vs local median 4.7% in Lehigh Acres — below-typical yield; the buyer is paying a premium for something (appreciation thesis, condition, location) that the cap rate doesn't capture.
Location & tenants
- Location reads 59/100 on livability (#826 in FL) — a working-class tenant base; expect higher turnover. Strengths: cost of living A+, housing A+; Watch: crime C-, employment D+, schools D-.
- Lee (suburban): math 47% / reading 50% proficiency, ranked #42 of 73 in FL (top 58%) — families likely to look elsewhere, expect single-tenant / working-renter base with shorter leases.
- Market conditions: Rents falling (-4.7%/yr); 2460 active listings in the ZIP; 40 comparable units currently listed for rent nearby; rentals at typical pace (median 24d on market — plan ~3-4 weeks tenant-placement turnaround); 15,411 units permitted in Lee County in 2024 (4,686 in 5+ unit buildings).
- This rent runs 35% of the median local income ($72k/yr) — at the standard rent-burdened threshold; future hikes will face affordability resistance.
Forward outlook
- In year one you build about $37k of equity ($2k loan paydown + $35k appreciation (10.0% local appreciation)).
- Lee County population projected at +44% by 2050 — long-run rental-demand tailwind backs the buy-and-hold thesis.
- By year 2, paydown + projected appreciation supports a ~$60k cash-out refi (75% LTV) — recoverable capital for the next deal without selling this one.
Negotiation context
- It's been on market 31 days — a 3% lower offer ($339k) is reasonable based on typical stale-listing flexibility.
- 3 sale attempts since 2y ago with the ask held roughly flat each time — persistent listings suggest the price (not the market) is what's stuck; bring a comps-based counter.
- Current owner paid $23k; list at $349k implies a 1417% gain — meaningful room to come down on a strong offer.
Risks & watch-outs
- Watch-outs: flood insurance adds $66/mo.
- Climate carrying-cost: severe flood risk; severe wind risk, 99% chance of damaging wind over 30y; extreme-heat days projected 7→28/yr by 2055 (HVAC capex compounding) — expect insurance premiums to compound above CPI over the hold.
Questions for the listing agent
- What do current leases actually rent for vs. the listed asking? Can we see a recent rent roll and the last 12 months of T-12 income?
- It's been on market 31 days. Have you received any prior offers? Is the seller open to a 40% concession, seller financing, or rate buy-down credit?
- What's the actual annual flood-insurance premium (NFIP or private), and is the property in a SFHA with mandatory coverage?
- Is there a deadline driving the sale (1031 exchange, divorce, estate, relocation)? That informs how much negotiation room exists.
- Schools are D-rated, which usually means shorter tenancies and higher turnover. Who's the typical renter profile here, and what's been the actual vacancy rate?
- The area grade is low — what's the realistic commute time and amenity access for the typical tenant pool here? Any planned neighborhood developments (good or bad) we should know about?
- What's the average days-on-market for RENTAL listings here right now (not sales)? A rising rental-DOM trend means longer vacancies and softer asking-rent achievability than the comps imply.
- What's the recent tenant-quality profile in this submarket — average credit score on applications, eviction rate, late-payment / NSF rate, and stable-employment percentage? A property-management company in the area should have these aggregated.
- How much new for-sale + rental construction is in the pipeline within 1–3 miles? Heavy new supply typically softens prices + rents 12–24 months out; constrained supply supports both.
Investment metrics
- 1% rule
- 0.60% ✗
- Cap rate
- 3.71%
- Cash-on-cash
- -9.21%
- DSCR
- 0.59
- GRM
- 13.8
CMA / ARV
No comps found within radius.
Projected returns pro-forma
10.0% appreciation · 0.0% rent growth · sell at horizon
- IRR
- 16.6%
- Equity multiple
- 2.35×
- Total profit
- $131,996
- Equity at exit
- $314,407
- IRR
- 15.3%
- Equity multiple
- 5.28×
- Total profit
- $418,692
- Equity at exit
- $678,030
Cash invested: $97,720 (down + closing). Projections, not guarantees.
Landlord ↔ Tenant lean methodology
- Overall (STATE)
- 87 Strongly Landlord-Friendly
- State Florida
- 87 Strongly Landlord-Friendly · R+3
- County
- — inherits STATE
- City
- — inherits STATE
ZIP-level market 33974
- Home prices YoY
- 5.8%
- Rents YoY
- -4.7%
- Active inventory
- 2460
- Price-to-rent
- 13.8×
Monthly cashflow live
- Estimated rent
- $2,104 high interval (Pro) →
- Mortgage (P&I)
- −$1,830
- Tax est. 1.5%
- −$436 /mo · $5,235/yr
- Insurance
- −$145
- Flood insurance flood zone
- −$66 /mo · $798/yr
- HOA
- −$0
- Vacancy / Maint / Mgmt
- −$442
- Net cashflow
- $-816
Break-even live
UW: 25.0% down · 7.5% · 30yr · 1.5% tax · 5.0% vac · 8.0% maint · 8.0% mgmt
Financing live
Cash to close
- Down payment
- $87,250
- Closing costs
- $10,470
- Reserves months
- —
- Total cash needed
- —
Loan-product check · same deal, 3 products live
Conventional
25% down · 7.5% · 30yr
- Down + closing
- —
- Monthly P&I
- —
- Monthly cashflow
- —
- DSCR
- —
- Eligible?
- —
Personal DTI + credit; lowest rate.
DSCR
20% down · 8.5% · 30yr
- Down + closing
- —
- Monthly P&I
- —
- Monthly cashflow
- —
- DSCR
- —
- Eligible?
- —
No personal income docs; deal must DSCR.
Hard money
10% down · 12.0% · 12mo
- Down + closing
- —
- Monthly P&I
- —
- Monthly cashflow
- —
- DSCR
- —
- Eligible?
- —
Short-term bridge; refi at stabilization.
Rent comps 40 comps
| Address | Beds | Baths | Sqft | Rent | $/sqft | DOM | Units | Dist |
|---|---|---|---|---|---|---|---|---|
| 208 Pembroke St Lehigh Acres, FL | 3.0 | 2.0 | 1545 | $2,100 | $1.36 | 23d | 1 | 0.23mi |
| 227 Pennfield St Lehigh Acres, FL | 4.0 | 2.0 | 1732 | $2,275 | $1.31 | 23d | 1 | 0.31mi |
| 418 Pickford Ave Lehigh Acres, FL | 4.0 | 2.0 | 1937 | $2,450 | $1.26 | 23d | 1 | 0.33mi |
| 633 Alabama Rd S Lehigh Acres, FL | 3.0 | 2.0 | 2422 | $1,500 | $0.62 | 23d | 1 | 0.33mi |
| 234 Pullman St Lehigh Acres, FL | 3.0 | 2.0 | 1392 | $1,800 | $1.29 | 23d | 1 | 0.37mi |
| 212 Pullman St Lehigh Acres, FL | 3.0 | 2.0 | 2396 | $1,800 | $0.75 | 23d | 1 | 0.42mi |
| 531 Alabama Rd S Lehigh Acres, FL | 2.0 | 2.0 | 2612 | $1,750 | $0.67 | 23d | 1 | 0.42mi |
| 304 Preston St Lehigh Acres, FL | 3.0 | 2.0 | 1590 | $2,150 | $1.35 | 3d | 1 | 0.44mi |
| 304 Preston St Unit 304 Lehigh Acres, FL | 3.0 | 2.0 | 1519 | $2,350 | $1.55 | 23d | 1 | 0.45mi |
| 333 Pinehurst Ave Lehigh Acres, FL | 3.0 | 2.0 | 1545 | $2,100 | $1.36 | 23d | 1 | 0.48mi |
| 448 Grant Blvd Unit 1 Lehigh Acres, FL | 2.0 | 2.0 | 1244 | $1,595 | $1.28 | 1d | 1 | 0.49mi |
| 448 Grant Blvd Unit 1 Lehigh Acres, FL | 3.0 | 2.0 | 1244 | $1,650 | $1.33 | 21d | 1 | 0.49mi |
| 448 Grant Blvd Unit 1 Lehigh Acres, FL | 2.0 | 2.0 | 1244 | $1,595 | $1.28 | 1d | 1 | 0.49mi |
| 177 Pennfield St Lehigh Acres, FL | 3.0 | 2.0 | 1250 | $1,850 | $1.48 | 23d | 1 | 0.53mi |
| 19542 Fairhill Ct Lehigh Acres, FL | 3.0 | 2.0 | 1429 | $1,700 | $1.19 | 23d | 1 | 0.54mi |
| 749 Alabama Rd S Unit 749 Lehigh Acres, FL | 3.0 | 2.0 | 1275 | $1,800 | $1.41 | 1d | 1 | 0.58mi |
| 437 Reading St Lehigh Acres, FL | 4.0 | 2.0 | 1833 | $1,795 | $0.98 | 1d | 1 | 0.60mi |
| 438 Poplar St Lehigh Acres, FL | 3.0 | 2.0 | 1640 | $2,150 | $1.31 | 3d | 1 | 0.62mi |
| 423 Canyon Dr S Lehigh Acres, FL | 3.0 | 2.0 | 1830 | $1,550 | $0.85 | 23d | 1 | 0.62mi |
| 325 Paulcrest Ave Lehigh Acres, FL | 4.0 | 2.0 | 1619 | $2,300 | $1.42 | 23d | 1 | 0.64mi |
| 10353 Canal Brook Ln Lehigh Acres, FL | 3.0 | 2.0 | 1541 | $2,049 | $1.33 | 23d | 1 | 0.71mi |
| 10329 Canal Brook Ln Lehigh Acres, FL | 4.0 | 2.5 | 2462 | $2,600 | $1.06 | 23d | 1 | 0.74mi |
| 507 Peerless Cir Lehigh Acres, FL | 3.0 | 2.0 | 1408 | $2,000 | $1.42 | 3d | 1 | 0.77mi |
| 507 Peerless Cir Lehigh Acres, FL | 3.0 | 2.0 | 1408 | $2,100 | $1.49 | 23d | 1 | 0.77mi |
| 11918 Savanna Lakes Blvd Lehigh Acres, FL | 3.0 | 2.0 | 1484 | $2,000 | $1.35 | 23d | 1 | 0.78mi |
| 334 Ranch Ave Lehigh Acres, FL | 3.0 | 2.0 | 1645 | $2,150 | $1.31 | 3d | 1 | 0.83mi |
| 10531 Canal Brook Ln Lehigh Acres, FL | 4.0 | 2.0 | 1828 | $2,300 | $1.26 | 15d | 1 | 0.84mi |
| 19480 Poppytree Ct Lehigh Acres, FL | 3.0 | 2.0 | 1334 | $1,750 | $1.31 | 23d | 1 | 0.90mi |
| 337 Rancho Ave Lehigh Acres, FL | 3.0 | 2.0 | 1723 | $2,150 | $1.25 | 23d | 1 | 0.91mi |
| 467 Raymer St Lehigh Acres, FL | 4.0 | 2.0 | 1833 | $1,850 | $1.01 | 10d | 1 | 0.92mi |
| 351 Ranchito Ave Lehigh Acres, FL | 3.0 | 2.5 | 1500 | $2,000 | $1.33 | 23d | 1 | 0.95mi |
| 19933 Lake Vista Cir Lehigh Acres, FL | 3.0 | 2.0 | 1776 | $1,750 | $0.99 | 19d | 1 | 0.96mi |
| 10507 Crossback Ln Lehigh Acres, FL | 3.0 | 2.0 | 1672 | $1,800 | $1.08 | 23d | 1 | 0.96mi |
| 19949 Lake Vista Cir N #1 Lehigh Acres, FL | 3.0 | 2.0 | 1442 | $1,800 | $1.25 | 23d | 1 | 0.96mi |
| 19949 Lake Vista Cir Unit 16C Lehigh Acres, FL | 3.0 | 2.0 | 1517 | $1,600 | $1.05 | 23d | 1 | 0.97mi |
| 397 Pennfield Ave Lehigh Acres, FL | 4.0 | 2.0 | 1780 | $2,100 | $1.18 | 23d | 1 | 0.99mi |
| 19750 Garden Ridge Ct Lehigh Acres, FL | 4.0 | 2.5 | 1400 | $2,200 | $1.57 | 23d | 1 | 0.99mi |
| 472 Rajah St Lehigh Acres, FL | 3.0 | 2.0 | 1715 | $2,200 | $1.28 | 3d | 1 | 0.99mi |
| 477 Rayford St Lehigh Acres, FL | 4.0 | 3.0 | 1715 | $2,000 | $1.17 | 23d | 1 | 1.01mi |
| 9099 Leatherwood Loop Lehigh Acres, FL | 2.0 | 2.0 | 1564 | $2,400 | $1.53 | 23d | 1 | 1.01mi |
Listing history 14 events
-
2026-04-19status Pending
-
2026-04-13price $349,000
-
2026-03-18$355,000 Active
-
2026-03-16historical
-
2026-02-20price $360,000
-
2026-02-11price $365,000
-
2026-02-02price $369,000
-
2026-01-14price $374,900
-
2025-12-19$385,000 Active
-
2024-10-08soldstatus $23,000 Closed 63-char remark
Show marketing remark (63 chars)
Great opportunity to buy now and build later, no rear neighbor.
-
2024-10-07soldstatus $23,000
-
2024-10-04status Pending 63-char remark
Show marketing remark (63 chars)
Great opportunity to buy now and build later, no rear neighbor.
-
2024-09-03price $25,000 63-char remark
Show marketing remark (63 chars)
Great opportunity to buy now and build later, no rear neighbor.
-
2024-08-28$27,000 Active 63-char remark
Show marketing remark (63 chars)
Great opportunity to buy now and build later, no rear neighbor.
ⓘ Source: listings_history table (triggers on properties + properties_extension) + one-shot
backfill from property_details.listing_events for pre-trigger history.
Climate risk First Street
- Flood 8/10 Severe FEMA zone X (unshaded) · 99% chance over 30 yrs
- Wildfire 4/10 Moderate
- Heat 10/10 Extreme 7 d/yr ≥107°F today · 28 d/yr by 30 yrs out
- Wind 10/10 Extreme 99% chance of damaging wind over 30 yrs
- Air quality 2/10 Low 1 unhealthy d/yr today · 2 by 30 yrs out
Nearby sold comps map
Loading sold comps map…
Walkable amenities ~0.75 mi
Loading nearby amenities…
Taxation est. · year 1
- Rental income
- $25,247
- − Mortgage interest
- −$19,549
- − Property taxes
- −$5,235
- − Insurance
- −$2,542
- − Repairs & maintenance
- −$2,020
- − Management
- −$2,020
- − Depreciation
- −$10,153
- Taxable loss
- −$16,272
- Est. tax savings @ 24.0%
- +$3,905
- After-tax cash flow
- $-5,889/yr
For passive investors: Depreciation is non-cash, so a rental often shows a tax loss while cash-flowing — sheltering income. Rental losses are passive: they offset passive income freely, and up to $25,000/yr can offset ordinary (W-2) income if you actively participate and your MAGI is under $100k (phasing out to $0 by $150k); unused losses carry forward. On sale, claimed depreciation is recaptured at up to 25%, and gains may owe capital-gains tax (a 1031 exchange can defer both). Figures are a year-1 estimate at your 24.0% rate — not tax advice; consult a CPA.
Schools (NCES district)
- District
- Lee
- NCES district ID
- 1201080
- Math proficiency
- 47% ▼ -11.00%
- Reading proficiency
- 50% ▼ -4.00%
- Median HH income
- $49,518
- Composite
- 41.49/100
- National rank
- #3458
- State rank
- #42 of 73 in FL
Livability — Lehigh Acres
- Score
- 59/100
- State rank
- #826
- US rank
- #20055
Category grades
Schools grade is shown separately in the Schools card above.
Census & demographics
- Census place
- Lehigh Acres, FL
- County
- Lee County · 788,662 people
- City population
- 130,638
- Metro
- Cape Coral-Fort Myers, FL
- Population (ZIP)
- 19,927
- Household income
- $72,192
- Rent vs Own
- Severe rent burden
- 434.0
Population outlook (Lee County) Hauer SSP2
- Today (2025)
- 871,946 people
- By 2030
- 955,468 · +9.6%
- By 2040
- 1,113,587 · +27.7%
- By 2050
- 1,256,891 · +44.1%
- By 2075
- 1,560,270 · +78.9%
- By 2100
- 1,726,848 · +98.0%
Race, ethnicity, and origin ACS 2023
- Neighborhood character
- Diverse neighborhood (Simpson 0.64)
- Race & ethnicity
- Hispanic / Latino 52% Two or more races 31% White 26% Black 18%
- Hispanic origin (detail)
- Mexican 12% Puerto Rican 7% Cuban 20% Dominican 4%
- Common ancestry
- Hispanic 7% Italian 1% Portuguese 1%
- Foreign-born
- 32% · Canada, Jamaica
- Languages at home
- 48% English-only · Spanish 43% French/Haitian/Cajun 7% Other Indo-European 1%
Political lean MEDSL · Lee
- 2024 margin
- Strong R (+28.4) · D 35.5% · R 63.9%
- 2008→2024 swing
- -18.0pp toward R · 2008: -10.4pp · 2024: -28.4pp
- All cycles
- 2024: R+28.4 2020: R+19.2 2016: R+20.4 2012: R+16.6 2008: R+10.4
Not yet ingested
- Civics
- —
Market trends
- HPI YoY
- ▲ 16.53%
- Current HPI
- 303.3399
- Rent YoY
- ▼ -4.68%
- Metro
- Cape Coral-Fort Myers, FL
- State GDP YoY
- ▲ 3.28%
- F500 in state
- 36
Industry mix (Fortune 500 HQ in FL)
| Industry | F500 HQs | Revenue |
|---|---|---|
| Industrial Technology | 2 | $29B |
|
||
| Insurance | 2 | $17B |
|
||
| Retail | 1 | $60B |
|
||
| Technology Distribution | 1 | $58B |
|
||
| Homebuilding | 1 | $35B |
|
||
| Technology Manufacturing | 1 | $35B |
|
||
Price history
+1192.6% since first listed14 events — show timeline
- 2026-04-19 Pending — FORTMLS
- 2026-04-13 Price Changed $349,000 FORTMLS
- 2026-03-18 Listed $355,000 FORTMLS
- 2026-03-16 Listing Removed — FORTMLS
- 2026-02-20 Price Changed $360,000 FORTMLS
- 2026-02-11 Price Changed $365,000 FORTMLS
- 2026-02-02 Price Changed $369,000 FORTMLS
- 2026-01-14 Price Changed $374,900 FORTMLS
- 2025-12-19 Listed $385,000 FORTMLS
- 2024-10-08 Sold (MLS) $23,000 Stellar MLS as Distributed by MLS Grid
- 2024-10-07 Sold (Public Records) $23,000 Public Records
- 2024-10-04 Pending — Stellar MLS as Distributed by MLS Grid
- 2024-09-03 Price Changed $25,000 Stellar MLS as Distributed by MLS Grid
- 2024-08-28 Listed $27,000 Stellar MLS as Distributed by MLS Grid
Property tax history
+19.9%/yrLatest (2025): $522 · +28.5% YoY. Source: county tax records.
Cash-flow waterfall
monthlySold comps — $/sqft
last 12 mo · ≤1 miLoading sold comps…