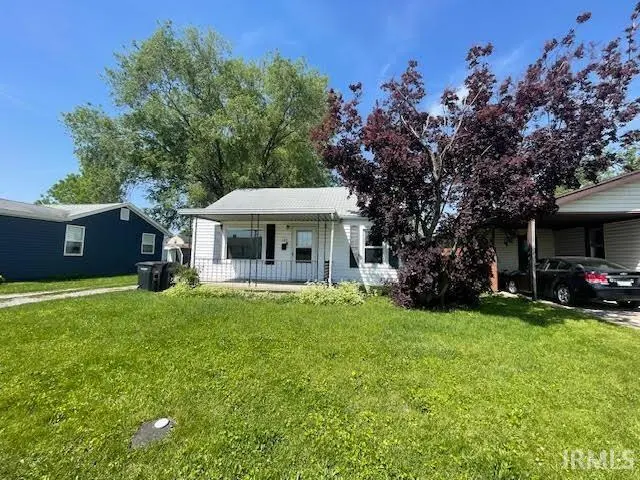
524 S 31st St · Lafayette, IN
Flood risk 1/10 · Minimal
- FEMA flood zone
- X (unshaded)
- Chance of flooding over 30 yrs
- 0.0%
- Est. flood insurance / yr
- $507 – $1,088
Fire risk 1/10 · Minimal
- Est. fire insurance / yr
- $717 – $1,331
Heat risk 3/10 · Minor
- Hot days now (above 102°F)
- 7 days/yr
- Hot days in 30 yrs
- 18 days/yr
Wind risk 2/10 · Minimal
- Chance of severe wind over 30 yrs
- —
Air-quality risk 2/10 · Minimal
- Unhealthy air days now
- 1 days/yr
- Unhealthy air days in 30 yrs
- 2 days/yr
Risk factors via First Street. Map © Google.
Why this score? — see what drove the B- grade
The composite is a weighted blend of 9 inputs, each scored 0–100. Each bar is that input's sub-score; the figure is the points it added to the 100-point composite (weight × sub-score).
- Cash flow +30.0/30.0
- 1% rule +10.0/10.0
- DSCR +10.0/10.0
- ARV discount +7.5/15.0
- Livability +3.7/5.0
- Rent growth +3.2/5.0
- Schools +2.6/10.0
- Condition / age +2.5/5.0
- Appreciation +0.0/10.0
$85,000
🖨 Deal sheet 📄 Offer letter ✓ Due diligence
Listing remarks
This charming fixer-upper offers a fantastic opportunity to for an investor or a home buyer that wants to get in at a great price and make their own renovations. The spacious front living room is a perfect gathering spot and is open to the centrally located kitchen. The back family room provides the ideal space for a playroom or office. Please note, the back two bedrooms do not have closets. Property has washer and dryer connections. Don't miss out on this well priced, potential-packed gem!
Key facts
- Back family room
- 5,968 sq ft lot
- Built 1947
Tags
Property features AI
Exterior
- Utilities: Public water; Public sewer
- Home design: Single-family residence (site-built); One story
- Construction: Vinyl siding; Asphalt shingle roof; Crawl space foundation; Built area above grade: 1,112
- Exterior features: Level lot; Lot with irregular dimensions
Interior
- Kitchen: Eat-in layout
- Bathrooms: 1 full bathroom; Main level bathroom
- Heating & cooling: Natural gas forced-air heating; No cooling
- Interior features: Eat-in kitchen; Window treatments; One fireplace (no specified features)
- Laundry & utility: Laundry on main level
Neighborhood map
What this means for you Summary
Snapshot
- This is a 3-bed/1.0-bath single-family listed at $85k.
Deal economics
- At list price, monthly cash flow is $516 ($6k/yr) — positive.
- The deal already cash-flows at list — no discount required.
- Meets the 1% rule at list price ($1k rent vs $85k).
- Cap rate 13.6% vs local median 4.2% in Lafayette — top-decile yield for the area; either an underpriced asset or a hidden risk that comps aren't pricing in. Stress-test before assuming the spread holds.
Location & tenants
- Location reads 74/100 on livability (#68 in IN, #4,374 nationally) — a middle-class / working-renter tenant base. Strengths: cost of living A+, housing A+, health & safety A+; Watch: amenities D+, employment D+, crime F.
- Lafayette School Corporation (urban): math 29% / reading 34% proficiency, ranked #235 of 301 in IN (top 78%) — families likely to look elsewhere, expect single-tenant / working-renter base with shorter leases; 63% free/reduced lunch — lower-income household profile, screen leases tightly.
- Zoned schools: Murdock Elementary School (math 42% / reading 32%, grade F, #550 of 994 statewide, top 57%, 250 students, 80% FRL); Jefferson High School (math 23% / reading 55%, grade F, #235 of 369 statewide, top 65%, 2,118 students, 69% FRL).
- Market conditions: Rents rising (+2.8%/yr); 73 active listings in the ZIP; 20 comparable units currently listed for rent nearby; rentals at typical pace (median 21d on market — plan ~3-4 weeks tenant-placement turnaround); 45% of comp listings sitting > 30 days — soft ceiling on asking rent; 1,341 units permitted in Tippecanoe County in 2024 (869 in 5+ unit buildings).
- This rent runs 31% of the median local income ($52k/yr) — at the standard rent-burdened threshold; future hikes will face affordability resistance.
Forward outlook
- Local home prices are declining (-3.0%/yr); year-one equity from $588 of loan paydown is wiped out by about $3k of value loss. Plan a longer hold.
- Tippecanoe County population projected at +41% by 2050 — long-run rental-demand tailwind backs the buy-and-hold thesis.
- At projected returns (-3.0% appreciation + 2.8% rent growth), your $24k cash investment doubles in ~5 years — after that, you're playing with house money.
Negotiation context
- Only 3 days on market — expect competitive offers; lowballing is unlikely to land.
Risks & watch-outs
- Watch-outs: built in 1947 — expect roof / HVAC / electrical / plumbing capex.
Questions for the listing agent
- Built in 1947 — when were the roof, HVAC, electrical panel, plumbing, and water heater last replaced?
- Is there a deadline driving the sale (1031 exchange, divorce, estate, relocation)? That informs how much negotiation room exists.
- Schools are D-rated, which usually means shorter tenancies and higher turnover. Who's the typical renter profile here, and what's been the actual vacancy rate?
- Crime grade is F in this area — have there been break-ins, vandalism, or insurance claims at this property in the last 3 years? What carrier currently insures it and at what premium?
- What's the average days-on-market for RENTAL listings here right now (not sales)? A rising rental-DOM trend means longer vacancies and softer asking-rent achievability than the comps imply.
- What's the recent tenant-quality profile in this submarket — average credit score on applications, eviction rate, late-payment / NSF rate, and stable-employment percentage? A property-management company in the area should have these aggregated.
- How much new for-sale + rental construction is in the pipeline within 1–3 miles? Heavy new supply typically softens prices + rents 12–24 months out; constrained supply supports both.
Investment metrics
- 1% rule
- 1.57% ✓
- Cap rate
- 13.58%
- Cash-on-cash
- 26.03%
- DSCR
- 2.16
- GRM
- 5.3
CMA / ARV
- ARV (on-the-fly)
- $189,040
- Comps found
- 12
Show comp detail 12 sales within ~0.75 mi
| Address | Dist | Beds/Ba | Sqft | Sold | Price | $/sf | Match |
|---|---|---|---|---|---|---|---|
| 524 S 31st St | 0.00mi | 3/1.0 | 1,112 (0%) | 1mo | $128,000 | $115 | 100 |
| 618 S 28th St | 0.20mi | 3/1.0 | 1,149 (+3%) | 6mo | $215,000 | $187 | 80 |
| 18 S 26th St | 0.43mi | 3/1.0 | 1,116 (+0%) | 8mo | $205,000 | $184 | 72 |
| 800 S 27th St | 0.35mi | 2/2.0 (-1) | 1,126 (+1%) | 3mo | $230,000 | $204 | 70 |
| 116 S 30th St | 0.23mi | 2/1.5 (-1) | 1,028 (-8%) | 7mo | $175,000 | $170 | 64 |
| 622 S 21st St | 0.59mi | 3/1.0 | 1,144 (+3%) | 4mo | $192,000 | $168 | 64 |
| 633 S 24th St | 0.43mi | 3/1.0 | 1,016 (-9%) | 8mo | $110,000 | $108 | 59 |
| 711 S 27th St | 0.28mi | 3/2.0 | 1,248 (+12%) | 7mo | $203,000 | $163 | 57 |
| 2412 Central St | 0.52mi | 3/1.0 | 1,008 (-9%) | 8mo | $197,000 | $195 | 54 |
| 907 S 21st St | 0.64mi | 3/1.0 | 1,178 (+6%) | 10mo | $185,000 | $157 | 52 |
| 530 N 28th St | 0.64mi | 3/1.0 | 988 (-11%) | 9mo | $205,000 | $207 | 44 |
| 1910 Perdue St | 0.66mi | 2/1.0 (-1) | 993 (-11%) | 8mo | $160,000 | $161 | 40 |
Match score weights: distance 35% · size 25% · config 20% · recency 20%. Top-matched comps best support the ARV.
Projected returns pro-forma
-3.0% appreciation · 2.8% rent growth · sell at horizon
- IRR
- 19.5%
- Equity multiple
- 1.79×
- Total profit
- $18,825
- Equity at exit
- $12,674
- IRR
- 27.7%
- Equity multiple
- 3.42×
- Total profit
- $57,593
- Equity at exit
- $7,349
Cash invested: $23,800 (down + closing). Projections, not guarantees.
Landlord ↔ Tenant lean methodology
- Overall (STATE)
- 90 Strongly Landlord-Friendly
- State Indiana
- 90 Strongly Landlord-Friendly · R+11
- County
- — inherits STATE
- City
- — inherits STATE
ZIP-level market 47904
- Rents YoY
- 2.8%
- Active inventory
- 73
- Price-to-rent
- 5.3×
Monthly cashflow live
- Estimated rent
- $1,338 high interval (Pro) →
- Mortgage (P&I)
- −$446
- Tax from tax record
- −$60 /mo · $718/yr
- Insurance
- −$35
- HOA
- −$0
- Vacancy / Maint / Mgmt
- −$281
- Net cashflow
- $516
Break-even live
UW: 25.0% down · 7.5% · 30yr · 1.5% tax · 5.0% vac · 8.0% maint · 8.0% mgmt
Financing live
Cash to close
- Down payment
- $21,250
- Closing costs
- $2,550
- Reserves months
- —
- Total cash needed
- —
Loan-product check · same deal, 3 products live
Conventional
25% down · 7.5% · 30yr
- Down + closing
- —
- Monthly P&I
- —
- Monthly cashflow
- —
- DSCR
- —
- Eligible?
- —
Personal DTI + credit; lowest rate.
DSCR
20% down · 8.5% · 30yr
- Down + closing
- —
- Monthly P&I
- —
- Monthly cashflow
- —
- DSCR
- —
- Eligible?
- —
No personal income docs; deal must DSCR.
Hard money
10% down · 12.0% · 12mo
- Down + closing
- —
- Monthly P&I
- —
- Monthly cashflow
- —
- DSCR
- —
- Eligible?
- —
Short-term bridge; refi at stabilization.
Rent comps 20 comps
| Address | Beds | Baths | Sqft | Rent | $/sqft | DOM | Units | Dist |
|---|---|---|---|---|---|---|---|---|
| 335 S 31st St Lafayette, IN | 2.0 | 1.0 | 840 | $1,250 | $1.49 | 13d | 1 | 0.09mi |
| 2026 Scott St Lafayette, IN | 2.0 | 2.0 | 1025 | $1,450 | $1.41 | 43d | 1 | 0.57mi |
| 512 Portledge Commons Dr Lafayette, IN | 1.0–2.0 | 1.0–2.0 | 978 | $1,325 | $1.35 | 43d | 1 | 0.67mi |
| 2107 Central St Lafayette, IN | 2.0 | 1.0 | 816 | $1,179 | $1.44 | 43d | 1 | 0.68mi |
| 407 N 24th St Lafayette, IN | 3.0 | 2.0 | 1388 | $2,200 | $1.59 | 43d | 1 | 0.70mi |
| 2450 S Earl Ave Lafayette, IN | 1.0–2.0 | 1.0 | 755 | $1,214 | $1.61 | 13d | 3 | 0.74mi |
| 1739 Main St Unit 7 Lafayette, IN | 3.0 | 1.0 | 750 | $1,300 | $1.73 | 13d | 1 | 0.80mi |
| 1739 Main St Unit 5 Lafayette, IN | 3.0 | 1.0 | 850 | $1,200 | $1.41 | 43d | 1 | 0.80mi |
| 1213 S 19th St Lafayette, IN | 3.0 | 2.0 | 1484 | $1,900 | $1.28 | 13d | 1 | 0.86mi |
| 1611 Grove St Lafayette, IN | 3.0 | 1.5 | 1250 | $1,195 | $0.96 | 13d | 1 | 0.87mi |
| 409 S 15th St Lafayette, IN | 2.0 | 2.0 | 864 | $1,200 | $1.39 | 43d | 1 | 0.92mi |
| 3545 McCarty Ln Lafayette, IN | 1.0–2.0 | 1.0 | 628 | $1,199 | $1.91 | 13d | 3 | 0.95mi |
| 1512 Main St Unit 1 Lafayette, IN | 2.0 | 1.5 | 1200 | $1,349 | $1.12 | 13d | 1 | 1.00mi |
| 1422 Main St Unit 05 Lafayette, IN | 2.0 | 1.0 | 780 | $875 | $1.12 | 21d | 1 | 1.07mi |
| 612 S 10th St Unit 612 Lafayette, IN | 2.0 | 1.0 | 1028 | $1,035 | $1.01 | 13d | 1 | 1.25mi |
| 1024 Main St Unit 10245 Lafayette, IN | 2.0 | 1.0 | 1200 | $1,350 | $1.12 | 21d | 1 | 1.32mi |
| 3605 Wausau Ct Lafayette, IN | 3.0 | 1.0 | 1073 | $1,500 | $1.40 | 43d | 1 | 1.37mi |
| 10 Emerald Pines Ct Unit 50-01 Lafayette, IN | 2.0 | 2.0 | 900 | $1,240 | $1.38 | 21d | 1 | 1.46mi |
| 10 Emerald Pines Ct Lafayette, IN | 1.0–2.0 | 1.0–2.5 | 742 | $1,290 | $1.74 | 43d | 7 | 1.46mi |
| 400 N 9th St Lafayette, IN | 1.0–2.0 | 1.0–2.0 | 1600 | $2,675 | $1.67 | 43d | 2 | 1.47mi |
Listing history 2 events
-
2026-05-15status Pending
-
2026-05-12$85,000 Active
ⓘ Source: listings_history table (triggers on properties + properties_extension) + one-shot
backfill from property_details.listing_events for pre-trigger history.
Tax reassessment forecast IN · Partial reset (capped growth)
- Current annual tax
- $718 · $60/mo
- Projected year-2 tax
- $720 · $60/mo
- Expected delta
- +$2/yr ($0/mo · 0.3%)
ⓘ Screening estimate from a state-policy table — verify with the county assessor before closing.
Climate risk First Street
- Flood 1/10 Low FEMA zone X (unshaded) · 0% chance over 30 yrs
- Wildfire 1/10 Low
- Heat 3/10 Moderate 7 d/yr ≥102°F today · 18 d/yr by 30 yrs out
- Wind 2/10 Low
- Air quality 2/10 Low 1 unhealthy d/yr today · 2 by 30 yrs out
Nearby sold comps map
Loading sold comps map…
Walkable amenities ~0.75 mi
Loading nearby amenities…
Taxation est. · year 1
- Rental income
- $16,058
- − Mortgage interest
- −$4,761
- − Property taxes
- −$718
- − Insurance
- −$425
- − Repairs & maintenance
- −$1,285
- − Management
- −$1,285
- − Depreciation
- −$2,473
- Taxable income
- $5,112
- Est. tax owed @ 24.0%
- −$1,227
- After-tax cash flow
- $4,967/yr
For passive investors: Depreciation is non-cash, so a rental often shows a tax loss while cash-flowing — sheltering income. Rental losses are passive: they offset passive income freely, and up to $25,000/yr can offset ordinary (W-2) income if you actively participate and your MAGI is under $100k (phasing out to $0 by $150k); unused losses carry forward. On sale, claimed depreciation is recaptured at up to 25%, and gains may owe capital-gains tax (a 1031 exchange can defer both). Figures are a year-1 estimate at your 24.0% rate — not tax advice; consult a CPA.
Schools (NCES district)
- District
- Lafayette School Corporation
- NCES district ID
- 1805400
- Math proficiency
- 29% ▼ -9.00%
- Reading proficiency
- 34% ▼ -7.00%
- Median HH income
- $39,817
- Composite
- 26.46/100
- National rank
- #7217
- State rank
- #235 of 301 in IN
Livability — Lafayette
- Score
- 74/100
- State rank
- #68
- US rank
- #4374
Category grades
Schools grade is shown separately in the Schools card above.
Census & demographics
- Census place
- Lafayette, IN
- County
- Tippecanoe County · 181,820 people
- City population
- 106,622
- Metro
- Lafayette-West Lafayette, IN
- Population (ZIP)
- 16,257
- Household income
- $51,687
- Rent vs Own
- Severe rent burden
- 563.0
Population outlook (Tippecanoe County) Hauer SSP2
- Today (2025)
- 215,327 people
- By 2030
- 232,284 · +7.9%
- By 2040
- 266,517 · +23.8%
- By 2050
- 302,826 · +40.6%
- By 2075
- 394,445 · +83.2%
- By 2100
- 463,500 · +115.3%
Race, ethnicity, and origin ACS 2023
- Neighborhood character
- Predominantly White (73%)
- Race & ethnicity
- White 73% Hispanic / Latino 16% Two or more races 11% Black 5% Asian 1%
- Hispanic origin (detail)
- Mexican 14%
- Common ancestry
- Romanian 3% Lithuanian 1% Iranian 1%
- Foreign-born
- 9% · Canada, China
- Languages at home
- 88% English-only · Spanish 10% Other Asian/Pacific 1%
Political lean MEDSL · Tippecanoe
- 2024 margin
- Toss-up / Even · D 49.0% · R 49.1% · Other 1.9%
- 2008→2024 swing
- -11.8pp toward R · 2008: 11.6pp · 2024: -0.1pp
- All cycles
- 2024: R+0.1 2020: D+0.6 2016: R+5.7 2012: R+3.6 2008: D+11.6
Not yet ingested
- Civics
- —
Market trends
- HPI YoY
- ▼ -147.53%
- Current HPI
- 227.1555
- Rent YoY
- ▲ 2.80%
- Metro
- Lafayette-West Lafayette, IN
- State GDP YoY
- ▲ 2.90%
- F500 in state
- 18
Industry mix (Fortune 500 HQ in IN)
| Industry | F500 HQs | Revenue |
|---|---|---|
| Industrial Machinery | 2 | $37B |
|
||
| Healthcare | 1 | $177B |
|
||
| Pharmaceuticals | 1 | $45B |
|
||
| Metals / Steel | 1 | $18B |
|
||
| Agriculture | 1 | $17B |
|
||
| Packaging | 1 | $12B |
|
||
Price history
2 events — show timeline
- 2026-05-15 Pending — IRMLS
- 2026-05-12 Listed $85,000 IRMLS
Property tax history
+6.6%/yrLatest (2024): $718 · +18.5% YoY. Source: county tax records.
Cash-flow waterfall
monthlySold comps — $/sqft
last 12 mo · ≤1 miLoading sold comps…