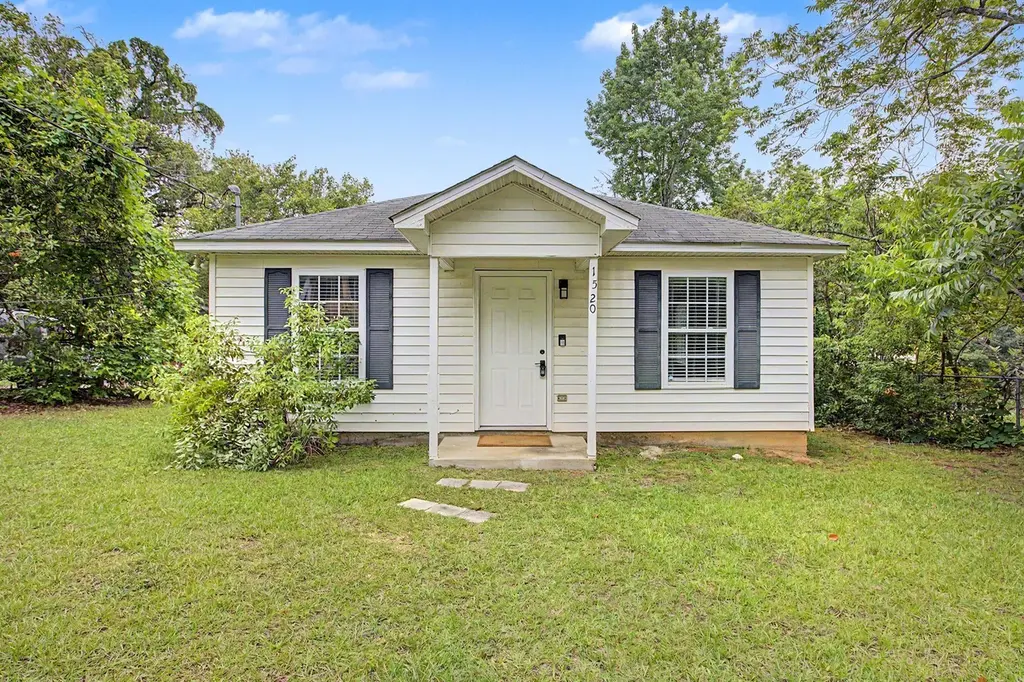
1520 Elberta Dr · Tallahassee, FL
Flood risk 1/10 · Minimal
- FEMA flood zone
- X (unshaded)
- Chance of flooding over 30 yrs
- 0.0%
- Est. flood insurance / yr
- $507 – $1,088
Fire risk 2/10 · Minimal
- Est. fire insurance / yr
- $947 – $1,759
Heat risk 8/10 · Major
- Hot days now (above 108°F)
- 7 days/yr
- Hot days in 30 yrs
- 20 days/yr
Wind risk 9/10 · Severe
- Chance of severe wind over 30 yrs
- 99.0%
Air-quality risk 4/10 · Minor
- Unhealthy air days now
- 5 days/yr
- Unhealthy air days in 30 yrs
- 6 days/yr
Risk factors via First Street. Map © Google.
Why this score? — see what drove the D- grade
The composite is a weighted blend of 9 inputs, each scored 0–100. Each bar is that input's sub-score; the figure is the points it added to the 100-point composite (weight × sub-score).
- Cash flow +11.3/30.0
- ARV discount +4.5/15.0
- Schools +4.3/10.0
- Livability +4.3/5.0
- Rent growth +3.7/5.0
- DSCR +3.3/10.0
- 1% rule +2.8/10.0
- Condition / age +2.5/5.0
- Appreciation +0.0/10.0
$195,000
🖨 Deal sheet 📄 Offer letter ✓ Due diligence
Listing remarks MLS
This property is ideal for both investment purposes and first-time home buyers. It features a split bedroom floor plan with three bedrooms and two bathrooms, providing privacy and convenience. The eat-in kitchen offers a cozy dining space, and the master suite includes a walk-in closet for added storage. Overall, it's a great opportunity for investment or as a comfortable home for first-time buyers.
Key facts
- New kitchen
- Custom tile-work
- Complete renovation
Tags
Property features AI
Finance
- Financial info: Property is listed for sale
Exterior
- Parking: Driveway
- Security: Fenced yard
- Utilities: Central electric heating and cooling; Public water/sewer (road access is public and paved)
- Home design: Single-story; Vinyl siding construction
- Construction: Vinyl siding
- Exterior features: Fully fenced; Paved public-maintained road access
Interior
- Kitchen: Oven; Range; Microwave; Refrigerator; Icemaker; Disposal
- Bedrooms: Bedroom 2: 10x10; Bedroom 3: 10x10
- Flooring: Plank; Vinyl
- Bathrooms: 2 full bathrooms
- Heating & cooling: Central heating (electric); Central air (electric)
- Interior features: Plank and vinyl flooring; Fully fenced yard (listed under exterior but relates to overall property security/privacy)
- Laundry & utility: Washer; Dryer
Neighborhood map
What this means for you Summary
Snapshot
- This is a 3-bed/2.0-bath single-family listed at $195k.
Deal economics
- At list price, monthly cash flow is $-72 ($-860/yr) — negative.
- To cash-flow at today's rent, offer at most $182k (6.5% below list).
- To meet the 1% rule (rent ≥ 1% of price), the offer needs to be $153k (21.8% below list).
- Recommended offer: $153k (21.8% below list) — sets the bar for 1% rule.
- Cap rate 5.9% vs local median 4.2% in Tallahassee — top-decile yield for the area; either an underpriced asset or a hidden risk that comps aren't pricing in. Stress-test before assuming the spread holds.
Location & tenants
- Location reads 86/100 on livability (#19 in FL, #429 nationally) — a professional / high-income tenant draw. Strengths: amenities A+, commute A+, health & safety A+; Watch: employment D.
- Leon (urban): math 48% / reading 53% proficiency, ranked #33 of 73 in FL (top 45%) — acceptable for families but not a draw, mixed tenant base, ~2y average lease.
- Market conditions: Rents rising fast (+4.7%/yr); 142 active listings in the ZIP; 32 comparable units currently listed for rent nearby; rentals at typical pace (median 21d on market — plan ~3-4 weeks tenant-placement turnaround); lower-income renter base — watch delinquency; 1,765 units permitted in Leon County in 2024 (975 in 5+ unit buildings).
- At $1,526/mo this rent would consume 57% of the median local household income ($32k/yr) (locally 6995% of renters already pay >50% of income on rent) — very limited rent-growth headroom before tenants either downsize or default.
Forward outlook
- Local home prices are declining (-3.0%/yr); year-one equity from $1k of loan paydown is wiped out by about $6k of value loss. Plan a longer hold.
- Leon County population projected at +23% by 2050 — long-run rental-demand tailwind backs the buy-and-hold thesis.
Negotiation context
- Only 14 days on market — expect competitive offers; lowballing is unlikely to land.
- 3 sale attempts since 16y ago; this cycle's ask has dropped $14k (7%) from the opening price — seller is motivated, your offer sets the floor, not the list.
- Current owner paid $160k; 22% above their basis — modest negotiation headroom, anchor on the comps not their cost.
Risks & watch-outs
- Climate carrying-cost: severe wind risk, 99% chance of damaging wind over 30y; extreme-heat days projected 7→20/yr by 2055 (HVAC capex compounding) — expect insurance premiums to compound above CPI over the hold.
Questions for the listing agent
- What do current leases actually rent for vs. the listed asking? Can we see a recent rent roll and the last 12 months of T-12 income?
- Is there a deadline driving the sale (1031 exchange, divorce, estate, relocation)? That informs how much negotiation room exists.
- Schools are B-rated — typically a magnet for longer-tenancy family renters. What's the average tenant stay here, and is there a school-zone premium baked into asking?
- The area grade is low — what's the realistic commute time and amenity access for the typical tenant pool here? Any planned neighborhood developments (good or bad) we should know about?
- What's the average days-on-market for RENTAL listings here right now (not sales)? A rising rental-DOM trend means longer vacancies and softer asking-rent achievability than the comps imply.
- What's the recent tenant-quality profile in this submarket — average credit score on applications, eviction rate, late-payment / NSF rate, and stable-employment percentage? A property-management company in the area should have these aggregated.
- How much new for-sale + rental construction is in the pipeline within 1–3 miles? Heavy new supply typically softens prices + rents 12–24 months out; constrained supply supports both.
Investment metrics
- 1% rule
- 0.78% ✗
- Cap rate
- 5.85%
- Cash-on-cash
- -1.58%
- DSCR
- 0.93
- GRM
- 10.7
CMA / ARV
- ARV (on-the-fly)
- $182,841
- Comps found
- 12
Show comp detail 12 sales within ~0.75 mi
| Address | Dist | Beds/Ba | Sqft | Sold | Price | $/sf | Match |
|---|---|---|---|---|---|---|---|
| 1737 Atkamire Dr | 0.37mi | 3/1.0 | 1,026 (-1%) | 7mo | $180,000 | $175 | 72 |
| 1811 Jackson Bluff Rd | 0.48mi | 3/1.0 | 1,042 (+1%) | 3mo | $115,000 | $110 | 70 |
| 1605 Mayhew St | 0.14mi | 3/1.0 | 912 (-12%) | 8mo | $165,000 | $181 | 63 |
| 1631 Mccaskill Ave | 0.26mi | 2/1.0 (-1) | 946 (-8%) | 5mo | $98,000 | $104 | 60 |
| 901 Brave Trl | 0.60mi | 3/2.0 | 1,092 (+6%) | 3mo | $199,900 | $183 | 60 |
| 1820 Keith St | 0.65mi | 3/1.0 | 975 (-6%) | 1mo | $140,000 | $144 | 55 |
| 1824 Tyndall Dr | 0.50mi | 3/1.0 | 934 (-10%) | 5mo | $165,000 | $177 | 53 |
| 1811 Tyndall Dr | 0.44mi | 3/1.0 | 912 (-12%) | 4mo | $169,000 | $185 | 52 |
| 1751 Pepper Dr | 0.33mi | 4/2.0 (+1) | 1,186 (+15%) | 4mo | $205,000 | $173 | 51 |
| 2034 Hillsborough St | 0.44mi | 3/1.0 | 888 (-14%) | 4mo | $140,000 | $158 | 49 |
| 1825 Tyndall Dr | 0.48mi | 3/1.0 | 912 (-12%) | 6mo | $185,000 | $203 | 48 |
| 1410 Coleman St | 0.59mi | 2/1.0 (-1) | 900 (-13%) | 2mo | $193,750 | $215 | 40 |
Match score weights: distance 35% · size 25% · config 20% · recency 20%. Top-matched comps best support the ARV.
Projected returns pro-forma
-3.0% appreciation · 4.69% rent growth · sell at horizon
- IRR
- -17.1%
- Equity multiple
- 0.39×
- Total profit
- $-33,548
- Equity at exit
- $29,075
- IRR
- -6.4%
- Equity multiple
- 0.56×
- Total profit
- $-23,971
- Equity at exit
- $16,860
Cash invested: $54,600 (down + closing). Projections, not guarantees.
Landlord ↔ Tenant lean methodology
- Overall (STATE)
- 87 Strongly Landlord-Friendly
- State Florida
- 87 Strongly Landlord-Friendly · R+3
- County
- — inherits STATE
- City
- — inherits STATE
ZIP-level market 32304
- Home prices YoY
- -21.2%
- Rents YoY
- 4.7%
- Active inventory
- 142
- Price-to-rent
- 10.7×
Monthly cashflow live
- Estimated rent
- $1,526 high interval (Pro) →
- Mortgage (P&I)
- −$1,023
- Tax from tax record
- −$173 /mo · $2,078/yr
- Insurance
- −$81
- HOA
- −$0
- Vacancy / Maint / Mgmt
- −$320
- Net cashflow
- $-72
Break-even live
UW: 25.0% down · 7.5% · 30yr · 1.5% tax · 5.0% vac · 8.0% maint · 8.0% mgmt
Financing live
Cash to close
- Down payment
- $48,750
- Closing costs
- $5,850
- Reserves months
- —
- Total cash needed
- —
Loan-product check · same deal, 3 products live
Conventional
25% down · 7.5% · 30yr
- Down + closing
- —
- Monthly P&I
- —
- Monthly cashflow
- —
- DSCR
- —
- Eligible?
- —
Personal DTI + credit; lowest rate.
DSCR
20% down · 8.5% · 30yr
- Down + closing
- —
- Monthly P&I
- —
- Monthly cashflow
- —
- DSCR
- —
- Eligible?
- —
No personal income docs; deal must DSCR.
Hard money
10% down · 12.0% · 12mo
- Down + closing
- —
- Monthly P&I
- —
- Monthly cashflow
- —
- DSCR
- —
- Eligible?
- —
Short-term bridge; refi at stabilization.
Rent comps 32 comps
| Address | Beds | Baths | Sqft | Rent | $/sqft | DOM | Units | Dist |
|---|---|---|---|---|---|---|---|---|
| 1426 Pepper Dr Tallahassee, FL | 2.0 | 1.0 | 858 | $1,250 | $1.46 | 21d | 1 | 0.15mi |
| 1616 McCaskill Ave Tallahassee, FL | 1.0–2.0 | 1.0 | 750 | $969 | $1.29 | 21d | 43 | 0.16mi |
| 1615 Sharkey St Tallahassee, FL | 4.0 | 2.0 | 1278 | $1,600 | $1.25 | 21d | 1 | 0.24mi |
| 1643 Sharkey St Tallahassee, FL | 3.0 | 1.0 | 912 | $1,350 | $1.48 | 21d | 1 | 0.24mi |
| 1606 Airport Dr Tallahassee, FL | 3.0 | 2.0 | 1008 | $1,395 | $1.38 | 21d | 1 | 0.34mi |
| 1240 Levy Ave Tallahassee, FL | 3.0 | 1.0 | 1290 | $1,350 | $1.05 | 21d | 1 | 0.37mi |
| 1303 Airport Dr Unit A08 Tallahassee, FL | 2.0 | 2.5 | 1083 | $1,475 | $1.36 | 21d | 1 | 0.38mi |
| 1327 Jackson Bluff Rd Tallahassee, FL | 2.0–4.0 | 2.0 | 1450 | $685 | $0.47 | 21d | 1 | 0.43mi |
| 1717 Airport Dr Unit 1717-2 Tallahassee, FL | 4.0 | 2.5 | 1250 | $1,900 | $1.52 | 21d | 1 | 0.43mi |
| 930 S Lipona Rd Unit D Tallahassee, FL | 2.0 | 2.0 | 896 | $1,295 | $1.45 | 21d | 1 | 0.51mi |
| 1801 Lenora Dr Tallahassee, FL | 3.0 | 1.0 | 1150 | $1,800 | $1.57 | 21d | 1 | 0.61mi |
| 1612 Overstreet St Tallahassee, FL | 3.0 | 3.0 | 1500 | $3,300 | $2.20 | 21d | 1 | 0.74mi |
| 301 S Lipona Rd #24 Tallahassee, FL | 2.0 | 1.5 | 896 | $1,350 | $1.51 | 21d | 1 | 0.76mi |
| 1854 Belle Vue Way Tallahassee, FL | 2.0–4.0 | 1.0–2.0 | 1100 | $1,768 | $1.61 | 21d | 1 | 0.77mi |
| 833 W Gaines St Tallahassee, FL | 2.0 | 2.0 | 1080 | $2,350 | $2.18 | 13d | 2 | 0.80mi |
| 220 Atkinson Dr Unit D Tallahassee, FL | 2.0 | 1.0 | 928 | $1,100 | $1.19 | 21d | 1 | 0.80mi |
| 2125 Jackson Bluff Rd Tallahassee, FL | 1.0–3.0 | 1.0–2.0 | 975 | $1,399 | $1.43 | 21d | 4 | 0.85mi |
| 1315 Pinellas St Tallahassee, FL | 3.0 | 3.0 | 1197 | $1,450 | $1.21 | 21d | 1 | 0.86mi |
| 2131 Jackson Bluff Rd Tallahassee, FL | 2.0 | 2.0 | 1043 | $1,257 | $1.21 | 13d | 3 | 0.90mi |
| 643 Kissimmee St Tallahassee, FL | 2.0 | 1.0 | 800 | $1,595 | $1.99 | 21d | 1 | 0.94mi |
| 316 Ausley Rd Tallahassee, FL | 1.0–4.0 | 1.0–2.0 | 750 | $1,197 | $1.60 | 13d | 8 | 0.95mi |
| 808 Saint Augustine St Tallahassee, FL | 2.0 | 2.5 | 1500 | $2,095 | $1.40 | 21d | 1 | 0.96mi |
| 635 Palm Beach St Apt 125 Tallahassee, FL | 2.0 | 2.0 | 900 | $900 | $1.00 | 21d | 1 | 1.03mi |
| 322 Conradi St Tallahassee, FL | 3.0 | 2.0 | 1100 | $1,950 | $1.77 | 21d | 4 | 1.21mi |
| 2202 W Pensacola St Tallahassee, FL | 1.0–3.0 | 1.0 | 950 | $1,499 | $1.58 | 21d | 3 | 1.32mi |
| 317 Mabry St Tallahassee, FL | 2.0 | 1.0 | 808 | $898 | $1.11 | 21d | 1 | 1.34mi |
| 509 Famcee Ave Tallahassee, FL | 3.0 | 2.0 | 1079 | $1,700 | $1.58 | 21d | 1 | 1.39mi |
| 1737 S M L King Jr Blvd Tallahassee, FL | 3.0 | 1.0 | 701 | $1,450 | $2.07 | 21d | 1 | 1.42mi |
| 1533 S Bronough St Tallahassee, FL | 2.0 | 1.0 | 750 | $1,150 | $1.53 | 13d | 1 | 1.42mi |
| 1525 W Tennessee St #307 Tallahassee, FL | 2.0 | 1.0 | 1200 | $1,600 | $1.33 | 21d | 1 | 1.42mi |
| 3178 N Ridge Rd Apt A Tallahassee, FL | 2.0 | 2.0 | 995 | $1,350 | $1.36 | 13d | 1 | 1.43mi |
| 847 W Georgia St Tallahassee, FL | 4.0 | 4.0 | 1500 | $1,900 | $1.27 | 13d | 1 | 1.49mi |
Listing history 25 events
-
2026-06-18days on market $195,000 Active 14 DOM
-
2026-06-17days on market $195,000 Active 13 DOM
-
2026-06-16days on market $195,000 Active 12 DOM
-
2026-06-15days on market $195,000 Active 11 DOM
-
2026-06-14days on market $195,000 Active 9 DOM
-
2026-06-10days on market $195,000 Active 6 DOM
-
2026-06-09days on market $195,000 Active 5 DOM
-
2026-06-08days on market $195,000 Active 4 DOM
-
2026-06-07days on market $195,000 Active 3 DOM
-
2026-06-05remarks 693-char remark
-
2026-06-05pricedays on market $195,000 Active 1 DOM
-
2026-06-03days on market $209,000 Active 26 DOM
-
2026-06-02days on market $209,000 Active 25 DOM
-
2026-06-01days on market $209,000 Active 24 DOM
-
2026-05-31days on market $209,000 Active 23 DOM
-
2026-05-30days on market $209,000 Active 22 DOM
-
2026-05-08$209,000 Active
-
2023-06-21soldstatus $160,000
-
2023-06-19soldstatus $160,000 Closed 402-char remark
Show marketing remark (402 chars)
This property is ideal for both investment purposes and first-time home buyers. It features a split bedroom floor plan with three bedrooms and two bathrooms, providing privacy and convenience. The eat-in kitchen offers a cozy dining space, and the master suite includes a walk-in closet for added storage. Overall, it's a great opportunity for investment or as a comfortable home for first-time buyers.
-
2023-05-21historical Active Under Contract 402-char remark
Show marketing remark (402 chars)
This property is ideal for both investment purposes and first-time home buyers. It features a split bedroom floor plan with three bedrooms and two bathrooms, providing privacy and convenience. The eat-in kitchen offers a cozy dining space, and the master suite includes a walk-in closet for added storage. Overall, it's a great opportunity for investment or as a comfortable home for first-time buyers.
-
2023-05-13$160,000 Active 402-char remark
Show marketing remark (402 chars)
This property is ideal for both investment purposes and first-time home buyers. It features a split bedroom floor plan with three bedrooms and two bathrooms, providing privacy and convenience. The eat-in kitchen offers a cozy dining space, and the master suite includes a walk-in closet for added storage. Overall, it's a great opportunity for investment or as a comfortable home for first-time buyers.
-
2010-06-02historical
-
2010-03-07$95,000
-
2003-08-14soldstatus $12,500
-
2003-04-04soldstatus $37,500
ⓘ Source: listings_history table (triggers on properties + properties_extension) + one-shot
backfill from property_details.listing_events for pre-trigger history.
Tax reassessment forecast FL · Resets to sale price
- Current annual tax
- $2,078 · $173/mo
- Projected year-2 tax
- $2,078 · $173/mo
- Expected delta
- $0/yr ($0/mo · 0.0%)
ⓘ Screening estimate from a state-policy table — verify with the county assessor before closing.
Climate risk First Street
- Flood 1/10 Low FEMA zone X (unshaded) · 0% chance over 30 yrs
- Wildfire 2/10 Low
- Heat 8/10 Severe 7 d/yr ≥108°F today · 20 d/yr by 30 yrs out
- Wind 9/10 Extreme 99% chance of damaging wind over 30 yrs
- Air quality 4/10 Moderate 5 unhealthy d/yr today · 6 by 30 yrs out
Nearby sold comps map
Loading sold comps map…
Walkable amenities ~0.75 mi
Loading nearby amenities…
Taxation est. · year 1
- Rental income
- $18,309
- − Mortgage interest
- −$10,923
- − Property taxes
- −$2,078
- − Insurance
- −$975
- − Repairs & maintenance
- −$1,465
- − Management
- −$1,465
- − Depreciation
- −$5,673
- Taxable loss
- −$4,270
- Est. tax savings @ 24.0%
- +$1,025
- After-tax cash flow
- $164/yr
For passive investors: Depreciation is non-cash, so a rental often shows a tax loss while cash-flowing — sheltering income. Rental losses are passive: they offset passive income freely, and up to $25,000/yr can offset ordinary (W-2) income if you actively participate and your MAGI is under $100k (phasing out to $0 by $150k); unused losses carry forward. On sale, claimed depreciation is recaptured at up to 25%, and gains may owe capital-gains tax (a 1031 exchange can defer both). Figures are a year-1 estimate at your 24.0% rate — not tax advice; consult a CPA.
Schools (NCES district)
- District
- Leon
- NCES district ID
- 1201110
- Math proficiency
- 48% ▼ -13.00%
- Reading proficiency
- 53% ▼ -5.00%
- Median HH income
- $46,339
- Composite
- 42.84/100
- National rank
- #3131
- State rank
- #33 of 73 in FL
Livability — Tallahassee
- Score
- 86/100
- State rank
- #19
- US rank
- #429
Category grades
Schools grade is shown separately in the Schools card above.
Census & demographics
- Census place
- Tallahassee, FL
- County
- Leon County · 294,472 people
- City population
- 294,472
- Metro
- Tallahassee, FL
- Population (ZIP)
- 51,673
- Household income
- $32,348
- Rent vs Own
- Severe rent burden
- 6995.0
Population outlook (Leon County) Hauer SSP2
- Today (2025)
- 315,507 people
- By 2030
- 330,677 · +4.8%
- By 2040
- 358,465 · +13.6%
- By 2050
- 386,804 · +22.6%
- By 2075
- 465,480 · +47.5%
- By 2100
- 519,959 · +64.8%
Race, ethnicity, and origin ACS 2023
- Neighborhood character
- Diverse neighborhood (Simpson 0.65)
- Race & ethnicity
- White 45% Black 36% Hispanic / Latino 10% Two or more races 7% Asian 4%
- Hispanic origin (detail)
- Mexican 2% Puerto Rican 2% Cuban 2%
- Common ancestry
- Romanian 2% Lithuanian 1% Italian 1%
- Foreign-born
- 8% · Canada, China
- Languages at home
- 86% English-only · Spanish 7% Other Indo-European 2% French/Haitian/Cajun 1%
Political lean MEDSL · Leon
- 2024 margin
- Strong D (+21.8) · D 60.3% · R 38.5% · Other 1.2%
- 2008→2024 swing
- -2.5pp toward R · 2008: 24.3pp · 2024: 21.8pp
- All cycles
- 2024: D+21.8 2020: D+28.3 2016: D+25.1 2012: D+23.6 2008: D+24.3
Not yet ingested
- Civics
- —
Market trends
- HPI YoY
- ▼ -72.04%
- Current HPI
- 267.8426
- Rent YoY
- ▲ 4.69%
- Metro
- Tallahassee, FL
- State GDP YoY
- ▲ 3.28%
- F500 in state
- 36
Industry mix (Fortune 500 HQ in FL)
| Industry | F500 HQs | Revenue |
|---|---|---|
| Industrial Technology | 2 | $29B |
|
||
| Insurance | 2 | $17B |
|
||
| Retail | 1 | $60B |
|
||
| Technology Distribution | 1 | $58B |
|
||
| Homebuilding | 1 | $35B |
|
||
| Technology Manufacturing | 1 | $35B |
|
||
Price history
+457.3% since first listed9 events — show timeline
- 2026-05-08 Listed $209,000 CATRS
- 2023-06-21 Sold (Public Records) $160,000 Public Records
- 2023-06-19 Sold (MLS) $160,000 CATRS
- 2023-05-21 Contingent — CATRS
- 2023-05-13 Listed $160,000 CATRS
- 2010-06-02 Listing Removed — CATRS
- 2010-03-07 Listed $95,000 CATRS
- 2003-08-14 Sold (Public Records) $12,500 Public Records
- 2003-04-04 Sold (Public Records) $37,500 Public Records
Property tax history
+6.5%/yrLatest (2025): $2,078 · +2.8% YoY. Source: county tax records.
Cash-flow waterfall
monthlySold comps — $/sqft
last 12 mo · ≤1 miLoading sold comps…