 Triplex
524 Prospect St · Torrington, CT
Flood risk 6/10 · Moderate
- FEMA flood zone
- X
- Chance of flooding over 30 yrs
- 0.56%
- Est. flood insurance / yr
- $473 – $860
Fire risk 3/10 · Minor
- Est. fire insurance / yr
- $829 – $1,539
Heat risk 4/10 · Minor
- Hot days now (above 93°F)
- 8 days/yr
- Hot days in 30 yrs
- 18 days/yr
Wind risk 5/10 · Moderate
- Chance of severe wind over 30 yrs
- 26.0%
Air-quality risk 2/10 · Minimal
- Unhealthy air days now
- 1 days/yr
- Unhealthy air days in 30 yrs
- 1 days/yr
Risk factors via First Street. Map © Google.
Why this score? — see what drove the C- grade
The composite is a weighted blend of 9 inputs, each scored 0–100. Each bar is that input's sub-score; the figure is the points it added to the 100-point composite (weight × sub-score).
- Cash flow +25.1/30.0
- DSCR +8.2/10.0
- 1% rule +6.1/10.0
- Rent growth +4.0/5.0
- Livability +3.8/5.0
- Schools +2.7/10.0
- Condition / age +2.5/5.0
- ARV discount +2.4/15.0
- Appreciation +0.0/10.0
$449,900
🖨 Deal sheet 📄 Offer letter ✓ Due diligence
Multi-family units
County records classify this as Multi-Family (2-4 Unit). Listing-text estimate: 3 units. confirmed
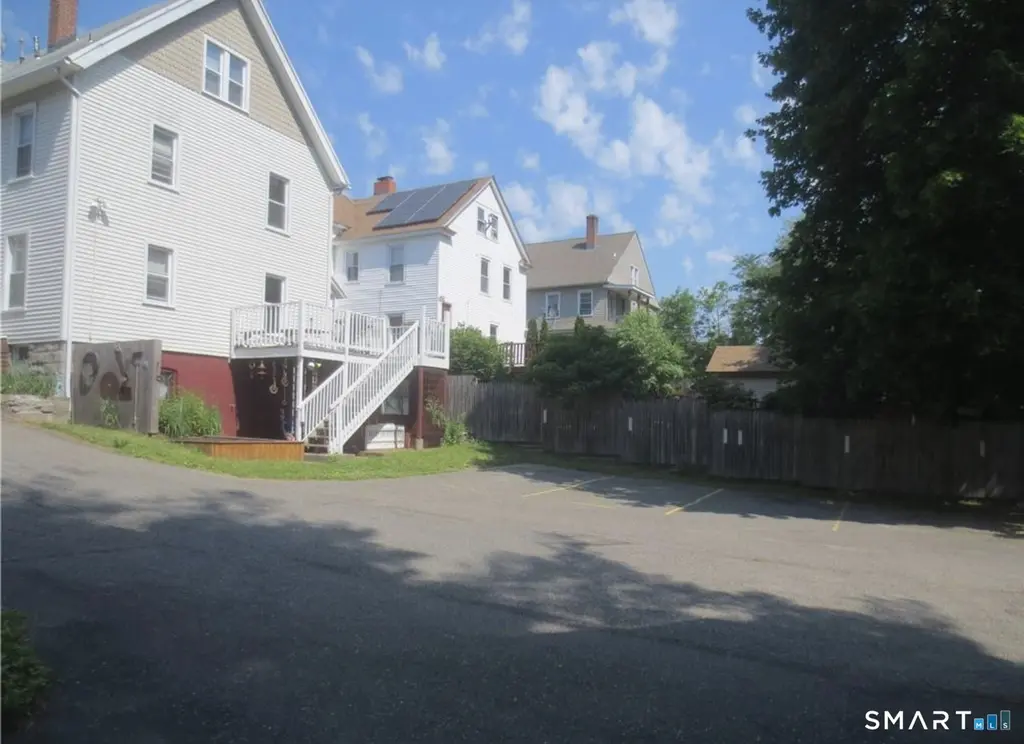
Listing remarks MLS
Investors take note! This 3 family home has been meticulously maintained by the current owners and generates income of $3350 a month. The first floor has been completely renovated in the past year. All three units are currently leased. The tenants pay all of their own utilities with the exception of cold water. This property requires very little maintenance. There is ample off street parking. The tenants would appreciate 24 hours notice for showings.
Key facts
- 6,534 sq ft lot
- 6 parking spots
- Built 1910
Property features AI
Exterior
- Parking: Off-street parking; Assigned parking; 6 total parking spaces
- Utilities: Public water connected; Public sewer connected; Fuel tank located in basement
- Home design: Multi-family property (3-family); Multi-family for sale; Frame construction
- Construction: Stone foundation
- Exterior features: Porch; Level lot; Vinyl siding; Asphalt shingle roof
Interior
- Bedrooms: 6 bedrooms
- Bathrooms: 3 full bathrooms
- Heating & cooling: Central air; Window unit(s); Hot water heating; Heat fueled by natural gas and oil; Hot water from natural gas and oil; domestic hot water
- Interior features: Common laundry area located in basement; Full basement
- Laundry & utility: Common laundry area; One unit with washer/dryer hook-up
Neighborhood map
What this means for you Summary
Snapshot
- This is a 3 × 2-bed/1.0-bath units multifamily listed at $450k.
Deal economics
- At list price, monthly cash flow is $992 ($12k/yr) — positive. Per door: $331/mo.
- The deal already cash-flows at list — no discount required.
- Meets the 1% rule at list price ($5k rent vs $450k).
- Cap rate 8.9% vs local median 3.9% in Torrington — top-decile yield for the area; either an underpriced asset or a hidden risk that comps aren't pricing in. Stress-test before assuming the spread holds.
Location & tenants
- Location reads 76/100 on livability (#53 in CT, #3,449 nationally) — a middle-class / working-renter tenant base. Strengths: crime A+, cost of living A+, housing A+; Watch: schools D, commute F.
- Torrington School District (town): math 22% / reading 39% proficiency, ranked #125 of 153 in CT (top 82%) — families likely to look elsewhere, expect single-tenant / working-renter base with shorter leases.
- Market conditions: Rents rising fast (+5.9%/yr); 188 active listings in the ZIP; 154 units permitted in Northwest Hills Planning Region in 2024 (6 in 5+ unit buildings).
- At $4,986/mo this rent would consume 84% of the median local household income ($71k/yr) (locally 1401% of renters already pay >50% of income on rent) — very limited rent-growth headroom before tenants either downsize or default.
Forward outlook
- Local home prices are declining (-3.0%/yr); year-one equity from $3k of loan paydown is wiped out by about $13k of value loss. Plan a longer hold.
- At projected returns (-3.0% appreciation + 5.9% rent growth), your $126k cash investment doubles in ~9 years — after that, you're playing with house money.
Negotiation context
- Only 6 days on market — expect competitive offers; lowballing is unlikely to land.
- 2 sale attempts since 5y ago; this cycle's ask is 50% above the opening price — seller raised mid-cycle; expect resistance to lowballs.
- Current owner paid $347k; 30% above their basis — modest negotiation headroom, anchor on the comps not their cost.
Risks & watch-outs
- Watch-outs: built in 1910 — expect roof / HVAC / electrical / plumbing capex.
- Climate carrying-cost: major flood risk; moderate wind risk, 26% chance of damaging wind over 30y — expect insurance premiums to compound above CPI over the hold.
Questions for the listing agent
- Can we see the unit-by-unit rent roll, current vacancy, and any below-market leases? What's the average tenancy length?
- What capital expenditures (roof, boiler, parking lot, exteriors) have been made in the last 5 years, and what's planned in the next 2?
- Built in 1910 — when were the roof, HVAC, electrical panel, plumbing, and water heater last replaced?
- Is there a deadline driving the sale (1031 exchange, divorce, estate, relocation)? That informs how much negotiation room exists.
- Schools are D-rated, which usually means shorter tenancies and higher turnover. Who's the typical renter profile here, and what's been the actual vacancy rate?
- What's the average days-on-market for RENTAL listings here right now (not sales)? A rising rental-DOM trend means longer vacancies and softer asking-rent achievability than the comps imply.
- What's the recent tenant-quality profile in this submarket — average credit score on applications, eviction rate, late-payment / NSF rate, and stable-employment percentage? A property-management company in the area should have these aggregated.
- How much new apartment / multifamily construction is in the pipeline within 1–3 miles? Heavy new supply (>2% of stock underway) typically softens rents 12–24 months out; light construction supports rent growth.
Investment metrics
- 1% rule
- 1.11% ✓
- Cap rate
- 8.94%
- Cash-on-cash
- 9.45%
- DSCR
- 1.42
- GRM
- 7.5
CMA / ARV
- ARV (on-the-fly)
- $404,055
- Comps found
- 12
Show comp detail 12 sales within ~0.75 mi
| Address | Dist | Beds/Ba | Sqft | Sold | Price | $/sf | Match |
|---|---|---|---|---|---|---|---|
| 91 Riverside Ave | 0.56mi | 7/3.0 | 2,936 (-2%) | 5mo | $370,000 | $126 | 66 |
| 510 Prospect St | 0.02mi | 8/2.0 (+1) | 2,741 (-8%) | 14mo | $370,000 | $135 | 65 |
| 39 Munson Ave | 0.09mi | 6/3.0 (-1) | 2,700 (-10%) | 15mo | $315,000 | $117 | 62 |
| 25 Center St | 0.51mi | 7/— | 3,011 (+1%) | 17mo | $378,000 | $126 | 61 |
| 164 Pythian Ave | 0.41mi | 6/3.0 (-1) | 3,067 (+2%) | 13mo | $385,000 | $126 | 61 |
| 116 High St | 0.59mi | 7/5.0 | 2,892 (-3%) | 3mo | $390,000 | $135 | 56 |
| 85 McGuinness St | 0.60mi | 7/3.0 | 2,843 (-5%) | 12mo | $360,000 | $127 | 54 |
| 25 Margerie St | 0.53mi | 6/5.0 (-1) | 2,917 (-2%) | 6mo | $460,000 | $158 | 54 |
| 238 E Main St | 0.44mi | 7/4.0 | 2,648 (-12%) | 10mo | $405,000 | $153 | 48 |
| 11 Elmwood Ter | 0.67mi | 6/2.0 (-1) | 2,971 (-1%) | 15mo | $275,000 | $93 | 46 |
| 20 E Center St | 0.53mi | 6/2.0 (-1) | 2,653 (-11%) | 12mo | $360,900 | $136 | 37 |
| 64 Pine St | 0.63mi | 6/2.5 (-1) | 2,621 (-12%) | 10mo | $359,500 | $137 | 35 |
Match score weights: distance 35% · size 25% · config 20% · recency 20%. Top-matched comps best support the ARV.
Projected returns pro-forma
-3.0% appreciation · 5.89% rent growth · sell at horizon
- IRR
- 1.0%
- Equity multiple
- 1.04×
- Total profit
- $5,191
- Equity at exit
- $67,082
- IRR
- 13.3%
- Equity multiple
- 2.20×
- Total profit
- $150,758
- Equity at exit
- $38,899
Cash invested: $125,972 (down + closing). Projections, not guarantees.
Landlord ↔ Tenant lean methodology
- Overall (STATE)
- 27 Tenant-Leaning
- State Connecticut
- 27 Tenant-Leaning · D+7
- County
- — inherits STATE
- City
- — inherits STATE
ZIP-level market 06790
- Rents YoY
- 5.9%
- Active inventory
- 188
- Price-to-rent
- 22.6×
Monthly cashflow live
- Estimated rent
- $4,986 high interval (Pro) →
- Mortgage (P&I)
- −$2,359
- Tax from tax record
- −$400 /mo · $4,798/yr
- Insurance
- −$187
- HOA
- −$0
- Vacancy / Maint / Mgmt
- −$1,047
- Net cashflow
- $992
Break-even live
3-unit breakdown (identical units grouped — click to expand)
| Units | Beds | Baths | Est. rent |
|---|---|---|---|
| 3× units | 2 | 1 | $4,986 |
| #1 | 2 | 1 | $1,662 |
| #2 | 2 | 1 | $1,662 |
| #3 | 2 | 1 | $1,662 |
| Total (3 units) | $4,986 | ||
UW: 25.0% down · 7.5% · 30yr · 1.5% tax · 5.0% vac · 8.0% maint · 8.0% mgmt
Financing live
Cash to close
- Down payment
- $112,475
- Closing costs
- $13,497
- Reserves months
- —
- Total cash needed
- —
Loan-product check · same deal, 3 products live
Conventional
25% down · 7.5% · 30yr
- Down + closing
- —
- Monthly P&I
- —
- Monthly cashflow
- —
- DSCR
- —
- Eligible?
- —
Personal DTI + credit; lowest rate.
DSCR
20% down · 8.5% · 30yr
- Down + closing
- —
- Monthly P&I
- —
- Monthly cashflow
- —
- DSCR
- —
- Eligible?
- —
No personal income docs; deal must DSCR.
Hard money
10% down · 12.0% · 12mo
- Down + closing
- —
- Monthly P&I
- —
- Monthly cashflow
- —
- DSCR
- —
- Eligible?
- —
Short-term bridge; refi at stabilization.
Listing history 16 events
-
2026-06-19days on market $449,900 Active 6 DOM
-
2026-06-18days on market $449,900 Active 5 DOM
-
2026-06-17days on market $449,900 Active 4 DOM
-
2026-06-16days on market $449,900 Active 3 DOM
-
2026-06-15days on market $449,900 Active 2 DOM
-
2026-06-14statusdays on market $449,900 Active 1 DOM
-
2026-06-13days on market $449,900 Coming Soon 12 DOM
-
2026-06-10days on market $449,900 Coming Soon 10 DOM
-
2026-06-09days on market $449,900 Coming Soon 9 DOM
-
2026-06-08days on market $449,900 Coming Soon 8 DOM
-
2026-06-07days on market $449,900 Coming Soon 7 DOM
-
2026-06-05days on market $449,900 Coming Soon 4 DOM
-
2026-06-03days on market $449,900 Coming Soon 3 DOM
-
2026-06-02days on market $449,900 Coming Soon 2 DOM
-
2026-05-31remarks 699-char remark
-
2026-05-31$449,900 Coming Soon 1 DOM
ⓘ Source: listings_history table (triggers on properties + properties_extension) + one-shot
backfill from property_details.listing_events for pre-trigger history.
Tax reassessment forecast CT · Partial reset (capped growth)
- Current annual tax
- $4,798 · $400/mo
- Projected year-2 tax
- $7,213 · $601/mo
- Expected delta
- +$2,415/yr (+$201/mo · 50.3%)
ⓘ Screening estimate from a state-policy table — verify with the county assessor before closing.
Climate risk First Street
- Flood 6/10 Major FEMA zone X · 56% chance over 30 yrs
- Wildfire 3/10 Moderate
- Heat 4/10 Moderate 8 d/yr ≥93°F today · 18 d/yr by 30 yrs out
- Wind 5/10 Major 26% chance of damaging wind over 30 yrs
- Air quality 2/10 Low 1 unhealthy d/yr today · 1 by 30 yrs out
Nearby sold comps map
Loading sold comps map…
Walkable amenities ~0.75 mi
Loading nearby amenities…
Taxation est. · year 1
- Rental income
- $59,832
- − Mortgage interest
- −$25,201
- − Property taxes
- −$4,798
- − Insurance
- −$2,250
- − Repairs & maintenance
- −$4,787
- − Management
- −$4,787
- − Depreciation
- −$13,088
- Taxable income
- $4,922
- Est. tax owed @ 24.0%
- −$1,181
- After-tax cash flow
- $10,727/yr
For passive investors: Depreciation is non-cash, so a rental often shows a tax loss while cash-flowing — sheltering income. Rental losses are passive: they offset passive income freely, and up to $25,000/yr can offset ordinary (W-2) income if you actively participate and your MAGI is under $100k (phasing out to $0 by $150k); unused losses carry forward. On sale, claimed depreciation is recaptured at up to 25%, and gains may owe capital-gains tax (a 1031 exchange can defer both). Figures are a year-1 estimate at your 24.0% rate — not tax advice; consult a CPA.
Schools (NCES district)
- District
- Torrington School District
- NCES district ID
- 0904590
- Math proficiency
- 22% ▼ -8.00%
- Reading proficiency
- 39% ▼ -6.00%
- Median HH income
- $53,647
- Composite
- 26.9/100
- National rank
- #7087
- State rank
- #125 of 153 in CT
Livability — Torrington
- Score
- 76/100
- State rank
- #53
- US rank
- #3449
Category grades
Schools grade is shown separately in the Schools card above.
Census & demographics
- Census place
- Torrington, CT
- County
- Litchfield County · 81,203 people
- City population
- 35,566
- Metro
- Torrington, CT
- Population (ZIP)
- 35,566
- Household income
- $70,912
- Rent vs Own
- Severe rent burden
- 1401.0
Population outlook (Northwest Hills County) Hauer SSP2
- By 2040
- 118,998
Race, ethnicity, and origin ACS 2023
- Neighborhood character
- Predominantly White (73%)
- Race & ethnicity
- White 73% Hispanic / Latino 14% Two or more races 8% Black 6% Asian 3%
- Hispanic origin (detail)
- Puerto Rican 5% Dominican 2%
- Common ancestry
- Romanian 8% Lithuanian 5% Slovak 2%
- Foreign-born
- 12% · Canada, South Korea, Jamaica
- Languages at home
- 86% English-only · Spanish 8% Other Indo-European 2% Russian/Polish/Slavic 1%
Political lean MEDSL · Northwest Hills
- 2024 margin
- Toss-up / Even · D 48.6% · R 49.9% · Other 1.6%
- All cycles
- 2024: R+1.3
Not yet ingested
- Civics
- —
Market trends
- HPI YoY
- ▼ -122.78%
- Current HPI
- 208.4818
- Rent YoY
- ▲ 5.89%
- Metro
- Torrington, CT
- State GDP YoY
- ▲ 1.06%
- F500 in state
- 38
Industry mix (Fortune 500 HQ in CT)
| Industry | F500 HQs | Revenue |
|---|---|---|
| Industrial Machinery | 4 | $38B |
|
||
| Insurance | 3 | $71B |
|
||
| Financial Services | 2 | $25B |
|
||
| Transportation / Logistics | 2 | $18B |
|
||
| Healthcare | 1 | $247B |
|
||
| Telecommunications | 1 | $55B |
|
||
Price history
+12.5% since first listed11 events — show timeline
- 2026-05-31 Coming Soon $449,900 Smart MLS
- 2023-05-15 Sold (Public Records) $347,000 Public Records
- 2023-05-11 Listing Removed — Smart MLS
- 2023-05-10 Sold (MLS) $347,000 Smart MLS
- 2023-05-02 Pending — Smart MLS
- 2023-03-27 Contingent — Smart MLS
- 2023-03-19 Listed $299,000 Smart MLS
- 2021-07-16 Sold (Public Records) $200,000 Public Records
- 2021-07-16 Sold (MLS) $200,000 Smart MLS
- 2021-06-18 Price Changed $199,950 Smart MLS
- 2021-06-07 Listed $399,900 Smart MLS
Property tax history
+2.1%/yrLatest (2023): $4,798 · +1.7% YoY. Source: county tax records.
Cash-flow waterfall
monthlySold comps — $/sqft
last 12 mo · ≤1 miLoading sold comps…