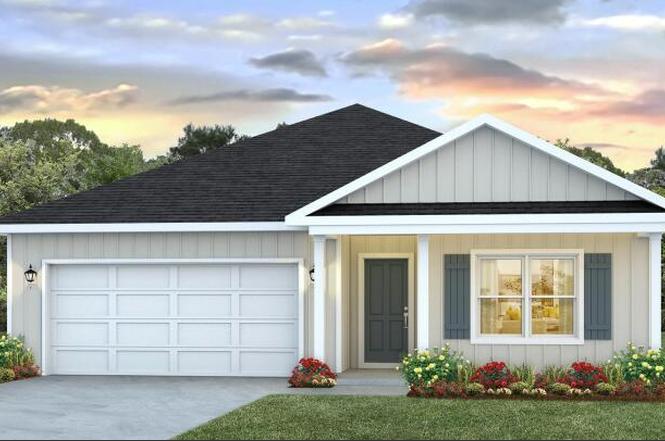
152 Dockside Rd · Freeport, FL
Flood risk 1/10 · Minimal
- FEMA flood zone
- A
- Chance of flooding over 30 yrs
- 0.0%
- Est. flood insurance / yr
- $1,009 – $1,996
Fire risk 6/10 · Moderate
- Est. fire insurance / yr
- $947 – $1,759
Heat risk 10/10 · Severe
- Hot days now (above 106°F)
- 7 days/yr
- Hot days in 30 yrs
- 21 days/yr
Wind risk 9/10 · Severe
- Chance of severe wind over 30 yrs
- 99.0%
Air-quality risk 1/10 · Minimal
- Unhealthy air days now
- 0 days/yr
- Unhealthy air days in 30 yrs
- 0 days/yr
Risk factors via First Street. Map © Google.
Why this score? — see what drove the D grade
The composite is a weighted blend of 9 inputs, each scored 0–100. Each bar is that input's sub-score; the figure is the points it added to the 100-point composite (weight × sub-score).
- Cash flow +11.9/30.0
- ARV discount +7.5/15.0
- Schools +5.2/10.0
- 1% rule +3.7/10.0
- DSCR +3.5/10.0
- Livability +3.4/5.0
- Rent growth +2.9/5.0
- Condition / age +2.5/5.0
- Appreciation +0.0/10.0
$317,183
🖨 Deal sheet 📄 Offer letter ✓ Due diligence
Listing remarks
Welcome to 152 Dockside Road, This spectacular floor plan is a 4-bedroom, 2-bathroom home with a two-car garage. The Cali floor plan features a large covered front porch with space for a sitting area. As you enter this home you will find a long hallway leading to the living area. Two bedrooms are off the entry with a full bathroom in between. Across the hall is a fourth bedroom and large laundry room. The fourth bedroom is a perfect space for a den or even a home office. Continuing down the hall, you will find yourself at an open kitchen with center island, a large dining space and comfortable living area. The primary bedroom is found at the back of the home and features a large bathroom wi
Key facts
- Large dining space
- Large laundry room
- Open kitchen
Tags
Neighborhood map
What this means for you Summary
Snapshot
- This is a 4-bed/2.0-bath land listed at $317k.
Deal economics
- At list price, monthly cash flow is $-205 ($-2k/yr) — negative.
- To cash-flow at today's rent, offer at most $288k (9.3% below list).
- To meet the 1% rule (rent ≥ 1% of price), the offer needs to be $275k (13.3% below list).
- Recommended offer: $275k (13.3% below list) — sets the bar for 1% rule.
- Cap rate 6.0% vs local median 3.0% in Freeport — top-decile yield for the area; either an underpriced asset or a hidden risk that comps aren't pricing in. Stress-test before assuming the spread holds.
Location & tenants
- Location reads 68/100 on livability (#520 in FL) — a middle-class / working-renter tenant base. Strengths: crime A+, housing A+, employment B+; Watch: health & safety C-, amenities F, commute F.
- Walton (rural): math 62% / reading 61% proficiency, ranked #10 of 73 in FL (top 14%) — acceptable for families but not a draw, mixed tenant base, ~2y average lease.
- Zoned schools: Freeport Elementary School (math 50% / reading 57%, grade C, #949 of 2,144 statewide, top 45%, 1,123 students, 55% FRL); Freeport Senior High School (math 47% / reading 62%, grade C-, #138 of 667 statewide, top 21%, 557 students, 43% FRL) — zoned schools at 49% FRL track the district average.
- Market conditions: Rents rising (+1.4%/yr); 1012 active listings in the ZIP; 7 comparable units currently listed for rent nearby; rentals at typical pace (median 21d on market — plan ~3-4 weeks tenant-placement turnaround); solid renter incomes; 2,883 units permitted in Walton County in 2024 (1,322 in 5+ unit buildings).
- This rent runs 40% of the median local income ($83k/yr) — at the standard rent-burdened threshold; future hikes will face affordability resistance.
Forward outlook
- Local home prices are declining (-3.0%/yr); year-one equity from $2k of loan paydown is wiped out by about $10k of value loss. Plan a longer hold.
- Walton County population projected at +46% by 2050 — long-run rental-demand tailwind backs the buy-and-hold thesis.
Negotiation context
- It's been on market 93 days — a 9% lower offer ($289k) is reasonable based on typical stale-listing flexibility.
Risks & watch-outs
- Watch-outs: flood insurance adds $125/mo.
- Climate carrying-cost: in FEMA flood zone A (mandatory federal flood insurance); severe wind risk, 99% chance of damaging wind over 30y; major wildfire risk; extreme-heat days projected 7→21/yr by 2055 (HVAC capex compounding) — expect insurance premiums to compound above CPI over the hold.
Questions for the listing agent
- What do current leases actually rent for vs. the listed asking? Can we see a recent rent roll and the last 12 months of T-12 income?
- It's been on market 93 days. Have you received any prior offers? Is the seller open to a 13% concession, seller financing, or rate buy-down credit?
- What's the actual annual flood-insurance premium (NFIP or private), and is the property in a SFHA with mandatory coverage?
- What does the HOA fee cover, when was the last increase, and are there any pending special assessments or reserve-fund shortfalls?
- Why hasn't it sold? Are there any deal-killer items the seller is aware of (foundation, flood, title, zoning, code violations)?
- Is there a deadline driving the sale (1031 exchange, divorce, estate, relocation)? That informs how much negotiation room exists.
- The area grade is low — what's the realistic commute time and amenity access for the typical tenant pool here? Any planned neighborhood developments (good or bad) we should know about?
- What's the average days-on-market for RENTAL listings here right now (not sales)? A rising rental-DOM trend means longer vacancies and softer asking-rent achievability than the comps imply.
- What's the recent tenant-quality profile in this submarket — average credit score on applications, eviction rate, late-payment / NSF rate, and stable-employment percentage? A property-management company in the area should have these aggregated.
- How much new for-sale + rental construction is in the pipeline within 1–3 miles? Heavy new supply typically softens prices + rents 12–24 months out; constrained supply supports both.
Investment metrics
- 1% rule
- 0.87% ✗
- Cap rate
- 5.99%
- Cash-on-cash
- -1.08%
- DSCR
- 0.95
- GRM
- 9.6
CMA / ARV
No comps found within radius.
Projected returns pro-forma
-3.0% appreciation · 1.4% rent growth · sell at horizon
- IRR
- -22.8%
- Equity multiple
- 0.23×
- Total profit
- $-68,647
- Equity at exit
- $47,293
- IRR
- -22.2%
- Equity multiple
- -0.05×
- Total profit
- $-93,258
- Equity at exit
- $27,424
Cash invested: $88,811 (down + closing). Projections, not guarantees.
Landlord ↔ Tenant lean methodology
- Overall (STATE)
- 87 Strongly Landlord-Friendly
- State Florida
- 87 Strongly Landlord-Friendly · R+3
- County
- — inherits STATE
- City
- — inherits STATE
ZIP-level market 32439
- Home prices YoY
- -4.2%
- Rents YoY
- 1.4%
- Active inventory
- 1012
- Price-to-rent
- 9.6×
Monthly cashflow live
- Estimated rent
- $2,748 high interval (Pro) →
- Mortgage (P&I)
- −$1,663
- Tax est. 1.5%
- −$396 /mo · $4,758/yr
- Insurance
- −$132
- Flood insurance flood zone
- −$125 /mo · $1,502/yr
- HOA
- −$59
- Vacancy / Maint / Mgmt
- −$577
- Net cashflow
- $-205
Break-even live
UW: 25.0% down · 7.5% · 30yr · 1.5% tax · 5.0% vac · 8.0% maint · 8.0% mgmt
Financing live
Cash to close
- Down payment
- $79,296
- Closing costs
- $9,515
- Reserves months
- —
- Total cash needed
- —
Loan-product check · same deal, 3 products live
Conventional
25% down · 7.5% · 30yr
- Down + closing
- —
- Monthly P&I
- —
- Monthly cashflow
- —
- DSCR
- —
- Eligible?
- —
Personal DTI + credit; lowest rate.
DSCR
20% down · 8.5% · 30yr
- Down + closing
- —
- Monthly P&I
- —
- Monthly cashflow
- —
- DSCR
- —
- Eligible?
- —
No personal income docs; deal must DSCR.
Hard money
10% down · 12.0% · 12mo
- Down + closing
- —
- Monthly P&I
- —
- Monthly cashflow
- —
- DSCR
- —
- Eligible?
- —
Short-term bridge; refi at stabilization.
Rent comps 7 comps
| Address | Beds | Baths | Sqft | Rent | $/sqft | DOM | Units | Dist |
|---|---|---|---|---|---|---|---|---|
| 215 Hydrangea Blvd Freeport, FL | 3.0 | 2.0 | 1854 | $2,495 | $1.35 | 21d | 1 | 0.30mi |
| 692 Alleyoak Ln Defuniak Springs, FL | 3.0 | 2.0 | 1776 | $2,500 | $1.41 | 21d | 1 | 0.59mi |
| 664 Alleyoak Ln Defuniak Springs, FL | 3.0 | 2.0 | 1634 | $2,600 | $1.59 | 21d | 1 | 0.62mi |
| 530 Alleyoak Ln Defuniak Springs, FL | 3.0 | 2.0 | 1711 | $2,500 | $1.46 | 21d | 1 | 0.69mi |
| 593 Alleyoak Ln Freeport, FL | 3.0 | 2.0 | 1634 | $2,600 | $1.59 | 21d | 1 | 0.70mi |
| 585 Claudia Cir Freeport, FL | 1.0–3.0 | 1.0–2.0 | 1082 | $2,040 | $1.89 | 21d | 47 | 0.80mi |
| 36 Gray Owl Dr E Freeport, FL | 4.0 | 2.0 | 2108 | $2,800 | $1.33 | 21d | 1 | 1.18mi |
HOA detail
- Monthly dues
- $59 · $708/yr
Listing history 6 events
-
2026-04-15status Pending
-
2026-04-15price $317,183
-
2026-04-13price $314,183
-
2026-04-03price $320,661
-
2026-03-25price $323,900
-
2026-01-12$333,900 Active
ⓘ Source: listings_history table (triggers on properties + properties_extension) + one-shot
backfill from property_details.listing_events for pre-trigger history.
Climate risk First Street
- Flood 1/10 Low FEMA zone A · 0% chance over 30 yrs
- Wildfire 6/10 Major
- Heat 10/10 Extreme 7 d/yr ≥106°F today · 21 d/yr by 30 yrs out
- Wind 9/10 Extreme 99% chance of damaging wind over 30 yrs
- Air quality 1/10 Low 0 unhealthy d/yr today · 0 by 30 yrs out
Nearby sold comps map
Loading sold comps map…
Walkable amenities ~0.75 mi
Loading nearby amenities…
Taxation est. · year 1
- Rental income
- $32,982
- − Mortgage interest
- −$17,767
- − Property taxes
- −$4,758
- − Insurance
- −$3,088
- − Repairs & maintenance
- −$2,639
- − Management
- −$2,639
- − HOA
- −$708
- − Depreciation
- −$9,227
- Taxable loss
- −$7,844
- Est. tax savings @ 24.0%
- +$1,882
- After-tax cash flow
- $-576/yr
For passive investors: Depreciation is non-cash, so a rental often shows a tax loss while cash-flowing — sheltering income. Rental losses are passive: they offset passive income freely, and up to $25,000/yr can offset ordinary (W-2) income if you actively participate and your MAGI is under $100k (phasing out to $0 by $150k); unused losses carry forward. On sale, claimed depreciation is recaptured at up to 25%, and gains may owe capital-gains tax (a 1031 exchange can defer both). Figures are a year-1 estimate at your 24.0% rate — not tax advice; consult a CPA.
Schools (NCES district)
- District
- Walton
- NCES district ID
- 1201980
- Math proficiency
- 62% ▼ -4.00%
- Reading proficiency
- 61% ▼ -2.00%
- Median HH income
- $46,794
- Composite
- 52.03/100
- National rank
- #1634
- State rank
- #10 of 73 in FL
Livability — Freeport
- Score
- 68/100
- State rank
- #520
- US rank
- #9579
Category grades
Schools grade is shown separately in the Schools card above.
Census & demographics
- County
- Walton County · 70,839 people
- City population
- 15,328
- Metro
- Crestview-Fort Walton Beach-Destin, FL
- Population (ZIP)
- 15,328
- Household income
- $83,227
- Rent vs Own
- Severe rent burden
- 172.0
Population outlook (Walton County) Hauer SSP2
- Today (2025)
- 80,014 people
- By 2030
- 88,120 · +10.1%
- By 2040
- 103,537 · +29.4%
- By 2050
- 117,034 · +46.3%
- By 2075
- 143,901 · +79.8%
- By 2100
- 155,138 · +93.9%
Race, ethnicity, and origin ACS 2023
- Neighborhood character
- Predominantly White (76%)
- Race & ethnicity
- White 76% Hispanic / Latino 16% Two or more races 8% Native American 5% Black 1%
- Hispanic origin (detail)
- Mexican 8% Puerto Rican 2% Cuban 1%
- Common ancestry
- Slovak 3% Italian 3% Serbian 2%
- Foreign-born
- 8% · Canada, Jamaica
- Languages at home
- 86% English-only · Spanish 13% Other Indo-European 1%
Political lean MEDSL · Walton
- 2024 margin
- Solid R (+57.8) · D 20.7% · R 78.6%
- 2008→2024 swing
- -12.0pp toward R · 2008: -45.8pp · 2024: -57.8pp
- All cycles
- 2024: R+57.8 2020: R+51.7 2016: R+56.1 2012: R+52.0 2008: R+45.8
Not yet ingested
- Civics
- —
Market trends
- HPI YoY
- ▼ -15.18%
- Current HPI
- 350.4692
- Rent YoY
- ▲ 1.40%
- Metro
- Crestview-Fort Walton Beach-Destin, FL
- State GDP YoY
- ▲ 3.28%
- F500 in state
- 36
Industry mix (Fortune 500 HQ in FL)
| Industry | F500 HQs | Revenue |
|---|---|---|
| Industrial Technology | 2 | $29B |
|
||
| Insurance | 2 | $17B |
|
||
| Retail | 1 | $60B |
|
||
| Technology Distribution | 1 | $58B |
|
||
| Homebuilding | 1 | $35B |
|
||
| Technology Manufacturing | 1 | $35B |
|
||
Price history
-5.0% since first listed6 events — show timeline
- 2026-04-15 Pending — ECAR
- 2026-04-15 Price Changed $317,183 ECAR
- 2026-04-13 Price Changed $314,183 ECAR
- 2026-04-03 Price Changed $320,661 ECAR
- 2026-03-25 Price Changed $323,900 ECAR
- 2026-01-12 Listed $333,900 ECAR
Cash-flow waterfall
monthlySold comps — $/sqft
last 12 mo · ≤1 miLoading sold comps…