 🏷️ Likely Rental
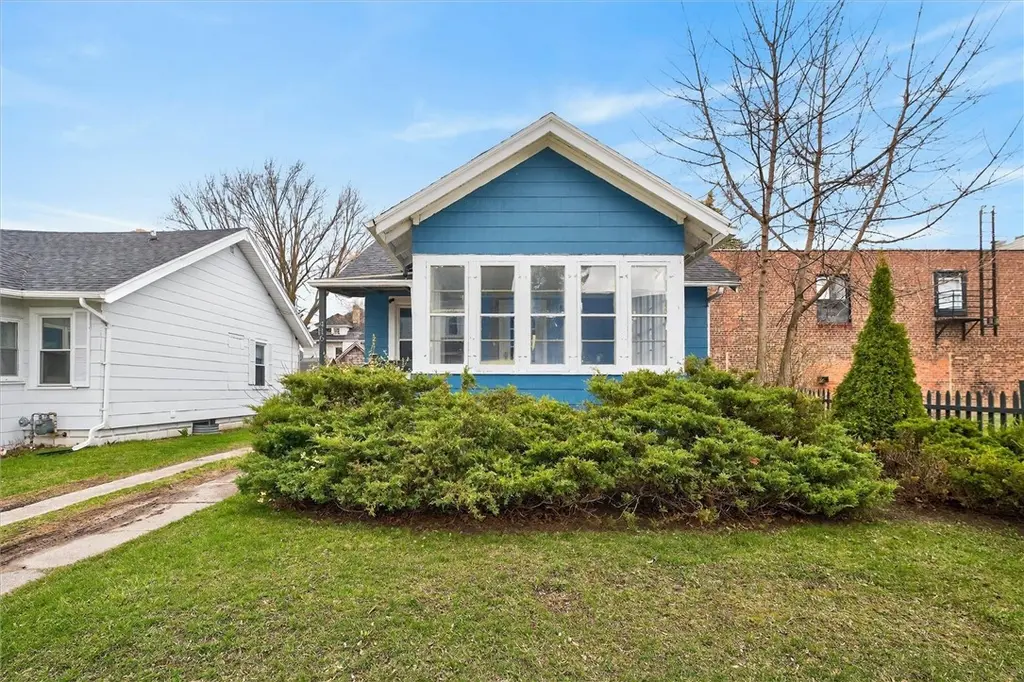
416 Roycroft Dr · Rochester, NY
Flood risk 1/10 · Minimal
- FEMA flood zone
- X (unshaded)
- Chance of flooding over 30 yrs
- 0.0%
- Est. flood insurance / yr
- $473 – $860
Fire risk 1/10 · Minimal
- Est. fire insurance / yr
- $691 – $1,283
Heat risk 2/10 · Minimal
- Hot days now (above 95°F)
- 7 days/yr
- Hot days in 30 yrs
- 15 days/yr
Wind risk 1/10 · Minimal
- Chance of severe wind over 30 yrs
- —
Air-quality risk 2/10 · Minimal
- Unhealthy air days now
- 1 days/yr
- Unhealthy air days in 30 yrs
- 2 days/yr
Risk factors via First Street. Map © Google.
Why this score? — see what drove the B+ grade
The composite is a weighted blend of 9 inputs, each scored 0–100. Each bar is that input's sub-score; the figure is the points it added to the 100-point composite (weight × sub-score).
- Cash flow +30.0/30.0
- ARV discount +15.0/15.0
- DSCR +10.0/10.0
- 1% rule +8.7/10.0
- Rent growth +4.7/5.0
- Livability +3.8/5.0
- Condition / age +2.5/5.0
- Schools +1.9/10.0
- Appreciation +0.0/10.0
$99,900
🖨 Deal sheet 📄 Offer letter ✓ Due diligence
Listing remarks MLS
This is a single family home that was rented for $1200 per month prior to a fire in part of the second floor in April 2023. An album of 360 degree photos is available at 360.rocmls.com (copy and paste the link) so you can take a good look before asking your agent for a showing. Nice detached garage. Fenced back yard. Glassblock windows. Low maintenance siding. Strictly as-is. Cash offers only.
Key facts
- New vinyl windows
- Open floor concept
- First floor living
Tags
Property features AI
Exterior
- Parking: Detached garage (1 car)
- Utilities: Electricity connected; Public water connected; Sewer connected
- Home design: Single-story home; Resale property
- Construction: Vinyl siding; Asphalt shingle roof; Block foundation; Built (existing)
- Exterior features: Enclosed porch; Covered porch; Porch; Fence (partial); Dirt driveway; Gravel driveway; Near public transit; Rectangular residential lot; City street frontage
Interior
- Kitchen: Electric cooktop; Microwave; Refrigerator
- Bedrooms: 2 main-level bedrooms
- Flooring: Hardwood; Tile; Varies
- Bathrooms: 1 full bathroom (main level)
- Heating & cooling: Forced-air gas heating
- Interior features: Attic; Breakfast bar; Separate/formal living room; Main level primary
- Laundry & utility: Gas water heater
Neighborhood map
What this means for you Summary
Snapshot
- This is a 2-bed/1.0-bath single-family listed at $100k.
Deal economics
- At list price, monthly cash flow is $465 ($6k/yr) — positive.
- The deal already cash-flows at list — no discount required.
- Meets the 1% rule at list price ($1k rent vs $100k).
- Recommended offer: $98k (1.5% below list) — sets the bar for market timing.
- Cap rate 11.9% vs local median 9.3% in Rochester — meaningfully above typical; check what's discounted (condition, days-on-market, listing class) to confirm the premium yield is real.
Location & tenants
- Location reads 76/100 on livability (#222 in NY, #3,482 nationally) — a middle-class / working-renter tenant base. Strengths: commute A+, cost of living A+, housing A+; Watch: schools D+, crime F, employment F.
- Rochester City School District (urban): math 21% / reading 26% proficiency, ranked #589 of 590 in NY (top 100%) — low school quality limits family demand, transient renter base, plan for 1-2y turnover; 82% free/reduced lunch — lower-income household profile, screen leases tightly.
- Market conditions: Rents rising fast (+8.9%/yr); 114 active listings in the ZIP; 27 comparable units currently listed for rent nearby; rentals at typical pace (median 19d on market — plan ~3-4 weeks tenant-placement turnaround); lower-income renter base — watch delinquency; 1,169 units permitted in Monroe County in 2024 (591 in 5+ unit buildings).
- At $1,366/mo this rent would consume 46% of the median local household income ($35k/yr) (locally 2756% of renters already pay >50% of income on rent) — very limited rent-growth headroom before tenants either downsize or default.
Forward outlook
- Local home prices are declining (-3.0%/yr); year-one equity from $691 of loan paydown is wiped out by about $3k of value loss. Plan a longer hold.
- Monroe County population projected to shrink 6% by 2050 — rents likely to lag national; underwrite the cash flow, not the appreciation.
- At projected returns (-3.0% appreciation + 8.0% rent growth), your $28k cash investment doubles in ~5 years — after that, you're playing with house money.
Negotiation context
- It's been on market 15 days — a 2% lower offer ($98k) is reasonable based on typical stale-listing flexibility.
- 2 sale attempts since 2y ago with the ask held roughly flat each time — persistent listings suggest the price (not the market) is what's stuck; bring a comps-based counter.
- Current owner paid $30k; list at $100k implies a 228% gain — meaningful room to come down on a strong offer.
Risks & watch-outs
- Watch-outs: built in 1920 — expect roof / HVAC / electrical / plumbing capex.
Questions for the listing agent
- Built in 1920 — when were the roof, HVAC, electrical panel, plumbing, and water heater last replaced?
- Is there a deadline driving the sale (1031 exchange, divorce, estate, relocation)? That informs how much negotiation room exists.
- Schools are D-rated, which usually means shorter tenancies and higher turnover. Who's the typical renter profile here, and what's been the actual vacancy rate?
- Crime grade is F in this area — have there been break-ins, vandalism, or insurance claims at this property in the last 3 years? What carrier currently insures it and at what premium?
- What's the average days-on-market for RENTAL listings here right now (not sales)? A rising rental-DOM trend means longer vacancies and softer asking-rent achievability than the comps imply.
- What's the recent tenant-quality profile in this submarket — average credit score on applications, eviction rate, late-payment / NSF rate, and stable-employment percentage? A property-management company in the area should have these aggregated.
- How much new for-sale + rental construction is in the pipeline within 1–3 miles? Heavy new supply typically softens prices + rents 12–24 months out; constrained supply supports both.
Investment metrics
- 1% rule
- 1.37% ✓
- Cap rate
- 11.88%
- Cash-on-cash
- 19.96%
- DSCR
- 1.89
- GRM
- 6.1
CMA / ARV
- ARV (on-the-fly)
- $127,872
- Comps found
- 12
Show comp detail 12 sales within ~0.75 mi
| Address | Dist | Beds/Ba | Sqft | Sold | Price | $/sf | Match |
|---|---|---|---|---|---|---|---|
| 58 Ferncliffe Dr | 0.44mi | 2/1.0 | 889 (+0%) | 12mo | $98,500 | $111 | 70 |
| 135 Jerold St | 0.42mi | 3/1.0 (+1) | 910 (+2%) | 5mo | $125,000 | $137 | 67 |
| 81 Cynthia Ln | 0.55mi | 2/1.0 | 900 (+1%) | 8mo | $160,000 | $178 | 66 |
| 206 Lincoln St | 0.56mi | 3/1.0 (+1) | 888 (0%) | 10mo | $51,900 | $58 | 61 |
| 859 North St | 0.70mi | 2/1.0 | 879 (-1%) | 8mo | $69,000 | $78 | 59 |
| 124 Aurora St | 0.17mi | 3/1.0 (+1) | 1,005 (+13%) | 11mo | $160,000 | $159 | 56 |
| 46 Irondequoit St | 0.72mi | 2/1.0 | 840 (-5%) | 5mo | $69,900 | $83 | 53 |
| 42 Valois St | 0.65mi | 3/1.0 (+1) | 864 (-3%) | 11mo | $145,000 | $168 | 51 |
| 21 Blakeslee St | 0.69mi | 3/1.0 (+1) | 864 (-3%) | 10mo | $75,500 | $87 | 50 |
| 212 Saint Stanislaus St | 0.44mi | 3/1.5 (+1) | 1,006 (+13%) | 8mo | $145,000 | $144 | 44 |
| 201 Ernst St | 0.31mi | 3/2.0 (+1) | 1,008 (+14%) | 15mo | $175,000 | $174 | 42 |
| 129 Northlane Dr | 0.69mi | 2/1.0 | 768 (-14%) | 13mo | $172,000 | $224 | 35 |
Match score weights: distance 35% · size 25% · config 20% · recency 20%. Top-matched comps best support the ARV.
Projected returns pro-forma
-3.0% appreciation · 8.0% rent growth · sell at horizon
- IRR
- 17.3%
- Equity multiple
- 1.74×
- Total profit
- $20,633
- Equity at exit
- $14,895
- IRR
- 28.9%
- Equity multiple
- 4.18×
- Total profit
- $88,866
- Equity at exit
- $8,638
Cash invested: $27,972 (down + closing). Projections, not guarantees.
Landlord ↔ Tenant lean methodology
- Overall (STATE)
- 15 Strongly Tenant-Friendly
- State New York
- 15 Strongly Tenant-Friendly · D+10
- County
- — inherits STATE
- City
- — inherits STATE
ZIP-level market 14621
- Home prices YoY
- -4.0%
- Rents YoY
- 8.9%
- Active inventory
- 114
- Price-to-rent
- 6.1×
Monthly cashflow live
- Estimated rent
- $1,366 high interval (Pro) →
- Mortgage (P&I)
- −$524
- Tax from tax record
- −$48 /mo · $581/yr
- Insurance
- −$42
- HOA
- −$0
- Vacancy / Maint / Mgmt
- −$287
- Net cashflow
- $465
Break-even live
UW: 25.0% down · 7.5% · 30yr · 1.5% tax · 5.0% vac · 8.0% maint · 8.0% mgmt
Financing live
Cash to close
- Down payment
- $24,975
- Closing costs
- $2,997
- Reserves months
- —
- Total cash needed
- —
Loan-product check · same deal, 3 products live
Conventional
25% down · 7.5% · 30yr
- Down + closing
- —
- Monthly P&I
- —
- Monthly cashflow
- —
- DSCR
- —
- Eligible?
- —
Personal DTI + credit; lowest rate.
DSCR
20% down · 8.5% · 30yr
- Down + closing
- —
- Monthly P&I
- —
- Monthly cashflow
- —
- DSCR
- —
- Eligible?
- —
No personal income docs; deal must DSCR.
Hard money
10% down · 12.0% · 12mo
- Down + closing
- —
- Monthly P&I
- —
- Monthly cashflow
- —
- DSCR
- —
- Eligible?
- —
Short-term bridge; refi at stabilization.
Rent comps 27 comps
| Address | Beds | Baths | Sqft | Rent | $/sqft | DOM | Units | Dist |
|---|---|---|---|---|---|---|---|---|
| 171 Mohawk St Rochester, NY | 3.0 | 2.0 | 1054 | $1,775 | $1.68 | 43d | 1 | 0.19mi |
| — Rochester, NY | 2.0 | 1.0 | 896 | $1,100 | $1.23 | 14d | 1 | 0.36mi |
| 11 Renwood St Unit Dn Rochester, NY | 2.0 | 1.0 | 690 | $1,095 | $1.59 | 23d | 1 | 0.38mi |
| 25 Trust St Rochester, NY | 3.0 | 1.5 | 1003 | $1,600 | $1.60 | 3d | 1 | 0.41mi |
| 21 Portland Ct Rochester, NY | 2.0 | 1.0 | 850 | $1,210 | $1.42 | 43d | 1 | 0.51mi |
| 32 Portland Pkwy Rochester, NY | 2.0 | 1.0 | 652 | $1,485 | $2.28 | 2d | 8 | 0.66mi |
| 95 Onondaga Rd Rochester, NY | 1.0–2.0 | 1.0 | 825 | $1,630 | $1.98 | 2d | 1 | 0.77mi |
| 86-88 Baycliff Dr Unit 86 Rochester, NY | 2.0 | 1.0 | 900 | $1,030 | $1.14 | 21d | 1 | 0.87mi |
| 1890 Clifford Ave Rochester, NY | 3.0 | 1.0 | 936 | $1,800 | $1.92 | 23d | 1 | 0.90mi |
| 222 Ellison St Rochester, NY | 2.0 | 1.0 | 971 | $1,000 | $1.03 | 14d | 1 | 0.95mi |
| 16 Cummings St Rochester, NY | 2.0 | 1.0 | 782 | $1,250 | $1.60 | 19d | 1 | 0.95mi |
| 16 Cummings St Rochester, NY | 2.0 | 1.0 | 782 | $1,250 | $1.60 | 43d | 1 | 0.95mi |
| 56 Brambury Dr Rochester, NY | 1.0–2.0 | 1.0 | 720 | $1,425 | $1.98 | 10d | 1 | 0.96mi |
| 11 Maria St Unit 1 DN Rochester, NY | 2.0 | 1.0 | 800 | $895 | $1.12 | 43d | 1 | 1.11mi |
| 1196 E Ridge Rd Rochester, NY | 1.0–2.0 | 1.0 | 800 | $1,265 | $1.58 | 23d | 1 | 1.15mi |
| 2145 Norton St Rochester, NY | 2.0 | 1.0 | 700 | $902 | $1.29 | 43d | 1 | 1.19mi |
| 65 Waring Rd Rochester, NY | 2.0 | 1.0 | 665 | $848 | $1.28 | 43d | 1 | 1.23mi |
| 14-42 Seneca Manor Dr Rochester, NY | 1.0–2.0 | 1.0 | 800 | $1,120 | $1.40 | 43d | 1 | 1.30mi |
| 1750 Hudson Ave Irondequoit, NY | 1.0–2.0 | 1.0 | 654 | $1,900 | $2.90 | 2d | 4 | 1.34mi |
| 36 Charwood Cir Irondequoit, NY | 2.0 | 1.0–1.5 | 1000 | $1,675 | $1.68 | 43d | 3 | 1.36mi |
| 36 Charwood Cir Irondequoit, NY | 1.0–2.0 | 1.0–1.5 | 930 | $2,005 | $2.16 | 2d | 9 | 1.36mi |
| 500 Garson Ave Rochester, NY | 2.0 | 1.0 | 740 | $1,050 | $1.42 | 3d | 1 | 1.42mi |
| 370 Melville St Rochester, NY | 1.0 | 1.0 | 720 | $850 | $1.18 | 3d | 1 | 1.44mi |
| 820 E Main St Unit 19 Rochester, NY | 1.0 | 1.0 | 700 | $995 | $1.42 | 14d | 1 | 1.45mi |
| 2519 Culver Rd Rochester, NY | 1.0–2.0 | 1.0 | 800 | $1,395 | $1.74 | 10d | 4 | 1.45mi |
| 2362 Culver Rd Irondequoit, NY | 1.0–2.0 | 1.0 | 675 | $1,455 | $2.16 | 2d | 3 | 1.46mi |
| 14 Beechwood St Rochester, NY | 2.0 | 1.0 | 850 | $1,200 | $1.41 | 23d | 1 | 1.46mi |
Listing history 6 events
-
2026-04-23status Pending
-
2026-04-08$99,900 Active
-
2025-02-03soldstatus $30,500 Closed 398-char remark
Show marketing remark (398 chars)
This is a single family home that was rented for $1200 per month prior to a fire in part of the second floor in April 2023. An album of 360 degree photos is available at 360.rocmls.com (copy and paste the link) so you can take a good look before asking your agent for a showing. Nice detached garage. Fenced back yard. Glassblock windows. Low maintenance siding. Strictly as-is. Cash offers only.
-
2024-12-27status Pending 398-char remark
Show marketing remark (398 chars)
This is a single family home that was rented for $1200 per month prior to a fire in part of the second floor in April 2023. An album of 360 degree photos is available at 360.rocmls.com (copy and paste the link) so you can take a good look before asking your agent for a showing. Nice detached garage. Fenced back yard. Glassblock windows. Low maintenance siding. Strictly as-is. Cash offers only.
-
2024-12-22price $34,900 398-char remark
Show marketing remark (398 chars)
This is a single family home that was rented for $1200 per month prior to a fire in part of the second floor in April 2023. An album of 360 degree photos is available at 360.rocmls.com (copy and paste the link) so you can take a good look before asking your agent for a showing. Nice detached garage. Fenced back yard. Glassblock windows. Low maintenance siding. Strictly as-is. Cash offers only.
-
2024-12-01$19,900 Active 398-char remark
Show marketing remark (398 chars)
This is a single family home that was rented for $1200 per month prior to a fire in part of the second floor in April 2023. An album of 360 degree photos is available at 360.rocmls.com (copy and paste the link) so you can take a good look before asking your agent for a showing. Nice detached garage. Fenced back yard. Glassblock windows. Low maintenance siding. Strictly as-is. Cash offers only.
ⓘ Source: listings_history table (triggers on properties + properties_extension) + one-shot
backfill from property_details.listing_events for pre-trigger history.
Tax reassessment forecast NY · Partial reset (capped growth)
- Current annual tax
- $581 · $48/mo
- Projected year-2 tax
- $1,135 · $95/mo
- Expected delta
- +$554/yr (+$46/mo · 95.3%)
ⓘ Screening estimate from a state-policy table — verify with the county assessor before closing.
Climate risk First Street
- Flood 1/10 Low FEMA zone X (unshaded) · 0% chance over 30 yrs
- Wildfire 1/10 Low
- Heat 2/10 Low 7 d/yr ≥95°F today · 15 d/yr by 30 yrs out
- Wind 1/10 Low
- Air quality 2/10 Low 1 unhealthy d/yr today · 2 by 30 yrs out
Nearby sold comps map
Loading sold comps map…
Walkable amenities ~0.75 mi
Loading nearby amenities…
Taxation est. · year 1
- Rental income
- $16,392
- − Mortgage interest
- −$5,596
- − Property taxes
- −$581
- − Insurance
- −$500
- − Repairs & maintenance
- −$1,311
- − Management
- −$1,311
- − Depreciation
- −$2,906
- Taxable income
- $4,186
- Est. tax owed @ 24.0%
- −$1,005
- After-tax cash flow
- $4,578/yr
For passive investors: Depreciation is non-cash, so a rental often shows a tax loss while cash-flowing — sheltering income. Rental losses are passive: they offset passive income freely, and up to $25,000/yr can offset ordinary (W-2) income if you actively participate and your MAGI is under $100k (phasing out to $0 by $150k); unused losses carry forward. On sale, claimed depreciation is recaptured at up to 25%, and gains may owe capital-gains tax (a 1031 exchange can defer both). Figures are a year-1 estimate at your 24.0% rate — not tax advice; consult a CPA.
Schools (NCES district)
- District
- Rochester City School District
- NCES district ID
- 3624750
- Math proficiency
- 21% ▬ 0.00%
- Reading proficiency
- 26% ▲ 4.00%
- Median HH income
- $30,923
- Composite
- 18.98/100
- National rank
- #8850
- State rank
- #589 of 590 in NY
Livability — Rochester
- Score
- 76/100
- State rank
- #222
- US rank
- #3482
Category grades
Schools grade is shown separately in the Schools card above.
Census & demographics
- Census place
- Rochester, NY
- County
- Monroe County · 674,131 people
- City population
- 432,803
- Metro
- Rochester, NY
- Population (ZIP)
- 32,381
- Household income
- $35,383
- Rent vs Own
- Severe rent burden
- 2756.0
Population outlook (Monroe County) Hauer SSP2
- Today (2025)
- 759,460 people
- By 2030
- 757,154 · -0.3%
- By 2040
- 740,644 · -2.5%
- By 2050
- 714,443 · -5.9%
- By 2075
- 645,883 · -15.0%
- By 2100
- 547,084 · -28.0%
Race, ethnicity, and origin ACS 2023
- Neighborhood character
- Diverse neighborhood (Simpson 0.66)
- Race & ethnicity
- Hispanic / Latino 40% Black 40% White 14% Two or more races 12% Asian 1%
- Hispanic origin (detail)
- Mexican 1% Puerto Rican 32% Dominican 3%
- Common ancestry
- Romanian 1% Lithuanian 1% Serbian 1%
- Foreign-born
- 8% · Canada, Jamaica
- Languages at home
- 65% English-only · Spanish 30% Other Asian/Pacific 2% French/Haitian/Cajun 1%
Political lean MEDSL · Monroe
- 2024 margin
- D (+19.1) · D 59.5% · R 40.5%
- 2008→2024 swing
- +1.4pp toward D · 2008: 17.7pp · 2024: 19.1pp
- All cycles
- 2024: D+19.1 2020: D+21.0 2016: D+14.1 2012: D+17.4 2008: D+17.7
Not yet ingested
- Civics
- —
Market trends
- HPI YoY
- ▼ -10.66%
- Current HPI
- 254.1805
- Rent YoY
- ▲ 8.88%
- Metro
- Rochester, NY
- State GDP YoY
- ▲ 2.60%
- F500 in state
- 92
Industry mix (Fortune 500 HQ in NY)
| Industry | F500 HQs | Revenue |
|---|---|---|
| Financial Services | 10 | $950B |
|
||
| Consumer Goods | 9 | $162B |
|
||
| Insurance | 4 | $225B |
|
||
| Telecommunications | 2 | $144B |
|
||
| Pharmaceuticals | 2 | $112B |
|
||
| Media / Entertainment | 2 | $69B |
|
||
Price history
+402.0% since first listed6 events — show timeline
- 2026-04-23 Pending — UNYREIS
- 2026-04-08 Listed $99,900 UNYREIS
- 2025-02-03 Sold (MLS) $30,500 UNYREIS
- 2024-12-27 Pending — UNYREIS
- 2024-12-22 Price Changed $34,900 UNYREIS
- 2024-12-01 Listed $19,900 UNYREIS
Property tax history
+1.2%/yrLatest (2025): $581 · +0.0% YoY. Source: county tax records.
Cash-flow waterfall
monthlySold comps — $/sqft
last 12 mo · ≤1 miLoading sold comps…