 🏢 Co-op
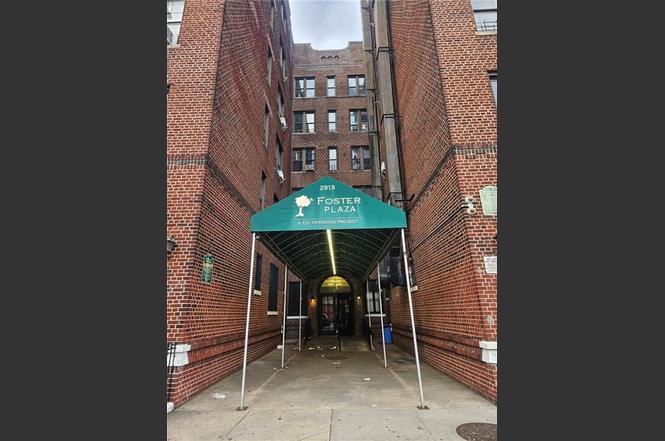
2913 Foster Ave Unit 1B · New York, NY
Flood risk 6/10 · Moderate
- FEMA flood zone
- X (unshaded)
- Chance of flooding over 30 yrs
- 0.74%
- Est. flood insurance / yr
- $507 – $1,088
Fire risk 1/10 · Minimal
- Est. fire insurance / yr
- $691 – $1,283
Heat risk 7/10 · Major
- Hot days now (above 97°F)
- 7 days/yr
- Hot days in 30 yrs
- 15 days/yr
Wind risk 6/10 · Moderate
- Chance of severe wind over 30 yrs
- 64.0%
Air-quality risk 5/10 · Moderate
- Unhealthy air days now
- 6 days/yr
- Unhealthy air days in 30 yrs
- 8 days/yr
Risk factors via First Street. Map © Google.
Why this score? — see what drove the F grade
The composite is a weighted blend of 9 inputs, each scored 0–100. Each bar is that input's sub-score; the figure is the points it added to the 100-point composite (weight × sub-score).
- ARV discount +7.5/15.0
- Schools +5.0/10.0
- Cash flow +3.9/30.0
- 1% rule +3.9/10.0
- Livability +3.8/5.0
- Rent growth +3.0/5.0
- Condition / age +2.5/5.0
- DSCR +0.0/10.0
- Appreciation +0.0/10.0
$265,000
🖨 Deal sheet (PDF) 📄 Offer letter ✓ Due diligence
Listing remarks
Renovated Mint Condition 1 Bedroom in a rarely available Art Deco Boutique pre-war coop building! Minutes away from Prime Flatbush Avenue/Nostrand Junction, along with nearby shops, dining, and amenities, make this a prime opportunity in a vibrant neighborhood. This sun drenched 1 bedroom apartment has plenty of windows, modern kitchen and also has a small office. Pet friendly coop and subletting is allowed with board approval. Close to Multiple bus and train lines B8, B44, B49, 2 and 5 trains. A MUST SEE and MOVE RIGHT IN!!!
Key facts
- Art deco boutique
- Sun drenched
- Pet friendly coop
Tags
Property features AI
Finance
- Other: Building contains 55 units; Co-op shares: 63
- Financial info: Financing available: bank mortgage or cash; 10% down payment required; Flip tax applies (percentage based)
- HOA & community: Monthly maintenance fee; Managed by Impact Real Estate Management; Pets allowed (cats and dogs); Handicap accessible
Exterior
- Parking: No parking
- Utilities: Heat; Water; Sewer
- Home design: Residential property; Located on the first floor
- Exterior features: Intercom door; Heat, public water and public sewer available
Interior
- Bedrooms: 1 bedroom on the first floor
- Flooring: Laminate floors
- Bathrooms: 1 full bathroom on the first floor
- Heating & cooling: No AC units reported
- Interior features: Elevator; 9+ foot ceilings
Neighborhood map
What this means for you Summary
Snapshot
- This is a 1-bed/1.0-bath condo listed at $265k.
Deal economics
- At list price, monthly cash flow is $-756 ($-9k/yr) — negative.
- The deal already cash-flows at list — no discount required.
- To meet the 1% rule (rent ≥ 1% of price), the offer needs to be $235k (11.2% below list).
- Recommended offer: $233k (12.0% below list) — sets the bar for market timing.
Location & tenants
- Location reads 75/100 on livability (#268 in NY, #4,188 nationally) — a middle-class / working-renter tenant base. Strengths: amenities A+, commute A+, health & safety A; Watch: crime F, cost of living F.
- Zoned schools: Elm Tree Elementary School (math 27% / reading 52%, grade F, #1,444 of 2,108 statewide, top 71%, 806 students, 94% FRL); Jhs 278 Marine Park (math 47% / reading 67%, grade B, #192 of 729 statewide, top 28%, 1,076 students, 71% FRL); Midwood High School (math 94% / reading 96%, grade A+, #83 of 1,100 statewide, top 8%, 4,062 students, 73% FRL).
- Market conditions: Rents rising (+2.1%/yr); 167 active listings in the ZIP; 1 comparable units currently listed for rent nearby; solid renter incomes; 10,063 units permitted in Kings County in 2024 (9,789 in 5+ unit buildings).
- This rent runs 34% of the median local income ($84k/yr) — at the standard rent-burdened threshold; future hikes will face affordability resistance.
Forward outlook
- Local home prices are declining (-3.0%/yr); year-one equity from $2k of loan paydown is wiped out by about $8k of value loss. Plan a longer hold.
- Kings County population projected at +13% by 2050 — modest demand growth; plan on rents tracking national, not racing it.
Negotiation context
- It's been on market 181 days — a 12% lower offer ($233k) is reasonable based on typical stale-listing flexibility.
Risks & watch-outs
- Watch-outs: HOA is 33% of rent; built in 1931 — expect roof / HVAC / electrical / plumbing capex.
- Climate carrying-cost: major flood risk; major wind risk, 64% chance of damaging wind over 30y; extreme-heat days projected 7→15/yr by 2055 (HVAC capex compounding) — expect insurance premiums to compound above CPI over the hold.
Questions for the listing agent
- What do current leases actually rent for vs. the listed asking? Can we see a recent rent roll and the last 12 months of T-12 income?
- It's been on market 181 days. Have you received any prior offers? Is the seller open to a 12% concession, seller financing, or rate buy-down credit?
- Built in 1931 — when were the roof, HVAC, electrical panel, plumbing, and water heater last replaced?
- What does the HOA fee cover, when was the last increase, and are there any pending special assessments or reserve-fund shortfalls?
- Any open or pending special assessments — roof, HVAC, plumbing, elevator, façade? What's the per-unit balance and payoff schedule, and is the seller paying it off at close or rolling it to the buyer?
- Why hasn't it sold? Are there any deal-killer items the seller is aware of (foundation, flood, title, zoning, code violations)?
- Is there a deadline driving the sale (1031 exchange, divorce, estate, relocation)? That informs how much negotiation room exists.
- Schools are B-rated — typically a magnet for longer-tenancy family renters. What's the average tenant stay here, and is there a school-zone premium baked into asking?
- Crime grade is F in this area — have there been break-ins, vandalism, or insurance claims at this property in the last 3 years? What carrier currently insures it and at what premium?
- The area grade is low — what's the realistic commute time and amenity access for the typical tenant pool here? Any planned neighborhood developments (good or bad) we should know about?
- What's the average days-on-market for RENTAL listings here right now (not sales)? A rising rental-DOM trend means longer vacancies and softer asking-rent achievability than the comps imply.
- What's the recent tenant-quality profile in this submarket — average credit score on applications, eviction rate, late-payment / NSF rate, and stable-employment percentage? A property-management company in the area should have these aggregated.
- How much new apartment / multifamily construction is in the pipeline within 1–3 miles? Heavy new supply (>2% of stock underway) typically softens rents 12–24 months out; light construction supports rent growth.
Investment metrics
- 1% rule
- 0.89% ✗
- Cap rate
- 2.87%
- Cash-on-cash
- -12.23%
- DSCR
- 0.46
- GRM
- 9.4
CMA / ARV
No comps found within radius.
Projected returns pro-forma
-3.0% appreciation · 2.11% rent growth · sell at horizon
- IRR
- -40.1%
- Equity multiple
- -0.25×
- Total profit
- $-92,663
- Equity at exit
- $39,512
- IRR
- -72.9%
- Equity multiple
- -1.01×
- Total profit
- $-149,008
- Equity at exit
- $22,912
Cash invested: $74,200 (down + closing). Projections, not guarantees.
Landlord ↔ Tenant lean methodology
- Overall (CITY)
- 0 Strongly Tenant-Friendly
- State New York
- 15 Strongly Tenant-Friendly · D+10
- County
- — inherits STATE
- City New York
- 0 Strongly Tenant-Friendly · D+34
ZIP-level market 11210
- Rents YoY
- 2.1%
- Active inventory
- 167
- Price-to-rent
- 9.4×
Monthly cashflow live
- Estimated rent
- $2,354 medium interval (Pro) →
- Mortgage (P&I)
- −$1,390
- Tax est. 1.5%
- −$331 /mo · $3,975/yr
- Insurance
- −$110
- HOA est. from 1 same-building comp
- −$784
- Vacancy / Maint / Mgmt
- −$494
- Net cashflow
- $-756
Break-even live
Sensitivity live
| Price | -10% $-573 | -5% $-664 | +0% $-756 | +5% $-848 | +10% $-939 |
|---|---|---|---|---|---|
| Rent | -10% $-942 | -5% $-849 | +0% $-756 | +5% $-663 | +10% $-570 |
| Rate | -1.0pp $-623 | -0.5pp $-689 | base $-756 | +0.5pp $-825 | +1.0pp $-895 |
UW: 25.0% down · 7.5% · 30yr · 1.5% tax · 5.0% vac · 8.0% maint · 8.0% mgmt
Financing live
Cash to close
- Down payment
- $66,250
- Closing costs
- $7,950
- Reserves months
- —
- Total cash needed
- —
Loan-product check · same deal, 3 products live
Conventional
25% down · 7.5% · 30yr
- Down + closing
- —
- Monthly P&I
- —
- Monthly cashflow
- —
- DSCR
- —
- Eligible?
- —
Personal DTI + credit; lowest rate.
DSCR
20% down · 8.5% · 30yr
- Down + closing
- —
- Monthly P&I
- —
- Monthly cashflow
- —
- DSCR
- —
- Eligible?
- —
No personal income docs; deal must DSCR.
Hard money
10% down · 12.0% · 12mo
- Down + closing
- —
- Monthly P&I
- —
- Monthly cashflow
- —
- DSCR
- —
- Eligible?
- —
Short-term bridge; refi at stabilization.
Rent comps 1 comps
| Address | Beds | Baths | Sqft | Rent | $/sqft | DOM | Units | Dist |
|---|---|---|---|---|---|---|---|---|
| 649 Winthrop St Brooklyn, NY | 1.0 | 1.0 | 500 | $2,500 | $5.00 | 26d | 1 | 1.42mi |
HOA detail condo
- Monthly dues
- $0 · $0/yr
- Assessments
- None detected in remarks — confirm with the listing agent.
Listing history 12 events
-
2026-06-21days on market $265,000 Active 181 DOM
-
2026-06-18days on market $265,000 Active 178 DOM
-
2026-06-17days on market $265,000 Active 177 DOM
-
2026-06-15days on market $265,000 Active 175 DOM
-
2026-06-13days on market $265,000 Active 173 DOM
-
2026-06-10days on market $265,000 Active 169 DOM
-
2026-06-08days on market $265,000 Active 168 DOM
-
2026-06-04days on market $265,000 Active 164 DOM
-
2026-06-03days on market $265,000 Active 163 DOM
-
2026-06-01days on market $265,000 Active 161 DOM
-
2026-05-31days on market $265,000 Active 160 DOM
-
2025-12-22$265,000 Active
ⓘ Source: listings_history table (triggers on properties + properties_extension) + one-shot
backfill from property_details.listing_events for pre-trigger history.
Climate risk First Street
- Flood 6/10 Major FEMA zone X (unshaded) · 74% chance over 30 yrs
- Wildfire 1/10 Low
- Heat 7/10 Severe 7 d/yr ≥97°F today · 15 d/yr by 30 yrs out
- Wind 6/10 Major 64% chance of damaging wind over 30 yrs
- Air quality 5/10 Major 6 unhealthy d/yr today · 8 by 30 yrs out
Nearby sold comps map
Loading sold comps map…
Walkable amenities ~0.75 mi
Loading nearby amenities…
Taxation est. · year 1
- Rental income
- $28,244
- − Mortgage interest
- −$14,844
- − Property taxes
- −$3,975
- − Insurance
- −$1,325
- − Repairs & maintenance
- −$2,259
- − Management
- −$2,259
- − HOA
- −$9,408
- − Depreciation
- −$7,709
- Taxable loss
- −$13,537
- Est. tax savings @ 24.0%
- +$3,249
- After-tax cash flow
- $-5,823/yr
For passive investors: Depreciation is non-cash, so a rental often shows a tax loss while cash-flowing — sheltering income. Rental losses are passive: they offset passive income freely, and up to $25,000/yr can offset ordinary (W-2) income if you actively participate and your MAGI is under $100k (phasing out to $0 by $150k); unused losses carry forward. On sale, claimed depreciation is recaptured at up to 25%, and gains may owe capital-gains tax (a 1031 exchange can defer both). Figures are a year-1 estimate at your 24.0% rate — not tax advice; consult a CPA.
Schools (NCES district)
No district data.
Livability — New York
- Score
- 75/100
- State rank
- #268
- US rank
- #4188
Category grades
Schools grade is shown separately in the Schools card above.
Census & demographics
- Census place
- New York, NY
- County
- Kings County · 2,614,986 people
- City population
- 7,731,280
- Metro
- New York-Newark-Jersey City, NY-NJ-PA
- Population (ZIP)
- 57,915
- Household income
- $83,692
- Rent vs Own
- Severe rent burden
- 3513.0
Population outlook (Kings County) Hauer SSP2
- Today (2025)
- 2,847,441 people
- By 2030
- 2,937,006 · +3.1%
- By 2040
- 3,095,491 · +8.7%
- By 2050
- 3,228,968 · +13.4%
- By 2075
- 3,321,723 · +16.7%
- By 2100
- 3,111,387 · +9.3%
Race, ethnicity, and origin ACS 2023
- Neighborhood character
- Diverse neighborhood (Simpson 0.65)
- Race & ethnicity
- Black 50% White 30% Two or more races 8% Hispanic / Latino 7% Asian 5%
- Hispanic origin (detail)
- Puerto Rican 2% Dominican 1%
- Common ancestry
- Hispanic 12% Romanian 2% Scotch-Irish 2%
- Foreign-born
- 39% · Canada, China, Mexico
- Languages at home
- 67% English-only · French/Haitian/Cajun 13% Spanish 5% Other Indo-European 3%
Political lean MEDSL · Kings
- 2024 margin
- Solid D (+44.0) · D 72.0% · R 28.0%
- 2008→2024 swing
- -15.5pp toward R · 2008: 59.4pp · 2024: 44.0pp
- All cycles
- 2024: D+44.0 2020: D+54.8 2016: D+61.8 2012: D+63.9 2008: D+59.4
Not yet ingested
- Civics
- —
Market trends
- HPI YoY
- ▼ -831.01%
- Current HPI
- 389.9293
- Rent YoY
- ▲ 2.11%
- Metro
- New York-Newark-Jersey City, NY-NJ-PA
- State GDP YoY
- ▲ 2.60%
- F500 in state
- 92
Industry mix (Fortune 500 HQ in NY)
| Industry | F500 HQs | Revenue |
|---|---|---|
| Financial Services | 10 | $950B |
|
||
| Consumer Goods | 9 | $162B |
|
||
| Insurance | 4 | $225B |
|
||
| Telecommunications | 2 | $144B |
|
||
| Pharmaceuticals | 2 | $112B |
|
||
| Media / Entertainment | 2 | $69B |
|
||
Price history
1 event — show timeline
- 2025-12-22 Listed $265,000 BNYMLS
Cash-flow waterfall
monthlySold comps — $/sqft
last 12 mo · ≤1 miLoading sold comps…