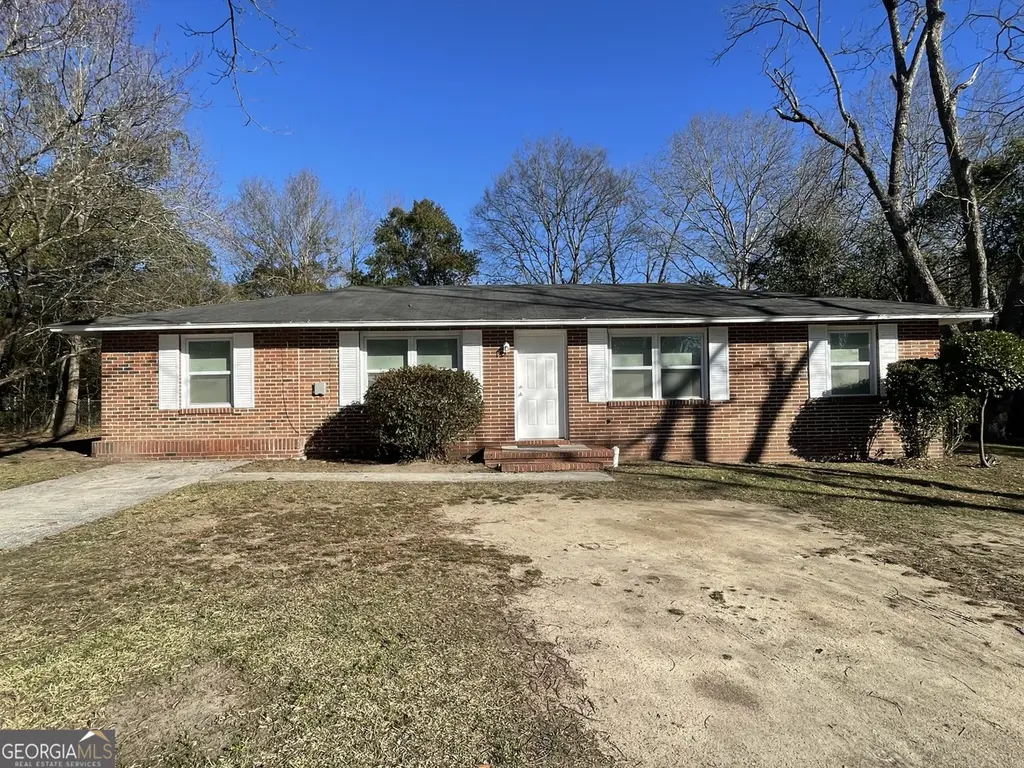
2403 N Groveland Cir · Macon-Bibb County, GA
Flood risk 1/10 · Minimal
- FEMA flood zone
- X (unshaded)
- Chance of flooding over 30 yrs
- 0.0%
- Est. flood insurance / yr
- $507 – $1,088
Fire risk 2/10 · Minimal
- Est. fire insurance / yr
- $963 – $1,789
Heat risk 7/10 · Major
- Hot days now (above 109°F)
- 7 days/yr
- Hot days in 30 yrs
- 18 days/yr
Wind risk 6/10 · Moderate
- Chance of severe wind over 30 yrs
- 66.0%
Air-quality risk 3/10 · Minor
- Unhealthy air days now
- 3 days/yr
- Unhealthy air days in 30 yrs
- 4 days/yr
Risk factors via First Street. Map © Google.
Why this score? — see what drove the C- grade
The composite is a weighted blend of 9 inputs, each scored 0–100. Each bar is that input's sub-score; the figure is the points it added to the 100-point composite (weight × sub-score).
- Cash flow +25.6/30.0
- DSCR +8.5/10.0
- 1% rule +5.9/10.0
- Rent growth +3.8/5.0
- Livability +2.5/5.0
- Condition / age +2.5/5.0
- ARV discount +1.2/15.0
- Schools +1.2/10.0
- Appreciation +0.0/10.0
$119,000
🖨 Deal sheet 📄 Offer letter ✓ Due diligence
Listing remarks MLS
Welcome to the Recently Updated 4 Bedroom Home in South Macon, a perfect blend of comfort and style. This home boasts an open concept design that seamlessly connects the living, dining, and kitchen areas, creating a spacious and inviting atmosphere. With four generously sized bedrooms and 1.5 bathrooms, this home offers ample space for relaxation and personal comfort. The recent updates add a modern touch to the home, enhancing its appeal and functionality. This property is perfect for a first time home owner or an investor looking to add their rental portfolio.
Key facts
- Solid construction
- Recently updated
- Fenced in backyard
Tags
Neighborhood map
What this means for you Summary
Snapshot
- This is a 3-bed/1.5-bath single-family listed at $119k.
Deal economics
- At list price, monthly cash flow is $282 ($3k/yr) — positive.
- The deal already cash-flows at list — no discount required.
- Meets the 1% rule at list price ($1k rent vs $119k).
- Recommended offer: $108k (9.0% below list) — sets the bar for market timing.
- Cap rate 9.1% vs local median 5.4% in Macon-Bibb County — top-decile yield for the area; either an underpriced asset or a hidden risk that comps aren't pricing in. Stress-test before assuming the spread holds.
Location & tenants
- Location reads: area grade C — affects rentability + tenant quality, not the cash-flow math above.
- Bibb County (urban): math 11% / reading 18% proficiency, ranked #161 of 174 in GA (top 92%) — low school quality limits family demand, transient renter base, plan for 1-2y turnover; 75% free/reduced lunch — lower-income household profile, screen leases tightly.
- Market conditions: Rents rising fast (+5.0%/yr); 207 active listings in the ZIP; 19 comparable units currently listed for rent nearby; rentals lingering (median 44d on market — plan ~5-8 weeks vacancy on turnover, expect pricing pressure); 58% of comp listings sitting > 30 days — soft ceiling on asking rent; lower-income renter base — watch delinquency; 154 units permitted in Bibb County in 2024 (0 in 5+ unit buildings).
- At $1,292/mo this rent would consume 52% of the median local household income ($30k/yr) (locally 1335% of renters already pay >50% of income on rent) — very limited rent-growth headroom before tenants either downsize or default.
Forward outlook
- Local home prices are declining (-3.0%/yr); year-one equity from $823 of loan paydown is wiped out by about $4k of value loss. Plan a longer hold.
- Bibb County population projected at -12% by 2050 — secular population decline; favor cash flow + early exit over multi-decade hold.
- At projected returns (-3.0% appreciation + 5.0% rent growth), your $33k cash investment doubles in ~9 years — after that, you're playing with house money.
Negotiation context
- It's been on market 107 days — a 9% lower offer ($108k) is reasonable based on typical stale-listing flexibility.
- 7 sale attempts since 5y ago with the ask held roughly flat each time — persistent listings suggest the price (not the market) is what's stuck; bring a comps-based counter.
- Current owner paid $48k; list at $119k implies a 148% gain — meaningful room to come down on a strong offer.
Risks & watch-outs
- Watch-outs: built in 1959 — expect roof / HVAC / electrical / plumbing capex.
- Climate carrying-cost: major wind risk, 66% chance of damaging wind over 30y; extreme-heat days projected 7→18/yr by 2055 (HVAC capex compounding) — expect insurance premiums to compound above CPI over the hold.
Questions for the listing agent
- It's been on market 107 days. Have you received any prior offers? Is the seller open to a 9% concession, seller financing, or rate buy-down credit?
- Built in 1959 — when were the roof, HVAC, electrical panel, plumbing, and water heater last replaced?
- Why hasn't it sold? Are there any deal-killer items the seller is aware of (foundation, flood, title, zoning, code violations)?
- Is there a deadline driving the sale (1031 exchange, divorce, estate, relocation)? That informs how much negotiation room exists.
- What's the average days-on-market for RENTAL listings here right now (not sales)? A rising rental-DOM trend means longer vacancies and softer asking-rent achievability than the comps imply.
- What's the recent tenant-quality profile in this submarket — average credit score on applications, eviction rate, late-payment / NSF rate, and stable-employment percentage? A property-management company in the area should have these aggregated.
- How much new for-sale + rental construction is in the pipeline within 1–3 miles? Heavy new supply typically softens prices + rents 12–24 months out; constrained supply supports both.
Investment metrics
- 1% rule
- 1.09% ✓
- Cap rate
- 9.14%
- Cash-on-cash
- 10.15%
- DSCR
- 1.45
- GRM
- 7.7
CMA / ARV
- ARV (median comp)
- $104,304
- List price
- $119,000
- Delta
- 14.09%
- Verdict
- OVERPRICED
- Comps
- 20 within 1.0 mi
Show comp detail 12 sales within ~0.75 mi
| Address | Dist | Beds/Ba | Sqft | Sold | Price | $/sf | Match |
|---|---|---|---|---|---|---|---|
| 4525 Clover Pl | 0.09mi | 3/2.0 | 1,291 (-1%) | 1mo | $130,000 | $101 | 92 |
| 2455 Rosen Ave | 0.14mi | 4/2.0 (+1) | 1,344 (+3%) | 4mo | $135,000 | $100 | 77 |
| 2315 Silver Pines Dr | 0.25mi | 3/2.0 | 1,377 (+6%) | 2mo | $169,000 | $123 | 75 |
| 4685 Pinedale Dr | 0.40mi | 3/1.5 | 1,404 (+8%) | 2mo | $92,000 | $66 | 66 |
| 2325 Silver Pines Dr | 0.22mi | 3/1.5 | 1,440 (+11%) | 10mo | $162,000 | $113 | 63 |
| 5810 Bloomfield Rd | 0.51mi | 3/2.0 | 1,329 (+2%) | 12mo | $100,000 | $75 | 61 |
| 2260 Lyn Dr | 0.39mi | 3/2.0 | 1,412 (+9%) | 8mo | $108,000 | $76 | 59 |
| 4775 Elkan Ave | 0.49mi | 3/1.5 | 1,215 (-6%) | 14mo | $50,000 | $41 | 54 |
| 4255 Vinson Ave | 0.29mi | 4/1.0 (+1) | 1,108 (-15%) | 7mo | $80,000 | $72 | 49 |
| 2489 Locksley Dr | 0.75mi | 3/2.0 | 1,381 (+6%) | 4mo | $169,900 | $123 | 49 |
| 4416 Thrasher Cir | 0.48mi | 3/2.0 | 1,120 (-14%) | 14mo | $145,000 | $129 | 41 |
| 2366 Lancelot Pl | 0.70mi | 3/2.0 | 1,409 (+8%) | 13mo | $134,000 | $95 | 41 |
Match score weights: distance 35% · size 25% · config 20% · recency 20%. Top-matched comps best support the ARV.
Projected returns pro-forma
-3.0% appreciation · 5.03% rent growth · sell at horizon
- IRR
- 1.0%
- Equity multiple
- 1.04×
- Total profit
- $1,331
- Equity at exit
- $17,743
- IRR
- 12.4%
- Equity multiple
- 2.07×
- Total profit
- $35,662
- Equity at exit
- $10,289
Cash invested: $33,320 (down + closing). Projections, not guarantees.
Landlord ↔ Tenant lean methodology
- Overall (STATE)
- 90 Strongly Landlord-Friendly
- State Georgia
- 90 Strongly Landlord-Friendly · R+3
- County
- — inherits STATE
- City
- — inherits STATE
ZIP-level market 31206
- Rents YoY
- 5.0%
- Active inventory
- 207
- Price-to-rent
- 7.7×
Monthly cashflow live
- Estimated rent
- $1,292 high interval (Pro) →
- Mortgage (P&I)
- −$624
- Tax from tax record
- −$65 /mo · $778/yr
- Insurance
- −$50
- HOA
- −$0
- Vacancy / Maint / Mgmt
- −$271
- Net cashflow
- $282
Break-even live
UW: 25.0% down · 7.5% · 30yr · 1.5% tax · 5.0% vac · 8.0% maint · 8.0% mgmt
Financing live
Cash to close
- Down payment
- $29,750
- Closing costs
- $3,570
- Reserves months
- —
- Total cash needed
- —
Loan-product check · same deal, 3 products live
Conventional
25% down · 7.5% · 30yr
- Down + closing
- —
- Monthly P&I
- —
- Monthly cashflow
- —
- DSCR
- —
- Eligible?
- —
Personal DTI + credit; lowest rate.
DSCR
20% down · 8.5% · 30yr
- Down + closing
- —
- Monthly P&I
- —
- Monthly cashflow
- —
- DSCR
- —
- Eligible?
- —
No personal income docs; deal must DSCR.
Hard money
10% down · 12.0% · 12mo
- Down + closing
- —
- Monthly P&I
- —
- Monthly cashflow
- —
- DSCR
- —
- Eligible?
- —
Short-term bridge; refi at stabilization.
Rent comps 19 comps
| Address | Beds | Baths | Sqft | Rent | $/sqft | DOM | Units | Dist |
|---|---|---|---|---|---|---|---|---|
| 4455 Fairfax Dr Macon, GA | 3.0 | 2.0 | 1352 | $1,225 | $0.91 | 43d | 1 | 0.07mi |
| 4471 Elkan Ave Macon, GA | 4.0 | 2.0 | 1128 | $1,495 | $1.33 | 43d | 1 | 0.22mi |
| 2423 Thrasher Ave Macon, GA | 3.0 | 1.0 | 1056 | $725 | $0.69 | 43d | 1 | 0.24mi |
| 4278 Vinson Ave Macon, GA | 4.0 | 2.0 | 1104 | $1,550 | $1.40 | 20d | 1 | 0.27mi |
| 2477 Thrasher Ave Macon, GA | 3.0 | 1.0 | 960 | $825 | $0.86 | 13d | 1 | 0.31mi |
| 2418 Adger Rd Macon, GA | 4.0 | 1.0 | 1365 | $1,500 | $1.10 | 43d | 1 | 0.32mi |
| 4300 Essex Rd Macon, GA | 4.0 | 1.5 | 1246 | $1,450 | $1.16 | 20d | 1 | 0.34mi |
| 4685 Pinedale Dr Macon, GA | 3.0 | 1.5 | 1404 | $1,450 | $1.03 | 13d | 1 | 0.39mi |
| 2427 Vivian Dr Macon, GA | 4.0 | 1.0 | 1056 | $1,150 | $1.09 | 43d | 1 | 0.40mi |
| 4386 Thrasher Cir Macon, GA | 3.0 | 2.0 | 1120 | $1,400 | $1.25 | 43d | 1 | 0.40mi |
| 5962 Bloomfield Rd Macon, GA | 4.0 | 1.5 | 1159 | $1,300 | $1.12 | 13d | 1 | 0.50mi |
| 5771 Satterfield Dr Macon, GA | 3.0 | 1.0 | 888 | $1,250 | $1.41 | 43d | 1 | 0.63mi |
| 2665 Chatsworth Ct Macon, GA | 3.0 | 1.5 | 1056 | $1,175 | $1.11 | 43d | 1 | 0.67mi |
| 5708 Edwina Dr Macon, GA | 3.0 | 1.0 | 925 | $1,275 | $1.38 | 43d | 1 | 0.85mi |
| 5487 Bloomfield Rd Macon, GA | 3.0 | 2.0 | 1050 | $1,200 | $1.14 | 20d | 1 | 0.85mi |
| 2916 Walmar Dr Macon, GA | 3.0 | 2.0 | 1300 | $1,275 | $0.98 | 43d | 1 | 1.05mi |
| 2961 Deeb Dr Macon, GA | 3.0 | 1.0 | 1000 | $1,000 | $1.00 | 43d | 1 | 1.09mi |
| 3257 Ohara Dr S Macon, GA | 3.0 | 1.0 | 1352 | $1,125 | $0.83 | 20d | 1 | 1.32mi |
| 3733 Lindsey Dr Macon, GA | 3.0 | 2.0 | 1645 | $1,350 | $0.82 | 13d | 1 | 1.41mi |
Listing history 16 events
-
2026-05-31days on market $119,000 Active 107 DOM
-
2026-05-30days on market $119,000 Active 106 DOM
-
2026-03-09historical $1,195
-
2026-02-14$119,000 Active 568-char remark
Show marketing remark (568 chars)
Welcome to the Recently Updated 4 Bedroom Home in South Macon, a perfect blend of comfort and style. This home boasts an open concept design that seamlessly connects the living, dining, and kitchen areas, creating a spacious and inviting atmosphere. With four generously sized bedrooms and 1.5 bathrooms, this home offers ample space for relaxation and personal comfort. The recent updates add a modern touch to the home, enhancing its appeal and functionality. This property is perfect for a first time home owner or an investor looking to add their rental portfolio.
-
2026-02-13$119,000 New 568-char remark
Show marketing remark (568 chars)
Welcome to the Recently Updated 4 Bedroom Home in South Macon, a perfect blend of comfort and style. This home boasts an open concept design that seamlessly connects the living, dining, and kitchen areas, creating a spacious and inviting atmosphere. With four generously sized bedrooms and 1.5 bathrooms, this home offers ample space for relaxation and personal comfort. The recent updates add a modern touch to the home, enhancing its appeal and functionality. This property is perfect for a first time home owner or an investor looking to add their rental portfolio.
-
2026-01-23$1,195
-
2026-01-23historical $1,195
-
2026-01-16$1,195
-
2021-06-10soldstatus $48,000
-
2021-06-09soldstatus $48,000 Sold
-
2021-06-09soldstatus $48,000
-
2021-06-09soldstatus $48,000
-
2021-03-15status Under Contract
-
2021-01-22$58,000 Active
-
2021-01-22$58,000
-
2021-01-22$58,000
ⓘ Source: listings_history table (triggers on properties + properties_extension) + one-shot
backfill from property_details.listing_events for pre-trigger history.
Tax reassessment forecast GA · Resets to sale price
- Current annual tax
- $778 · $65/mo
- Projected year-2 tax
- $1,095 · $91/mo
- Expected delta
- +$317/yr (+$26/mo · 40.7%)
ⓘ Screening estimate from a state-policy table — verify with the county assessor before closing.
Climate risk First Street
- Flood 1/10 Low FEMA zone X (unshaded) · 0% chance over 30 yrs
- Wildfire 2/10 Low
- Heat 7/10 Severe 7 d/yr ≥109°F today · 18 d/yr by 30 yrs out
- Wind 6/10 Major 66% chance of damaging wind over 30 yrs
- Air quality 3/10 Moderate 3 unhealthy d/yr today · 4 by 30 yrs out
Nearby sold comps map
Loading sold comps map…
Walkable amenities ~0.75 mi
Loading nearby amenities…
Taxation est. · year 1
- Rental income
- $15,500
- − Mortgage interest
- −$6,666
- − Property taxes
- −$778
- − Insurance
- −$595
- − Repairs & maintenance
- −$1,240
- − Management
- −$1,240
- − Depreciation
- −$3,462
- Taxable income
- $1,519
- Est. tax owed @ 24.0%
- −$365
- After-tax cash flow
- $3,018/yr
For passive investors: Depreciation is non-cash, so a rental often shows a tax loss while cash-flowing — sheltering income. Rental losses are passive: they offset passive income freely, and up to $25,000/yr can offset ordinary (W-2) income if you actively participate and your MAGI is under $100k (phasing out to $0 by $150k); unused losses carry forward. On sale, claimed depreciation is recaptured at up to 25%, and gains may owe capital-gains tax (a 1031 exchange can defer both). Figures are a year-1 estimate at your 24.0% rate — not tax advice; consult a CPA.
Schools (NCES district)
- District
- Bibb County
- NCES district ID
- 1300420
- Math proficiency
- 11% ▼ -14.00%
- Reading proficiency
- 18% ▼ -11.00%
- Median HH income
- $37,426
- Composite
- 12.13/100
- National rank
- #9654
- State rank
- #161 of 174 in GA
Livability — Macon-Bibb County
No livability data for this city. (Only ~50 U.S. cities are tracked.)
Census & demographics
- Census place
- Macon-Bibb County, GA
- County
- Bibb County · 164,332 people
- City population
- 143,186
- Metro
- Macon-Bibb County, GA
- Population (ZIP)
- 24,310
- Household income
- $30,042
- Rent vs Own
- Severe rent burden
- 1335.0
Population outlook (Bibb County) Hauer SSP2
- Today (2025)
- 148,772 people
- By 2030
- 145,904 · -1.9%
- By 2040
- 139,404 · -6.3%
- By 2050
- 131,603 · -11.5%
- By 2075
- 111,050 · -25.4%
- By 2100
- 83,346 · -44.0%
Race, ethnicity, and origin ACS 2023
- Neighborhood character
- Predominantly Black (76%)
- Race & ethnicity
- Black 76% White 12% Hispanic / Latino 8% Two or more races 4%
- Hispanic origin (detail)
- Mexican 5% Puerto Rican 1%
- Common ancestry
- Lithuanian 1% Italian 1%
- Foreign-born
- 4% · Canada
- Languages at home
- 91% English-only · Spanish 8%
Political lean MEDSL · Bibb
- 2024 margin
- Strong D (+22.4) · D 61.0% · R 38.5%
- 2008→2024 swing
- +4.4pp toward D · 2008: 18.0pp · 2024: 22.4pp
- All cycles
- 2024: D+22.4 2020: D+23.8 2016: D+20.2 2012: D+20.0 2008: D+18.0
Not yet ingested
- Civics
- —
Market trends
- HPI YoY
- ▼ -80.17%
- Current HPI
- 148.6765
- Rent YoY
- ▲ 5.03%
- Metro
- Macon-Bibb County, GA
- State GDP YoY
- ▲ 2.66%
- F500 in state
- 28
Industry mix (Fortune 500 HQ in GA)
| Industry | F500 HQs | Revenue |
|---|---|---|
| Paper / Packaging | 2 | $29B |
|
||
| Retail | 1 | $160B |
|
||
| Transportation / Logistics | 1 | $91B |
|
||
| Airlines | 1 | $62B |
|
||
| Consumer Goods | 1 | $47B |
|
||
| Utilities | 1 | $25B |
|
||
Price history
-97.9% since first listed14 events — show timeline
- 2026-03-09 Rental Removed $1,195 RentEngineListings
- 2026-02-14 Listed $119,000 MGMLS
- 2026-02-13 Listed $119,000 GAMLS
- 2026-01-23 Listed for Rent $1,195 RentEngineListings
- 2026-01-23 Rental Removed $1,195 SHOWMOJO
- 2026-01-16 Listed for Rent $1,195 SHOWMOJO
- 2021-06-10 Sold (Public Records) $48,000 Public Records
- 2021-06-09 Sold (MLS) $48,000 MGMLS
- 2021-06-09 Sold (MLS) $48,000 CGMLS
- 2021-06-09 Sold (MLS) $48,000 GAMLS
- 2021-03-15 Pending — GAMLS
- 2021-01-22 Listed $58,000 MGMLS
- 2021-01-22 Listed $58,000 CGMLS
- 2021-01-22 Listed $58,000 GAMLS
Property tax history
+11.6%/yrLatest (2025): $778 · -1.3% YoY. Source: county tax records.
Cash-flow waterfall
monthlySold comps — $/sqft
last 12 mo · ≤1 miLoading sold comps…