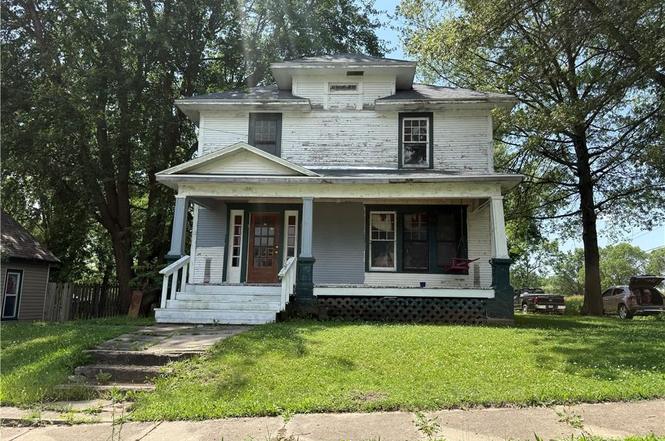
102 E 4th St · Pickering, MO
Flood risk 1/10 · Minimal
- FEMA flood zone
- X (unshaded)
- Chance of flooding over 30 yrs
- 0.0%
- Est. flood insurance / yr
- $507 – $1,088
Fire risk 3/10 · Minor
- Est. fire insurance / yr
- $1,054 – $1,958
Heat risk 3/10 · Minor
- Hot days now (above 106°F)
- 7 days/yr
- Hot days in 30 yrs
- 15 days/yr
Wind risk 2/10 · Minimal
- Chance of severe wind over 30 yrs
- —
Air-quality risk 1/10 · Minimal
- Unhealthy air days now
- 0 days/yr
- Unhealthy air days in 30 yrs
- 0 days/yr
Risk factors via First Street. Map © Google.
Why this score? — see what drove the B grade
The composite is a weighted blend of 9 inputs, each scored 0–100. Each bar is that input's sub-score; the figure is the points it added to the 100-point composite (weight × sub-score).
- Cash flow +30.0/30.0
- 1% rule +10.0/10.0
- DSCR +10.0/10.0
- ARV discount +7.5/15.0
- Appreciation +5.0/10.0
- Schools +3.5/10.0
- Livability +2.9/5.0
- Rent growth +2.5/5.0
- Condition / age +2.5/5.0
$39,000
🖨 Deal sheet 📄 Offer letter ✓ Due diligence
Listing remarks
Fixer-Upper Opportunity! This charming home features beautiful original woodwork throughout and is full of potential. With a little TLC, it can be transformed into a wonderful family home. The property offers 4 bedrooms and 2 bathrooms and sits on a desirable corner lot. Being sold as-is, this is a great opportunity for investors, renovators, or buyers looking to add their personal touch!!!
Key facts
- 7,405 sq ft lot
- Built 1915
Property features AI
Finance
- Other: Located inside city limits
- HOA & community: No association fees; Maintenance not provided
Exterior
- Parking: Off-street parking
- Utilities: Public water; Public sewer; Fiber internet available
- Home design: Single-family residence; 2-story floor plan; Residential property
- Construction: Wood siding; Composition roof; Approximately 101+ years old; Above-grade finished area reported (source: assessor)
- Exterior features: Porch; City lot; Corner lot; Paved road access
Interior
- Kitchen: Kitchen on the first floor
- Bedrooms: 4 bedrooms (all located on the second floor)
- Flooring: Wood flooring
- Bathrooms: 2 full bathrooms (one on the first floor and one on the second floor)
- Heating & cooling: Other heating; No central cooling
- Interior features: Wood flooring; Formal dining area; Unfinished basement
Neighborhood map
What this means for you Summary
Snapshot
- This is a 4-bed/2.0-bath other listed at $39k.
Deal economics
- At list price, monthly cash flow is $561 ($7k/yr) — positive.
- The deal already cash-flows at list — no discount required.
- Meets the 1% rule at list price ($1k rent vs $39k).
Location & tenants
- Location reads 58/100 on livability (#606 in MO) — a working-class tenant base; expect higher turnover. Strengths: cost of living A+, housing A+; Watch: schools C-, crime F, amenities F.
- North Nodaway County R-VI (rural): math 35% / reading 40% proficiency, ranked #343 of 535 in MO (top 64%) — families likely to look elsewhere, expect single-tenant / working-renter base with shorter leases.
- Market conditions: 1 active listings in the ZIP; 49 units permitted in Nodaway County in 2024 (0 in 5+ unit buildings).
Forward outlook
- In year one you build about $1k of equity ($270 loan paydown + $1k appreciation (3.0% local appreciation)).
- Nodaway County population projected at -13% by 2050 — secular population decline; favor cash flow + early exit over multi-decade hold.
- At projected returns (3.0% appreciation + 3.0% rent growth), your $11k cash investment doubles in ~2 years — after that, you're playing with house money.
Negotiation context
- Only 1 days on market — expect competitive offers; lowballing is unlikely to land.
Risks & watch-outs
- Watch-outs: built in 1915 — expect roof / HVAC / electrical / plumbing capex.
Questions for the listing agent
- Built in 1915 — when were the roof, HVAC, electrical panel, plumbing, and water heater last replaced?
- Is there a deadline driving the sale (1031 exchange, divorce, estate, relocation)? That informs how much negotiation room exists.
- Crime grade is F in this area — have there been break-ins, vandalism, or insurance claims at this property in the last 3 years? What carrier currently insures it and at what premium?
- What's the average days-on-market for RENTAL listings here right now (not sales)? A rising rental-DOM trend means longer vacancies and softer asking-rent achievability than the comps imply.
- What's the recent tenant-quality profile in this submarket — average credit score on applications, eviction rate, late-payment / NSF rate, and stable-employment percentage? A property-management company in the area should have these aggregated.
- How much new for-sale + rental construction is in the pipeline within 1–3 miles? Heavy new supply typically softens prices + rents 12–24 months out; constrained supply supports both.
Investment metrics
- 1% rule
- 2.70% ✓
- Cap rate
- 23.55%
- Cash-on-cash
- 61.65%
- DSCR
- 3.74
- GRM
- 3.1
CMA / ARV
No comps found within radius.
Projected returns pro-forma
3.0% appreciation · 3.0% rent growth · sell at horizon
- IRR
- 66.5%
- Equity multiple
- 4.70×
- Total profit
- $40,444
- Equity at exit
- $17,536
- IRR
- 66.0%
- Equity multiple
- 9.60×
- Total profit
- $93,932
- Equity at exit
- $27,025
Cash invested: $10,920 (down + closing). Projections, not guarantees.
Landlord ↔ Tenant lean methodology
- Overall (STATE)
- 81 Strongly Landlord-Friendly
- State Missouri
- 81 Strongly Landlord-Friendly · R+10
- County
- — inherits STATE
- City
- — inherits STATE
ZIP-level market 64476
- Active inventory
- 1
- Price-to-rent
- 3.1×
Monthly cashflow live
- Estimated rent
- $1,052 medium interval (Pro) →
- Mortgage (P&I)
- −$205
- Tax from tax record
- −$49 /mo · $591/yr
- Insurance
- −$16
- HOA
- −$0
- Vacancy / Maint / Mgmt
- −$221
- Net cashflow
- $561
Break-even live
UW: 25.0% down · 7.5% · 30yr · 1.5% tax · 5.0% vac · 8.0% maint · 8.0% mgmt
Financing live
Cash to close
- Down payment
- $9,750
- Closing costs
- $1,170
- Reserves months
- —
- Total cash needed
- —
Loan-product check · same deal, 3 products live
Conventional
25% down · 7.5% · 30yr
- Down + closing
- —
- Monthly P&I
- —
- Monthly cashflow
- —
- DSCR
- —
- Eligible?
- —
Personal DTI + credit; lowest rate.
DSCR
20% down · 8.5% · 30yr
- Down + closing
- —
- Monthly P&I
- —
- Monthly cashflow
- —
- DSCR
- —
- Eligible?
- —
No personal income docs; deal must DSCR.
Hard money
10% down · 12.0% · 12mo
- Down + closing
- —
- Monthly P&I
- —
- Monthly cashflow
- —
- DSCR
- —
- Eligible?
- —
Short-term bridge; refi at stabilization.
Listing history 2 events
-
2026-06-17remarks 394-char remark
-
2026-06-17$39,000 Active 1 DOM
ⓘ Source: listings_history table (triggers on properties + properties_extension) + one-shot
backfill from property_details.listing_events for pre-trigger history.
Tax reassessment forecast MO · Resets to sale price
- Current annual tax
- $591 · $49/mo
- Projected year-2 tax
- $591 · $49/mo
- Expected delta
- $0/yr ($0/mo · 0.0%)
ⓘ Screening estimate from a state-policy table — verify with the county assessor before closing.
Climate risk First Street
- Flood 1/10 Low FEMA zone X (unshaded) · 0% chance over 30 yrs
- Wildfire 3/10 Moderate
- Heat 3/10 Moderate 7 d/yr ≥106°F today · 15 d/yr by 30 yrs out
- Wind 2/10 Low
- Air quality 1/10 Low 0 unhealthy d/yr today · 0 by 30 yrs out
Nearby sold comps map
Loading sold comps map…
Walkable amenities ~0.75 mi
Loading nearby amenities…
Taxation est. · year 1
- Rental income
- $12,623
- − Mortgage interest
- −$2,185
- − Property taxes
- −$591
- − Insurance
- −$195
- − Repairs & maintenance
- −$1,010
- − Management
- −$1,010
- − Depreciation
- −$1,135
- Taxable income
- $6,498
- Est. tax owed @ 24.0%
- −$1,560
- After-tax cash flow
- $5,172/yr
For passive investors: Depreciation is non-cash, so a rental often shows a tax loss while cash-flowing — sheltering income. Rental losses are passive: they offset passive income freely, and up to $25,000/yr can offset ordinary (W-2) income if you actively participate and your MAGI is under $100k (phasing out to $0 by $150k); unused losses carry forward. On sale, claimed depreciation is recaptured at up to 25%, and gains may owe capital-gains tax (a 1031 exchange can defer both). Figures are a year-1 estimate at your 24.0% rate — not tax advice; consult a CPA.
Schools (NCES district)
- District
- North Nodaway County R-VI
- NCES district ID
- 2921690
- Math proficiency
- 35% ▼ -5.00%
- Reading proficiency
- 40% ▬ 0.00%
- Median HH income
- $47,220
- Composite
- 34.68/100
- National rank
- #10063
- State rank
- #343 of 535 in MO
Livability — Pickering
- Score
- 58/100
- State rank
- #606
- US rank
- #21227
Category grades
Schools grade is shown separately in the Schools card above.
Census & demographics
- Census place
- Pickering, MO
- Population (ZIP)
- 268
Population outlook (Nodaway County) Hauer SSP2
- Today (2025)
- 22,010 people
- By 2030
- 21,531 · -2.2%
- By 2040
- 20,360 · -7.5%
- By 2050
- 19,210 · -12.7%
- By 2075
- 17,711 · -19.5%
- By 2100
- 16,796 · -23.7%
Race, ethnicity, and origin ACS 2023
- Neighborhood character
- Predominantly White (96%)
- Race & ethnicity
- White 96% Asian 2% Two or more races 2%
- Common ancestry
- Lithuanian 4% Slovak 2% Romanian 2%
- Foreign-born
- 2%
- Languages at home
- 98% English-only · Other Indo-European 2%
Political lean MEDSL · Nodaway
- 2024 margin
- Solid R (+43.7) · D 27.6% · R 71.4% · Other 1.0%
- 2008→2024 swing
- -33.2pp toward R · 2008: -10.5pp · 2024: -43.7pp
- All cycles
- 2024: R+43.7 2020: R+40.5 2016: R+40.8 2012: R+27.0 2008: R+10.5
Not yet ingested
- Civics
- —
Market trends
- HPI YoY
- —
- Current HPI
- —
- Rent YoY
- —
- Metro
- —
- State GDP YoY
- ▲ 1.84%
- F500 in state
- 20
Industry mix (Fortune 500 HQ in MO)
| Industry | F500 HQs | Revenue |
|---|---|---|
| Healthcare | 1 | $163B |
|
||
| Insurance | 1 | $21B |
|
||
| Industrial Technology | 1 | $17B |
|
||
| Retail | 1 | $16B |
|
||
| Industrial Distribution | 1 | $10B |
|
||
| Utilities | 1 | $9B |
|
||
Price history
1 event — show timeline
- 2026-06-17 Listed $39,000 Heartland MLS as Distributed by MLS Grid
Property tax history
+0.9%/yrLatest (2025): $591 · +3.7% YoY. Source: county tax records.
Cash-flow waterfall
monthlySold comps — $/sqft
last 12 mo · ≤1 miLoading sold comps…