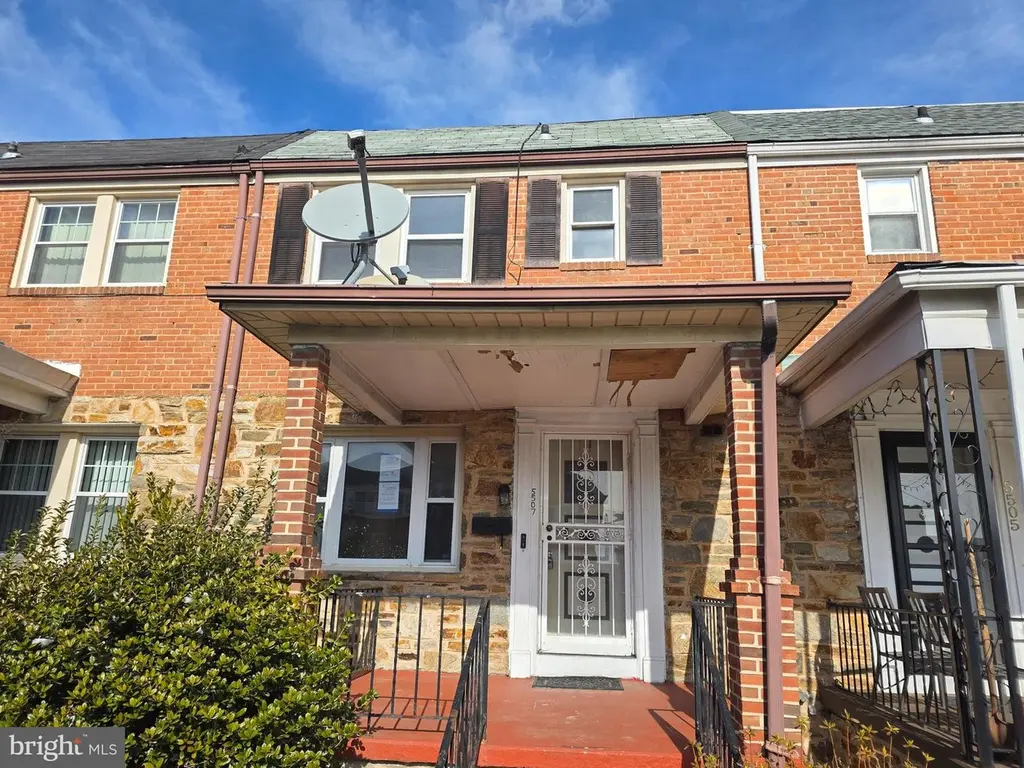
5507 Rubin Ave · Baltimore, MD
Flood risk 1/10 · Minimal
- FEMA flood zone
- X (unshaded)
- Chance of flooding over 30 yrs
- 0.0%
- Est. flood insurance / yr
- $473 – $860
Fire risk 1/10 · Minimal
- Est. fire insurance / yr
- $755 – $1,403
Heat risk 7/10 · Major
- Hot days now (above 103°F)
- 7 days/yr
- Hot days in 30 yrs
- 15 days/yr
Wind risk 4/10 · Minor
- Chance of severe wind over 30 yrs
- 21.0%
Air-quality risk 3/10 · Minor
- Unhealthy air days now
- 3 days/yr
- Unhealthy air days in 30 yrs
- 4 days/yr
Risk factors via First Street. Map © Google.
Why this score? — see what drove the B grade
The composite is a weighted blend of 9 inputs, each scored 0–100. Each bar is that input's sub-score; the figure is the points it added to the 100-point composite (weight × sub-score).
- Cash flow +28.6/30.0
- ARV discount +15.0/15.0
- DSCR +10.0/10.0
- 1% rule +8.5/10.0
- Livability +3.8/5.0
- Rent growth +3.1/5.0
- Condition / age +2.5/5.0
- Schools +1.0/10.0
- Appreciation +0.0/10.0
$139,500
🖨 Deal sheet 📄 Offer letter ✓ Due diligence
Listing remarks MLS
HUD Case 241-933900. This townhome on a dead end street is ready for its new owners. Home features a welcoming front porch, wood flooring throughout. First floor has a Living room, dining room, kitchen and a half bath. Three bedrooms and a full bath are located on the second floor. Basement is partially finished and has another half bath. Wood deck and fenced yard complete this property. See this home today! Available to All Bidders! Built before 1978, Lead Based Paint may be present. Per HUD Appraisal, FHA Financing is available with IE (Insured Escrow), subject to Appraisal. Buyer responsible for payment of transfer tax/ any and all inspections/certifications. HUD Properties are sold AS IS, no repairs allowed prior to closing.
Key facts
- Wood flooring
- Half bath
- Kitchen
Tags
Neighborhood map
What this means for you Summary
Snapshot
- This is a 3-bed/1.0-bath townhouse listed at $140k.
Deal economics
- At list price, monthly cash flow is $461 ($6k/yr) — positive.
- The deal already cash-flows at list — no discount required.
- Meets the 1% rule at list price ($2k rent vs $140k).
- Recommended offer: $131k (6.0% below list) — sets the bar for market timing.
- Cap rate 10.3% vs local median 6.0% in Baltimore — top-decile yield for the area; either an underpriced asset or a hidden risk that comps aren't pricing in. Stress-test before assuming the spread holds.
Location & tenants
- Location reads 76/100 on livability (#90 in MD, #3,396 nationally) — a middle-class / working-renter tenant base. Strengths: amenities A+, commute A+, housing A+; Watch: schools D, crime F.
- Baltimore City Public Schools (urban): math 7% / reading 16% proficiency, ranked #24 of 24 in MD (top 100%) — low school quality limits family demand, transient renter base, plan for 1-2y turnover; 79% free/reduced lunch — lower-income household profile, screen leases tightly.
- Market conditions: Rents rising (+2.4%/yr); 351 active listings in the ZIP; 33 comparable units currently listed for rent nearby; rentals at typical pace (median 24d on market — plan ~3-4 weeks tenant-placement turnaround); 48% of comp listings sitting > 30 days — soft ceiling on asking rent; 1,273 units permitted in Baltimore city in 2024 (1,104 in 5+ unit buildings).
- This rent runs 44% of the median local income ($52k/yr) — at the standard rent-burdened threshold; future hikes will face affordability resistance.
Forward outlook
- Local home prices are declining (-3.0%/yr); year-one equity from $964 of loan paydown is wiped out by about $4k of value loss. Plan a longer hold.
- Baltimore County population projected to shrink 4% by 2050 — rents likely to lag national; underwrite the cash flow, not the appreciation.
- At projected returns (-3.0% appreciation + 2.4% rent growth), your $39k cash investment doubles in ~9 years — after that, you're playing with house money.
Negotiation context
- It's been on market 78 days — a 6% lower offer ($131k) is reasonable based on typical stale-listing flexibility.
- 3 sale attempts since 16y ago; this cycle's ask has dropped $16k (10%) from the opening price — seller is motivated, your offer sets the floor, not the list.
Risks & watch-outs
- Watch-outs: built in 1947 — expect roof / HVAC / electrical / plumbing capex.
- Climate carrying-cost: extreme-heat days projected 7→15/yr by 2055 (HVAC capex compounding) — expect insurance premiums to compound above CPI over the hold.
Questions for the listing agent
- It's been on market 78 days. Have you received any prior offers? Is the seller open to a 6% concession, seller financing, or rate buy-down credit?
- Built in 1947 — when were the roof, HVAC, electrical panel, plumbing, and water heater last replaced?
- Why hasn't it sold? Are there any deal-killer items the seller is aware of (foundation, flood, title, zoning, code violations)?
- Is there a deadline driving the sale (1031 exchange, divorce, estate, relocation)? That informs how much negotiation room exists.
- Schools are D-rated, which usually means shorter tenancies and higher turnover. Who's the typical renter profile here, and what's been the actual vacancy rate?
- Crime grade is F in this area — have there been break-ins, vandalism, or insurance claims at this property in the last 3 years? What carrier currently insures it and at what premium?
- What's the average days-on-market for RENTAL listings here right now (not sales)? A rising rental-DOM trend means longer vacancies and softer asking-rent achievability than the comps imply.
- What's the recent tenant-quality profile in this submarket — average credit score on applications, eviction rate, late-payment / NSF rate, and stable-employment percentage? A property-management company in the area should have these aggregated.
- How much new for-sale + rental construction is in the pipeline within 1–3 miles? Heavy new supply typically softens prices + rents 12–24 months out; constrained supply supports both.
Investment metrics
- 1% rule
- 1.35% ✓
- Cap rate
- 10.25%
- Cash-on-cash
- 14.15%
- DSCR
- 1.63
- GRM
- 6.2
CMA / ARV
- ARV (median comp)
- $224,107
- List price
- $139,500
- Delta
- -37.75%
- Verdict
- UNDERPRICED
- Comps
- 20 within 1.0 mi
Show comp detail 12 sales within ~0.75 mi
| Address | Dist | Beds/Ba | Sqft | Sold | Price | $/sf | Match |
|---|---|---|---|---|---|---|---|
| 5719 Jonquil Ave | 0.19mi | 4/2.0 (+1) | 1,368 (-5%) | 11mo | $245,000 | $179 | 65 |
| 3706 Hayward Ave | 0.34mi | 3/2.5 | 1,504 (+4%) | 8mo | $245,000 | $163 | 64 |
| 5423 Jonquil Ave | 0.18mi | 3/1.0 | 1,260 (-12%) | 8mo | $87,000 | $69 | 64 |
| 5424 Jonquil Ave | 0.16mi | 4/3.5 (+1) | 1,332 (-8%) | 2mo | $200,000 | $150 | 64 |
| 5118 Nelson Ave | 0.56mi | 3/2.0 | 1,386 (-4%) | 3mo | $219,000 | $158 | 61 |
| 4105 Newbern Ave | 0.27mi | 3/2.0 | 1,280 (-11%) | 10mo | $234,900 | $184 | 57 |
| 3916 Hayward Ave | 0.30mi | 3/2.5 | 1,248 (-13%) | 3mo | $237,375 | $190 | 55 |
| 5334 Cuthbert Ave | 0.30mi | 3/2.0 | 1,280 (-11%) | 10mo | $199,000 | $155 | 55 |
| 5312 Gist Ave | 0.26mi | 4/2.5 (+1) | 1,620 (+12%) | 4mo | $240,000 | $148 | 53 |
| 3223 Spaulding Ave | 0.68mi | 4/2.0 (+1) | 1,500 (+4%) | 0mo | $219,900 | $147 | 52 |
| 3800 Hayward Ave | 0.32mi | 3/2.0 | 1,224 (-15%) | 6mo | $80,000 | $65 | 51 |
| 3208 Ingleside Ave | 0.59mi | 3/1.5 | 1,620 (+12%) | 2mo | $225,000 | $139 | 47 |
Match score weights: distance 35% · size 25% · config 20% · recency 20%. Top-matched comps best support the ARV.
Projected returns pro-forma
-3.0% appreciation · 2.41% rent growth · sell at horizon
- IRR
- 3.8%
- Equity multiple
- 1.15×
- Total profit
- $5,681
- Equity at exit
- $20,800
- IRR
- 12.8%
- Equity multiple
- 1.99×
- Total profit
- $38,483
- Equity at exit
- $12,061
Cash invested: $39,060 (down + closing). Projections, not guarantees.
Landlord ↔ Tenant lean methodology
- Overall (CITY)
- 12 Strongly Tenant-Friendly
- State Maryland
- 27 Tenant-Leaning · D+14
- County
- — inherits STATE
- City Baltimore
- 12 Strongly Tenant-Friendly · D+58
ZIP-level market 21215
- Rents YoY
- 2.4%
- Active inventory
- 351
- Price-to-rent
- 6.2×
Monthly cashflow live
- Estimated rent
- $1,878 high interval (Pro) →
- Mortgage (P&I)
- −$732
- Tax from tax record
- −$234 /mo · $2,803/yr
- Insurance
- −$58
- HOA
- −$0
- Vacancy / Maint / Mgmt
- −$394
- Net cashflow
- $461
Break-even live
UW: 25.0% down · 7.5% · 30yr · 1.5% tax · 5.0% vac · 8.0% maint · 8.0% mgmt
Financing live
Cash to close
- Down payment
- $34,875
- Closing costs
- $4,185
- Reserves months
- —
- Total cash needed
- —
Loan-product check · same deal, 3 products live
Conventional
25% down · 7.5% · 30yr
- Down + closing
- —
- Monthly P&I
- —
- Monthly cashflow
- —
- DSCR
- —
- Eligible?
- —
Personal DTI + credit; lowest rate.
DSCR
20% down · 8.5% · 30yr
- Down + closing
- —
- Monthly P&I
- —
- Monthly cashflow
- —
- DSCR
- —
- Eligible?
- —
No personal income docs; deal must DSCR.
Hard money
10% down · 12.0% · 12mo
- Down + closing
- —
- Monthly P&I
- —
- Monthly cashflow
- —
- DSCR
- —
- Eligible?
- —
Short-term bridge; refi at stabilization.
Rent comps 33 comps
| Address | Beds | Baths | Sqft | Rent | $/sqft | DOM | Units | Dist |
|---|---|---|---|---|---|---|---|---|
| 3912 Mortimer Ave Baltimore, MD | 3.0 | 2.0 | 1204 | $2,723 | $2.26 | 43d | 1 | 0.11mi |
| 5343 Nelson Ave Baltimore, MD | 2.0 | 1.0 | 1000 | $1,215 | $1.22 | 24d | 1 | 0.24mi |
| 5340 Maple Ave Baltimore, MD | 2.0 | 1.0 | 1200 | $1,950 | $1.62 | 43d | 1 | 0.58mi |
| 5301 Maple Ave Baltimore, MD | 3.0 | 1.0 | 960 | $1,700 | $1.77 | 43d | 1 | 0.63mi |
| 5000 Litchfield Ave #1 Baltimore, MD | 2.0 | 1.0 | 1100 | $1,100 | $1.00 | 43d | 1 | 0.65mi |
| 3638 Fords Ln Baltimore, MD | 2.0 | 2.0 | 1001 | $1,795 | $1.79 | 43d | 1 | 0.82mi |
| 4828 Beaufort Ave Baltimore, MD | 2.0 | 2.5 | 1200 | $1,850 | $1.54 | 24d | 1 | 0.84mi |
| 4010 Fernhill Ave Unit 2 Baltimore, MD | 2.0 | 1.0 | 1100 | $1,500 | $1.36 | 43d | 1 | 0.85mi |
| 3735 Manchester Ave Baltimore, MD | 2.0 | 1.0 | 1000 | $1,350 | $1.35 | 4d | 1 | 0.86mi |
| 6317 Pearce Ave Baltimore, MD | 2.0 | 2.0 | 1140 | $1,600 | $1.40 | 43d | 1 | 0.91mi |
| 3705 Midheights Rd Baltimore, MD | 3.0 | 1.5 | 1024 | $1,900 | $1.86 | 24d | 1 | 0.91mi |
| 3784 Columbus Dr Baltimore, MD | 4.0 | 2.0 | 1250 | $2,200 | $1.76 | 24d | 1 | 0.94mi |
| 2900 Taney Rd Apt 1A Baltimore, MD | 2.0 | 2.0 | 1200 | $1,600 | $1.33 | 24d | 1 | 0.95mi |
| 3809 Clarks Ln Unit 301 Baltimore, MD | 2.0 | 2.0 | 1057 | $1,600 | $1.51 | 24d | 1 | 0.98mi |
| 5115 Pembridge Ave Baltimore, MD | 3.0 | 2.0 | 1088 | $2,150 | $1.98 | 43d | 1 | 1.00mi |
| 3505 Clarks Ln Unit D2 Baltimore, MD | 3.0 | 2.0 | 1750 | $2,500 | $1.43 | 43d | 1 | 1.02mi |
| 3727 Milford Ave Gwynn Oak, MD | 3.0 | 1.0 | 900 | $1,450 | $1.61 | 43d | 1 | 1.11mi |
| 3607 Labyrinth Rd Baltimore, MD | 1.0–3.0 | 1.0–2.0 | 925 | $2,100 | $2.27 | 19d | 5 | 1.13mi |
| 3807 Bowers Ave Gwynn Oak, MD | 3.0 | 1.5 | 1152 | $2,200 | $1.91 | 43d | 1 | 1.15mi |
| 2432 Everton Rd Unit 2435 A Baltimore, MD | 2.0 | 1.5 | 1000 | $1,500 | $1.50 | 24d | 1 | 1.19mi |
| 3301 Clarks Ln Baltimore, MD | 1.0–2.0 | 1.0 | 801 | $1,345 | $1.68 | 2d | 10 | 1.20mi |
| 6609 Eberle Dr Baltimore, MD | 1.0–3.0 | 1.0–2.0 | 1011 | $1,787 | $1.77 | 2d | 25 | 1.23mi |
| 5801 Western Run Dr Baltimore, MD | 3.0 | 1.0–2.0 | 835 | $1,979 | $2.37 | 2d | 7 | 1.23mi |
| 3617 Mohawk Ave Baltimore, MD | 2.0 | 1.0 | 1000 | $1,595 | $1.59 | 43d | 1 | 1.27mi |
| 3615 Mohawk Ave Gwynn Oak, MD | 2.0 | 1.0 | 1000 | $1,610 | $1.61 | 43d | 1 | 1.27mi |
| 3601 Howard Park Ave Unit 2 Baltimore, MD | 3.0 | 1.0 | 1000 | $1,650 | $1.65 | 43d | 1 | 1.28mi |
| 6310 Greenspring Ave Baltimore, MD | 2.0–3.0 | 1.5–2.0 | 1080 | $1,940 | $1.80 | 3d | 6 | 1.43mi |
| 4230 Towanda Ave Baltimore, MD | 3.0 | 2.0 | 1400 | $1,800 | $1.29 | 18d | 1 | 1.47mi |
| 2310 Sulgrave Ave Unit 3 Baltimore, MD | 2.0 | 1.0 | 978 | $1,700 | $1.74 | 43d | 1 | 1.48mi |
| 6936 Blanche Rd Baltimore, MD | 3.0 | 1.5 | 1410 | $1,800 | $1.28 | 43d | 1 | 1.49mi |
| 3014 Romaric Ct Baltimore, MD | 2.0 | 1.0 | 880 | $1,724 | $1.96 | 4d | 1 | 1.49mi |
| 3014 Romaric Ct Baltimore, MD | 2.0 | 2.0 | 940 | $1,709 | $1.82 | 2d | 1 | 1.49mi |
| 2915 Oakford Ave Baltimore, MD | 3.0 | 2.0 | 1102 | $1,600 | $1.45 | 18d | 1 | 1.49mi |
Listing history 8 events
-
2026-04-30price $139,500 738-char remark
Show marketing remark (738 chars)
HUD Case 241-933900. This townhome on a dead end street is ready for its new owners. Home features a welcoming front porch, wood flooring throughout. First floor has a Living room, dining room, kitchen and a half bath. Three bedrooms and a full bath are located on the second floor. Basement is partially finished and has another half bath. Wood deck and fenced yard complete this property. See this home today! Available to All Bidders! Built before 1978, Lead Based Paint may be present. Per HUD Appraisal, FHA Financing is available with IE (Insured Escrow), subject to Appraisal. Buyer responsible for payment of transfer tax/ any and all inspections/certifications. HUD Properties are sold AS IS, no repairs allowed prior to closing.
-
2026-03-07$155,000 Active 738-char remark
Show marketing remark (738 chars)
HUD Case 241-933900. This townhome on a dead end street is ready for its new owners. Home features a welcoming front porch, wood flooring throughout. First floor has a Living room, dining room, kitchen and a half bath. Three bedrooms and a full bath are located on the second floor. Basement is partially finished and has another half bath. Wood deck and fenced yard complete this property. See this home today! Available to All Bidders! Built before 1978, Lead Based Paint may be present. Per HUD Appraisal, FHA Financing is available with IE (Insured Escrow), subject to Appraisal. Buyer responsible for payment of transfer tax/ any and all inspections/certifications. HUD Properties are sold AS IS, no repairs allowed prior to closing.
-
2025-11-25soldstatus $225,339
-
2010-08-03historical Withdrawn
-
2010-08-03historical
-
2010-05-13price
-
2010-04-05Active
-
2010-04-05$129,000
ⓘ Source: listings_history table (triggers on properties + properties_extension) + one-shot
backfill from property_details.listing_events for pre-trigger history.
Tax reassessment forecast MD · Partial reset (capped growth)
- Current annual tax
- $2,803 · $234/mo
- Projected year-2 tax
- $2,803 · $234/mo
- Expected delta
- $0/yr ($0/mo · 0.0%)
ⓘ Screening estimate from a state-policy table — verify with the county assessor before closing.
Climate risk First Street
- Flood 1/10 Low FEMA zone X (unshaded) · 0% chance over 30 yrs
- Wildfire 1/10 Low
- Heat 7/10 Severe 7 d/yr ≥103°F today · 15 d/yr by 30 yrs out
- Wind 4/10 Moderate 21% chance of damaging wind over 30 yrs
- Air quality 3/10 Moderate 3 unhealthy d/yr today · 4 by 30 yrs out
Nearby sold comps map
Loading sold comps map…
Walkable amenities ~0.75 mi
Loading nearby amenities…
Taxation est. · year 1
- Rental income
- $22,539
- − Mortgage interest
- −$7,814
- − Property taxes
- −$2,803
- − Insurance
- −$698
- − Repairs & maintenance
- −$1,803
- − Management
- −$1,803
- − Depreciation
- −$4,058
- Taxable income
- $3,559
- Est. tax owed @ 24.0%
- −$854
- After-tax cash flow
- $4,672/yr
For passive investors: Depreciation is non-cash, so a rental often shows a tax loss while cash-flowing — sheltering income. Rental losses are passive: they offset passive income freely, and up to $25,000/yr can offset ordinary (W-2) income if you actively participate and your MAGI is under $100k (phasing out to $0 by $150k); unused losses carry forward. On sale, claimed depreciation is recaptured at up to 25%, and gains may owe capital-gains tax (a 1031 exchange can defer both). Figures are a year-1 estimate at your 24.0% rate — not tax advice; consult a CPA.
Schools (NCES district)
- District
- Baltimore City Public Schools
- NCES district ID
- 2400090
- Math proficiency
- 7% ▼ -9.00%
- Reading proficiency
- 16% ▼ -5.00%
- Median HH income
- $42,108
- Composite
- 10.08/100
- National rank
- #9805
- State rank
- #24 of 24 in MD
Livability — Baltimore
- Score
- 76/100
- State rank
- #90
- US rank
- #3396
Category grades
Schools grade is shown separately in the Schools card above.
Census & demographics
- Census place
- Baltimore, MD
- County
- Baltimore City · 558,601 people
- City population
- 588,727
- Metro
- Baltimore-Columbia-Towson, MD
- Population (ZIP)
- 52,229
- Household income
- $51,587
- Rent vs Own
- Severe rent burden
- 3644.0
Population outlook (Baltimore County) Hauer SSP2
- Today (2025)
- 624,249 people
- By 2030
- 621,541 · -0.4%
- By 2040
- 609,756 · -2.3%
- By 2050
- 597,249 · -4.3%
- By 2075
- 552,236 · -11.5%
- By 2100
- 513,934 · -17.7%
Race, ethnicity, and origin ACS 2023
- Neighborhood character
- Predominantly Black (73%)
- Race & ethnicity
- Black 73% White 17% Hispanic / Latino 5% Two or more races 4% Asian 1%
- Common ancestry
- Scotch-Irish 2% Romanian 2% Italian 1%
- Foreign-born
- 9% · Canada, South Korea
- Languages at home
- 91% English-only · Spanish 4% French/Haitian/Cajun 1% Other Indo-European 1%
Political lean MEDSL · Baltimore
- 2024 margin
- Solid D (+73.0) · D 85.2% · R 12.2% · Other 2.6%
- 2008→2024 swing
- -2.5pp toward R · 2008: 75.5pp · 2024: 73.0pp
- All cycles
- 2024: D+73.0 2020: D+76.6 2016: D+74.6 2012: D+76.4 2008: D+75.5
Not yet ingested
- Civics
- —
Market trends
- HPI YoY
- ▼ -318.58%
- Current HPI
- 291.4926
- Rent YoY
- ▲ 2.41%
- Metro
- Baltimore-Columbia-Towson, MD
- State GDP YoY
- ▲ 2.97%
- F500 in state
- 12
Industry mix (Fortune 500 HQ in MD)
| Industry | F500 HQs | Revenue |
|---|---|---|
| Aerospace / Defense | 1 | $71B |
|
||
| Utilities | 1 | $25B |
|
||
| Hotels | 1 | $24B |
|
||
| Consumer Goods | 1 | $7B |
|
||
| Real Estate | 1 | $6B |
|
||
| Chemicals | 1 | $2B |
|
||
Price history
+8.1% since first listed8 events — show timeline
- 2026-04-30 Price Changed $139,500 BRIGHT MLS
- 2026-03-07 Listed $155,000 BRIGHT MLS
- 2025-11-25 Sold (Public Records) $225,339 Public Records
- 2010-08-03 Delisted — MRIS
- 2010-08-03 Listing Removed — BRIGHT MLS
- 2010-05-13 Price Changed — MRIS
- 2010-04-05 Listed — MRIS
- 2010-04-05 Listed $129,000 BRIGHT MLS
Property tax history
-0.8%/yrLatest (2025): $2,803 · +2.8% YoY. Source: county tax records.
Cash-flow waterfall
monthlySold comps — $/sqft
last 12 mo · ≤1 miLoading sold comps…