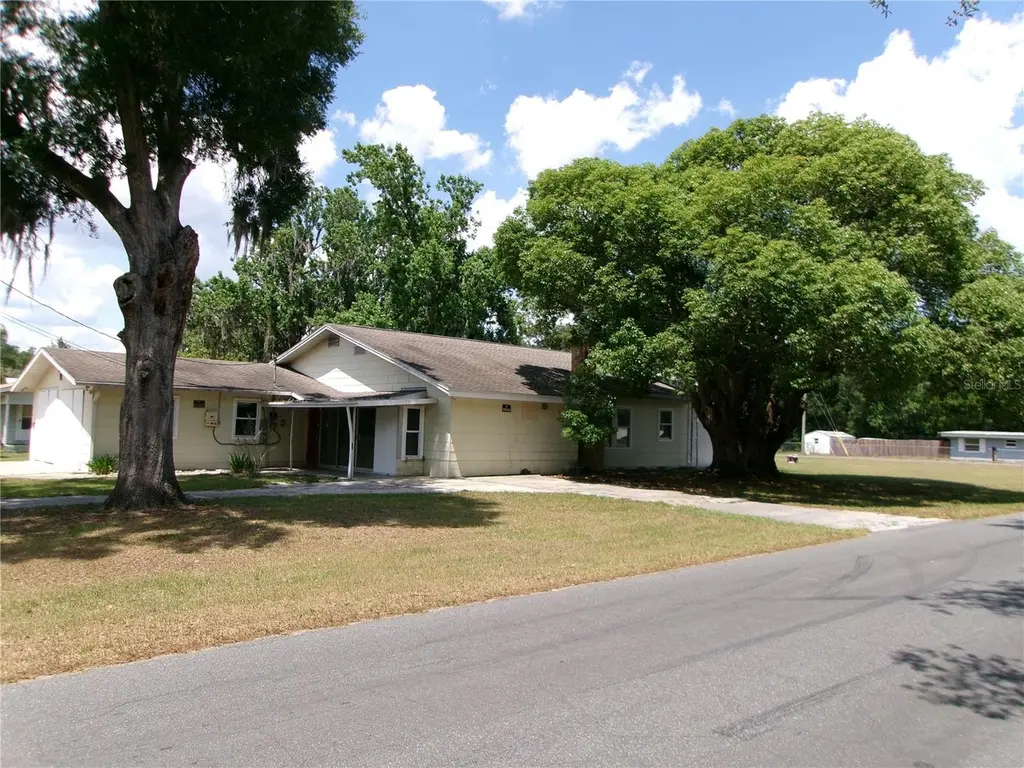
5714 19th St · Zephyrhills, FL
Flood risk 1/10 · Minimal
- FEMA flood zone
- X (unshaded)
- Chance of flooding over 30 yrs
- 0.0%
- Est. flood insurance / yr
- $507 – $1,088
Fire risk 4/10 · Minor
- Est. fire insurance / yr
- $947 – $1,759
Heat risk 9/10 · Severe
- Hot days now (above 108°F)
- 7 days/yr
- Hot days in 30 yrs
- 25 days/yr
Wind risk 9/10 · Severe
- Chance of severe wind over 30 yrs
- 99.0%
Air-quality risk 2/10 · Minimal
- Unhealthy air days now
- 1 days/yr
- Unhealthy air days in 30 yrs
- 2 days/yr
Risk factors via First Street. Map © Google.
Why this score? — see what drove the B- grade
The composite is a weighted blend of 9 inputs, each scored 0–100. Each bar is that input's sub-score; the figure is the points it added to the 100-point composite (weight × sub-score).
- Cash flow +30.0/30.0
- 1% rule +10.0/10.0
- DSCR +10.0/10.0
- ARV discount +7.5/15.0
- Schools +4.3/10.0
- Livability +3.6/5.0
- Condition / age +2.5/5.0
- Rent growth +1.6/5.0
- Appreciation +0.0/10.0
$95,000
🖨 Deal sheet 📄 Offer letter ✓ Due diligence
Listing remarks MLS
Room to Roam! This spacious home is situated on a large corner lot and features 3 bedrooms, 2 bathrooms, with a 2 car garage attached plus a separate detached 2 car garage! This home was originally built in 1957 and through the years has been added onto. There is a spacious front sitting Room, a Storage/Office/Workspace with shelves, two office areas, and a large workspace at the rear. Living/Dining Combo; Living Room has a beautiful Fireplace! The Master Bedroom and Bath are part of the addition and the other two bedroom share the 2nd Bath. Great location in Zephyrhills that is convenient to all services. This is a Home Path Property!
Key facts
- 0.41 acre lot
- 2 garage spots
- Built 1957
Property features AI
Finance
- Other: Property zoned R2
- Financial info: Property listed as a fixer
- HOA & community: No association or HOA fees; No community amenities listed; Pets not allowed
Exterior
- Parking: Attached 2-car garage (26 x 28)
- Utilities: Public sewer available; Public water available; Electricity available; Sewer service available
- Home design: Single-family residence; Residential property; Fixer condition; One story; Faces west
- Construction: Block and frame construction; Shingle roof; Crawlspace and slab foundation; Built on a 0.41-acre lot (approx. 183 x 91)
- Exterior features: Located within city limits; Paved roads; Publicly maintained road
Interior
- Kitchen: No appliances listed
- Bedrooms: 3 bedrooms
- Flooring: Concrete floors
- Bathrooms: 1 full bathroom
- Heating & cooling: No heating listed; No cooling listed
- Interior features: No interior features listed; Living room fireplace
- Laundry & utility: No laundry features listed
Neighborhood map
What this means for you Summary
Snapshot
- This is a 3-bed/1.0-bath single-family listed at $95k.
Deal economics
- At list price, monthly cash flow is $849 ($10k/yr) — positive.
- The deal already cash-flows at list — no discount required.
- Meets the 1% rule at list price ($2k rent vs $95k).
- Cap rate 17.0% vs local median 3.7% in Zephyrhills — top-decile yield for the area; either an underpriced asset or a hidden risk that comps aren't pricing in. Stress-test before assuming the spread holds.
Location & tenants
- Location reads 72/100 on livability (#330 in FL) — a middle-class / working-renter tenant base. Strengths: cost of living A+, housing A+, health & safety A; Watch: crime C-, amenities F, commute F.
- Pasco (suburban): math 50% / reading 52% proficiency, ranked #32 of 73 in FL (top 44%) — acceptable for families but not a draw, mixed tenant base, ~2y average lease.
- Zoned schools: Woodland Elementary School (math 30% / reading 31%, grade F, #1,862 of 2,144 statewide, top 88%, 802 students, 82% FRL); Zephyrhills High School (math 35% / reading 37%, grade F, #359 of 667 statewide, top 55%, 1,656 students, 70% FRL) — zoned schools average 76% FRL vs 48% district-wide (27 pts higher); higher-poverty schools than district average — tighter screening recommended.
- Zoned-school proficiency averages 33% at this address vs 51% district-wide (-18 pts) — the specific schools serving this property underperform the Pasco average; the district grade overstates school quality for this exact location.
- Market conditions: Rents falling (-3.6%/yr); 294 active listings in the ZIP; 8 comparable units currently listed for rent nearby; rentals at typical pace (median 24d on market — plan ~3-4 weeks tenant-placement turnaround); 6,765 units permitted in Pasco County in 2024 (1,250 in 5+ unit buildings).
- At $1,905/mo this rent would consume 46% of the median local household income ($49k/yr) (locally 831% of renters already pay >50% of income on rent) — very limited rent-growth headroom before tenants either downsize or default.
Forward outlook
- Local home prices are declining (-3.0%/yr); year-one equity from $657 of loan paydown is wiped out by about $3k of value loss. Plan a longer hold.
- Pasco County population projected at +29% by 2050 — long-run rental-demand tailwind backs the buy-and-hold thesis.
- At projected returns (-3.0% appreciation + 0.0% rent growth), your $27k cash investment doubles in ~4 years — after that, you're playing with house money.
Negotiation context
- Only 12 days on market — expect competitive offers; lowballing is unlikely to land.
- 7 sale attempts since 10y ago with the ask held roughly flat each time — persistent listings suggest the price (not the market) is what's stuck; bring a comps-based counter.
Risks & watch-outs
- Watch-outs: built in 1957 — expect roof / HVAC / electrical / plumbing capex.
- Climate carrying-cost: severe wind risk, 99% chance of damaging wind over 30y; extreme-heat days projected 7→25/yr by 2055 (HVAC capex compounding) — expect insurance premiums to compound above CPI over the hold.
Questions for the listing agent
- Built in 1957 — when were the roof, HVAC, electrical panel, plumbing, and water heater last replaced?
- Is there a deadline driving the sale (1031 exchange, divorce, estate, relocation)? That informs how much negotiation room exists.
- What's the average days-on-market for RENTAL listings here right now (not sales)? A rising rental-DOM trend means longer vacancies and softer asking-rent achievability than the comps imply.
- What's the recent tenant-quality profile in this submarket — average credit score on applications, eviction rate, late-payment / NSF rate, and stable-employment percentage? A property-management company in the area should have these aggregated.
- How much new for-sale + rental construction is in the pipeline within 1–3 miles? Heavy new supply typically softens prices + rents 12–24 months out; constrained supply supports both.
Investment metrics
- 1% rule
- 2.01% ✓
- Cap rate
- 17.01%
- Cash-on-cash
- 38.29%
- DSCR
- 2.70
- GRM
- 4.2
CMA / ARV
- ARV (on-the-fly)
- $330,672
- Comps found
- 10
Show comp detail 10 sales within ~0.75 mi
| Address | Dist | Beds/Ba | Sqft | Sold | Price | $/sf | Match |
|---|---|---|---|---|---|---|---|
| 5820 20th St | 0.13mi | 4/2.5 (+1) | 1,993 (+0%) | 12mo | $260,000 | $130 | 73 |
| 5945 20th St | 0.26mi | 3/2.0 | 1,743 (-12%) | 3mo | $145,000 | $83 | 60 |
| 38904 5th Ave | 0.35mi | 3/2.5 | 2,164 (+9%) | 9mo | $360,000 | $166 | 56 |
| 5434 16th St | 0.33mi | 4/3.0 (+1) | 2,064 (+4%) | 13mo | $360,000 | $174 | 55 |
| 5412 20th St | 0.31mi | 4/2.5 (+1) | 2,035 (+2%) | 24mo | $340,000 | $167 | 52 |
| 5943 Cypress St | 0.30mi | 3/2.0 | 1,700 (-15%) | 9mo | $250,000 | $147 | 50 |
| 5644 Cypress St | 0.23mi | 3/2.0 | 1,744 (-12%) | 18mo | $365,000 | $209 | 50 |
| 5804 10th St | 0.56mi | 3/1.5 | 2,208 (+11%) | 8mo | $320,000 | $145 | 47 |
| 5836 12th St | 0.45mi | 3/3.0 | 2,069 (+4%) | 22mo | $317,500 | $153 | 46 |
| 39014 Manor Dr | 0.40mi | 4/2.0 (+1) | 1,784 (-10%) | 21mo | $335,000 | $188 | 38 |
Match score weights: distance 35% · size 25% · config 20% · recency 20%. Top-matched comps best support the ARV.
Projected returns pro-forma
-3.0% appreciation · 0.0% rent growth · sell at horizon
- IRR
- 30.9%
- Equity multiple
- 2.24×
- Total profit
- $33,108
- Equity at exit
- $14,165
- IRR
- 36.4%
- Equity multiple
- 3.89×
- Total profit
- $76,973
- Equity at exit
- $8,214
Cash invested: $26,600 (down + closing). Projections, not guarantees.
Landlord ↔ Tenant lean methodology
- Overall (STATE)
- 87 Strongly Landlord-Friendly
- State Florida
- 87 Strongly Landlord-Friendly · R+3
- County
- — inherits STATE
- City
- — inherits STATE
ZIP-level market 33542
- Home prices YoY
- -20.6%
- Rents YoY
- -3.6%
- Active inventory
- 294
- Price-to-rent
- 4.2×
Monthly cashflow live
- Estimated rent
- $1,905 high interval (Pro) →
- Mortgage (P&I)
- −$498
- Tax est. 1.5%
- −$119 /mo · $1,425/yr
- Insurance
- −$40
- HOA
- −$0
- Vacancy / Maint / Mgmt
- −$400
- Net cashflow
- $849
Break-even live
UW: 25.0% down · 7.5% · 30yr · 1.5% tax · 5.0% vac · 8.0% maint · 8.0% mgmt
Financing live
Cash to close
- Down payment
- $23,750
- Closing costs
- $2,850
- Reserves months
- —
- Total cash needed
- —
Loan-product check · same deal, 3 products live
Conventional
25% down · 7.5% · 30yr
- Down + closing
- —
- Monthly P&I
- —
- Monthly cashflow
- —
- DSCR
- —
- Eligible?
- —
Personal DTI + credit; lowest rate.
DSCR
20% down · 8.5% · 30yr
- Down + closing
- —
- Monthly P&I
- —
- Monthly cashflow
- —
- DSCR
- —
- Eligible?
- —
No personal income docs; deal must DSCR.
Hard money
10% down · 12.0% · 12mo
- Down + closing
- —
- Monthly P&I
- —
- Monthly cashflow
- —
- DSCR
- —
- Eligible?
- —
Short-term bridge; refi at stabilization.
Rent comps 8 comps
| Address | Beds | Baths | Sqft | Rent | $/sqft | DOM | Units | Dist |
|---|---|---|---|---|---|---|---|---|
| 5812 17th St Zephyrhills, FL | 3.0 | 2.0 | 1320 | $2,100 | $1.59 | 24d | 1 | 0.17mi |
| 38719 12th Ave Zephyrhills, FL | 2.0 | 1.5 | 1246 | $1,400 | $1.12 | 24d | 1 | 0.32mi |
| 4940 9th St Zephyrhills, FL | 3.0 | 1.0 | 1404 | $1,895 | $1.35 | 24d | 1 | 0.83mi |
| 6136 Pina Colada St Zephyrhills, FL | 3.0 | 2.5 | 1386 | $2,100 | $1.52 | 12d | 1 | 0.92mi |
| 6195 Daerr Ridge St Zephyrhills, FL | 3.0 | 2.5 | 1386 | $2,000 | $1.44 | 17d | 1 | 1.04mi |
| 5143 1st St Zephyrhills, FL | 3.0 | 2.0 | 1436 | $1,750 | $1.22 | 24d | 1 | 1.16mi |
| 37661 Aaralyn Rd Zephyrhills, FL | 3.0 | 2.5 | 1363 | $1,800 | $1.32 | 24d | 1 | 1.42mi |
| 6246 Timberly Ln Zephyrhills, FL | 3.0 | 2.5 | 1363 | $1,900 | $1.39 | 24d | 1 | 1.43mi |
Listing history 9 events
-
2026-06-18days on market $95,000 Active 12 DOM
-
2026-06-17days on market $95,000 Active 11 DOM
-
2026-06-16days on market $95,000 Active 10 DOM
-
2026-06-15days on market $95,000 Active 9 DOM
-
2026-06-13days on market $95,000 Active 7 DOM
-
2026-06-09days on market $95,000 Active 3 DOM
-
2026-06-08days on market $95,000 Active 2 DOM
-
2026-06-07remarks 561-char remark
-
2026-06-07$95,000 Active 1 DOM
ⓘ Source: listings_history table (triggers on properties + properties_extension) + one-shot
backfill from property_details.listing_events for pre-trigger history.
Climate risk First Street
- Flood 1/10 Low FEMA zone X (unshaded) · 0% chance over 30 yrs
- Wildfire 4/10 Moderate
- Heat 9/10 Extreme 7 d/yr ≥108°F today · 25 d/yr by 30 yrs out
- Wind 9/10 Extreme 99% chance of damaging wind over 30 yrs
- Air quality 2/10 Low 1 unhealthy d/yr today · 2 by 30 yrs out
Nearby sold comps map
Loading sold comps map…
Walkable amenities ~0.75 mi
Loading nearby amenities…
Taxation est. · year 1
- Rental income
- $22,865
- − Mortgage interest
- −$5,321
- − Property taxes
- −$1,425
- − Insurance
- −$475
- − Repairs & maintenance
- −$1,829
- − Management
- −$1,829
- − Depreciation
- −$2,764
- Taxable income
- $9,221
- Est. tax owed @ 24.0%
- −$2,213
- After-tax cash flow
- $7,972/yr
For passive investors: Depreciation is non-cash, so a rental often shows a tax loss while cash-flowing — sheltering income. Rental losses are passive: they offset passive income freely, and up to $25,000/yr can offset ordinary (W-2) income if you actively participate and your MAGI is under $100k (phasing out to $0 by $150k); unused losses carry forward. On sale, claimed depreciation is recaptured at up to 25%, and gains may owe capital-gains tax (a 1031 exchange can defer both). Figures are a year-1 estimate at your 24.0% rate — not tax advice; consult a CPA.
Schools (NCES district)
- District
- Pasco
- NCES district ID
- 1201530
- Math proficiency
- 50% ▼ -10.00%
- Reading proficiency
- 52% ▼ -5.00%
- Median HH income
- $45,039
- Composite
- 43.14/100
- National rank
- #3074
- State rank
- #32 of 73 in FL
Livability — Zephyrhills
- Score
- 72/100
- State rank
- #330
- US rank
- #5760
Category grades
Schools grade is shown separately in the Schools card above.
Census & demographics
- Census place
- Zephyrhills, FL
- County
- Pasco County · 524,098 people
- City population
- 48,266
- Metro
- Tampa-St. Petersburg-Clearwater, FL
- Population (ZIP)
- 23,612
- Household income
- $49,316
- Rent vs Own
- Severe rent burden
- 831.0
Population outlook (Pasco County) Hauer SSP2
- Today (2025)
- 570,045 people
- By 2030
- 605,844 · +6.3%
- By 2040
- 674,806 · +18.4%
- By 2050
- 736,022 · +29.1%
- By 2075
- 862,900 · +51.4%
- By 2100
- 906,364 · +59.0%
Race, ethnicity, and origin ACS 2023
- Neighborhood character
- Predominantly White (76%)
- Race & ethnicity
- White 76% Hispanic / Latino 17% Two or more races 8% Black 4% Asian 1%
- Hispanic origin (detail)
- Mexican 2% Puerto Rican 10%
- Common ancestry
- Lithuanian 3% Romanian 2% Iranian 2%
- Foreign-born
- 5% · Canada, Jamaica
- Languages at home
- 86% English-only · Spanish 12% Other Indo-European 1% Russian/Polish/Slavic 1%
Political lean MEDSL · Pasco
- 2024 margin
- Strong R (+25.2) · D 36.9% · R 62.1% · Other 1.0%
- 2008→2024 swing
- -21.6pp toward R · 2008: -3.6pp · 2024: -25.2pp
- All cycles
- 2024: R+25.2 2020: R+20.1 2016: R+21.6 2012: R+6.7 2008: R+3.6
Not yet ingested
- Civics
- —
Market trends
- HPI YoY
- ▼ -81.25%
- Current HPI
- 313.3993
- Rent YoY
- ▼ -3.56%
- Metro
- Tampa-St. Petersburg-Clearwater, FL
- State GDP YoY
- ▲ 3.28%
- F500 in state
- 36
Industry mix (Fortune 500 HQ in FL)
| Industry | F500 HQs | Revenue |
|---|---|---|
| Industrial Technology | 2 | $29B |
|
||
| Insurance | 2 | $17B |
|
||
| Retail | 1 | $60B |
|
||
| Technology Distribution | 1 | $58B |
|
||
| Homebuilding | 1 | $35B |
|
||
| Technology Manufacturing | 1 | $35B |
|
||
Price history
+18.8% since first listed16 events — show timeline
- 2026-06-06 Listed $95,000 Stellar MLS as Distributed by MLS Grid
- 2024-08-01 Pending — Stellar MLS as Distributed by MLS Grid
- 2024-08-01 Listing Removed — Stellar MLS as Distributed by MLS Grid
- 2024-07-30 Relisted — Stellar MLS as Distributed by MLS Grid
- 2024-05-10 Pending — Stellar MLS as Distributed by MLS Grid
- 2024-05-10 Relisted — Stellar MLS as Distributed by MLS Grid
- 2024-03-28 Pending — Stellar MLS as Distributed by MLS Grid
- 2024-03-20 Relisted — Stellar MLS as Distributed by MLS Grid
- 2024-03-11 Pending — Stellar MLS as Distributed by MLS Grid
- 2024-03-11 Relisted — Stellar MLS as Distributed by MLS Grid
- 2024-02-29 Pending — Stellar MLS as Distributed by MLS Grid
- 2024-02-29 Listed $240,000 Stellar MLS as Distributed by MLS Grid
- 2016-09-02 Sold (MLS) $115,500 Stellar MLS as Distributed by MLS Grid
- 2016-06-20 Pending — Stellar MLS as Distributed by MLS Grid
- 2016-05-13 Listed $115,500 Stellar MLS as Distributed by MLS Grid
- 1997-10-23 Sold (Public Records) $80,000 Public Records
Property tax history
+9.6%/yrLatest (2025): $5,835 · +6.6% YoY. Source: county tax records.
Cash-flow waterfall
monthlySold comps — $/sqft
last 12 mo · ≤1 miLoading sold comps…