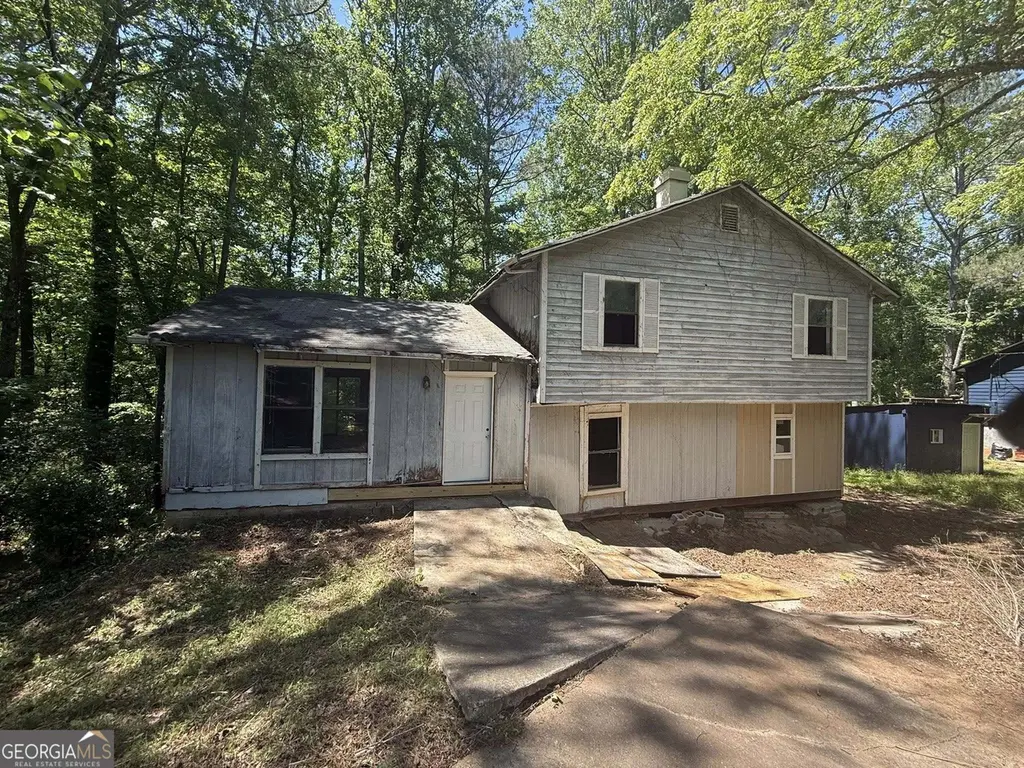
3825 Shane Ct · Stonecrest, GA
Flood risk 1/10 · Minimal
- FEMA flood zone
- X (unshaded)
- Chance of flooding over 30 yrs
- 0.0%
- Est. flood insurance / yr
- $507 – $1,088
Fire risk 3/10 · Minor
- Est. fire insurance / yr
- $963 – $1,789
Heat risk 6/10 · Moderate
- Hot days now (above 105°F)
- 7 days/yr
- Hot days in 30 yrs
- 17 days/yr
Wind risk 6/10 · Moderate
- Chance of severe wind over 30 yrs
- 27.0%
Air-quality risk 5/10 · Moderate
- Unhealthy air days now
- 7 days/yr
- Unhealthy air days in 30 yrs
- 10 days/yr
Risk factors via First Street. Map © Google.
Why this score? — see what drove the B- grade
The composite is a weighted blend of 9 inputs, each scored 0–100. Each bar is that input's sub-score; the figure is the points it added to the 100-point composite (weight × sub-score).
- Cash flow +30.0/30.0
- 1% rule +10.0/10.0
- DSCR +10.0/10.0
- ARV discount +7.5/15.0
- Rent growth +3.6/5.0
- Livability +2.5/5.0
- Condition / age +2.5/5.0
- Schools +2.1/10.0
- Appreciation +0.0/10.0
$65,000
🖨 Deal sheet 📄 Offer letter ✓ Due diligence
Listing remarks
PRICE REDUCED FOR QUICK CASH SALE ONLY. TITLE IS CLEAR
Key facts
- 0.62 acre lot
- Garage
- Built 1986
Property features AI
Finance
- Other: Lot size about 0.62 acre; Subdivision: Chimney Ridge; Address: 3825 Shane Court, Ellenwood, GA 30294
- HOA & community: No HOA
Exterior
- Parking: Attached garage; Attached parking
- Utilities: Public water; Public sewer; No additional utilities listed
- Home design: Single-family residence (house); Two levels; Built in 1986; Fixer condition
- Construction: Wood siding and other construction materials; Composition roof; Total building area listed as 1,750 (public records)
- Exterior features: Cul-de-sac lot
Interior
- Kitchen: No appliances listed
- Bedrooms: 3 bedrooms
- Flooring: Other (unspecified)
- Bathrooms: 2 full bathrooms
- Heating & cooling: Central heating; Central air conditioning
- Interior features: Vaulted ceilings; Bonus room; Den; Crawl space basement; One fireplace
- Laundry & utility: Laundry: Other (unspecified)
Neighborhood map
What this means for you Summary
Snapshot
- This is a 3-bed/2.0-bath single-family listed at $65k.
Deal economics
- At list price, monthly cash flow is $1k ($15k/yr) — positive.
- The deal already cash-flows at list — no discount required.
- Meets the 1% rule at list price ($2k rent vs $65k).
- Recommended offer: $63k (3.0% below list) — sets the bar for market timing.
- Cap rate 28.7% vs local median 5.1% in Stonecrest — top-decile yield for the area; either an underpriced asset or a hidden risk that comps aren't pricing in. Stress-test before assuming the spread holds.
Location & tenants
- Location reads: area grade B — affects rentability + tenant quality, not the cash-flow math above.
- Dekalb County (suburban): math 19% / reading 28% proficiency, ranked #125 of 174 in GA (top 72%) — low school quality limits family demand, transient renter base, plan for 1-2y turnover; 68% free/reduced lunch — lower-income household profile, screen leases tightly.
- Zoned schools: Chapel Hill Elementary School (math 5% / reading 15%, grade F, #1,076 of 1,228 statewide, top 89%, 559 students, 100% FRL); Salem Middle School (math 5% / reading 16%, grade F, #429 of 470 statewide, top 91%, 988 students, 100% FRL); Martin Luther King- Jr. High School (math 8% / reading 22%, grade F, #297 of 424 statewide, top 74%, 1,440 students, 100% FRL) — zoned schools average 100% FRL vs 68% district-wide (32 pts higher); higher-poverty schools than district average — tighter screening recommended.
- Market conditions: Rents rising fast (+4.6%/yr); 244 active listings in the ZIP; 34 comparable units currently listed for rent nearby; rentals lingering (median 44d on market — plan ~5-8 weeks vacancy on turnover, expect pricing pressure); 50% of comp listings sitting > 30 days — soft ceiling on asking rent; solid renter incomes; 1,240 units permitted in DeKalb County in 2024 (385 in 5+ unit buildings).
- This rent runs 32% of the median local income ($80k/yr) — at the standard rent-burdened threshold; future hikes will face affordability resistance.
Forward outlook
- Local home prices are declining (-3.0%/yr); year-one equity from $449 of loan paydown is wiped out by about $2k of value loss. Plan a longer hold.
- DeKalb County population projected at +28% by 2050 — long-run rental-demand tailwind backs the buy-and-hold thesis.
- At projected returns (-3.0% appreciation + 4.6% rent growth), your $18k cash investment doubles in ~2 years — after that, you're playing with house money.
Negotiation context
- It's been on market 37 days — a 3% lower offer ($63k) is reasonable based on typical stale-listing flexibility.
- 15 sale attempts since 16y ago; this cycle's ask has dropped $24k (27%) from the opening price — seller is motivated, your offer sets the floor, not the list.
- Current owner paid $2k; list at $65k implies a 3150% gain — meaningful room to come down on a strong offer.
Risks & watch-outs
- Climate carrying-cost: major wind risk, 27% chance of damaging wind over 30y; extreme-heat days projected 7→17/yr by 2055 (HVAC capex compounding) — expect insurance premiums to compound above CPI over the hold.
Questions for the listing agent
- It's been on market 37 days. Have you received any prior offers? Is the seller open to a 3% concession, seller financing, or rate buy-down credit?
- Is there a deadline driving the sale (1031 exchange, divorce, estate, relocation)? That informs how much negotiation room exists.
- What's the average days-on-market for RENTAL listings here right now (not sales)? A rising rental-DOM trend means longer vacancies and softer asking-rent achievability than the comps imply.
- What's the recent tenant-quality profile in this submarket — average credit score on applications, eviction rate, late-payment / NSF rate, and stable-employment percentage? A property-management company in the area should have these aggregated.
- How much new for-sale + rental construction is in the pipeline within 1–3 miles? Heavy new supply typically softens prices + rents 12–24 months out; constrained supply supports both.
Investment metrics
- 1% rule
- 3.24% ✓
- Cap rate
- 28.71%
- Cash-on-cash
- 80.07%
- DSCR
- 4.56
- GRM
- 2.6
CMA / ARV
- ARV (median comp)
- $262,770
- List price
- $65,000
- Delta
- -75.26%
- Verdict
- UNDERPRICED
- Comps
- 20 within 1.0 mi
Show comp detail 12 sales within ~0.75 mi
| Address | Dist | Beds/Ba | Sqft | Sold | Price | $/sf | Match |
|---|---|---|---|---|---|---|---|
| 4030 Shane Trl | 0.12mi | 3/— | 1,572 (-4%) | 4mo | $234,000 | $149 | 85 |
| 3723 Chimney Ridge Ct | 0.23mi | 3/2.0 | 1,570 (-4%) | 4mo | $240,000 | $153 | 80 |
| 4050 Daron Ct | 0.16mi | 4/2.5 (+1) | 1,662 (+2%) | 6mo | $265,000 | $159 | 77 |
| 3809 Chimney Ridge Ct | 0.14mi | 3/2.0 | 1,419 (-13%) | 1mo | $245,000 | $173 | 71 |
| 3851 Natalie Way | 0.15mi | 3/2.0 | 1,478 (-9%) | 8mo | $175,000 | $118 | 71 |
| 4035 Shane Trl | 0.08mi | 4/3.0 (+1) | 1,838 (+13%) | 3mo | $275,000 | $150 | 64 |
| 3951 Mcgill Dr | 0.36mi | 4/3.0 (+1) | 1,705 (+5%) | 6mo | $198,000 | $116 | 62 |
| 3679 Seton Hall Way | 0.74mi | 3/2.5 | 1,642 (+1%) | 9mo | $275,000 | $167 | 55 |
| 3683 Brown Dr | 0.74mi | 3/2.5 | 1,708 (+5%) | 3mo | $238,500 | $140 | 53 |
| 3958 River Rd | 0.72mi | 2/2.0 (-1) | 1,548 (-5%) | 5mo | $275,000 | $178 | 48 |
| 3800 Skidmore Dr | 0.55mi | 4/3.0 (+1) | 1,775 (+9%) | 8mo | $280,000 | $158 | 44 |
| 3868 Brookview Pt | 0.65mi | 3/2.5 | 1,860 (+14%) | 1mo | $325,000 | $175 | 43 |
Match score weights: distance 35% · size 25% · config 20% · recency 20%. Top-matched comps best support the ARV.
Projected returns pro-forma
-3.0% appreciation · 4.56% rent growth · sell at horizon
- IRR
- 82.0%
- Equity multiple
- 4.86×
- Total profit
- $70,197
- Equity at exit
- $9,692
- IRR
- 85.7%
- Equity multiple
- 10.62×
- Total profit
- $175,064
- Equity at exit
- $5,620
Cash invested: $18,200 (down + closing). Projections, not guarantees.
Landlord ↔ Tenant lean methodology
- Overall (STATE)
- 90 Strongly Landlord-Friendly
- State Georgia
- 90 Strongly Landlord-Friendly · R+3
- County
- — inherits STATE
- City
- — inherits STATE
ZIP-level market 30294
- Home prices YoY
- -25.0%
- Rents YoY
- 4.6%
- Active inventory
- 244
- Price-to-rent
- 2.6×
Monthly cashflow live
- Estimated rent
- $2,106 high interval (Pro) →
- Mortgage (P&I)
- −$341
- Tax est. 1.5%
- −$81 /mo · $975/yr
- Insurance
- −$27
- HOA
- −$0
- Vacancy / Maint / Mgmt
- −$442
- Net cashflow
- $1,214
Break-even live
UW: 25.0% down · 7.5% · 30yr · 1.5% tax · 5.0% vac · 8.0% maint · 8.0% mgmt
Financing live
Cash to close
- Down payment
- $16,250
- Closing costs
- $1,950
- Reserves months
- —
- Total cash needed
- —
Loan-product check · same deal, 3 products live
Conventional
25% down · 7.5% · 30yr
- Down + closing
- —
- Monthly P&I
- —
- Monthly cashflow
- —
- DSCR
- —
- Eligible?
- —
Personal DTI + credit; lowest rate.
DSCR
20% down · 8.5% · 30yr
- Down + closing
- —
- Monthly P&I
- —
- Monthly cashflow
- —
- DSCR
- —
- Eligible?
- —
No personal income docs; deal must DSCR.
Hard money
10% down · 12.0% · 12mo
- Down + closing
- —
- Monthly P&I
- —
- Monthly cashflow
- —
- DSCR
- —
- Eligible?
- —
Short-term bridge; refi at stabilization.
Rent comps 34 comps
| Address | Beds | Baths | Sqft | Rent | $/sqft | DOM | Units | Dist |
|---|---|---|---|---|---|---|---|---|
| 4061 Faron Ct Ellenwood, GA | 4.0 | 2.0 | 2184 | $2,195 | $1.01 | 12d | 1 | 0.21mi |
| 4068 Day Trl S Ellenwood, GA | 4.0 | 2.0 | 1836 | $2,100 | $1.14 | 4d | 1 | 0.26mi |
| 3924 Chimney Ridge Ct Ellenwood, GA | 3.0 | 2.0 | 1252 | $2,000 | $1.60 | 43d | 1 | 0.32mi |
| 4229 Catalpa Park Ellenwood, GA | 3.0 | 2.0 | 1280 | $1,675 | $1.31 | 43d | 1 | 0.69mi |
| 3821 River Rd Ellenwood, GA | 3.0 | 2.0 | 1455 | $2,195 | $1.51 | 43d | 1 | 0.70mi |
| 4254 Catalpa Park Ellenwood, GA | 3.0 | 2.0 | 2048 | $1,605 | $0.78 | 43d | 1 | 0.72mi |
| 3856 Radcliffe Blvd Decatur, GA | 4.0 | 3.0 | 1968 | $1,995 | $1.01 | 43d | 1 | 0.78mi |
| 3604 Spring Trce Decatur, GA | 3.0 | 2.5 | 1806 | $1,595 | $0.88 | 43d | 1 | 0.90mi |
| 3607 Brycewood Dr Decatur, GA | 3.0 | 2.5 | 1500 | $2,150 | $1.43 | 24d | 1 | 1.00mi |
| 3607 Brycewood Dr Decatur, GA | 3.0 | 3.0 | 1515 | $2,150 | $1.42 | 43d | 1 | 1.00mi |
| 100 Woodberry Pl Decatur, GA | 1.0–3.0 | 1.0–2.0 | 1106 | $1,761 | $1.59 | 1d | 18 | 1.00mi |
| 3605 Brycewood Dr Decatur, GA | 3.0 | 3.0 | 1515 | $2,150 | $1.42 | 43d | 1 | 1.00mi |
| 3605 Brycewood Dr Decatur, GA | 3.0 | 2.5 | 1500 | $2,150 | $1.43 | 24d | 1 | 1.00mi |
| 3601 Brycewood Dr Decatur, GA | 3.0 | 2.5 | 1500 | $2,150 | $1.43 | 24d | 1 | 1.01mi |
| 3601 Brycewood Dr Decatur, GA | 3.0 | 2.5 | 1515 | $2,150 | $1.42 | 43d | 1 | 1.01mi |
| 3303 Homeward Trl Ellenwood, GA | 3.0 | 2.0 | 1456 | $1,799 | $1.24 | 22d | 1 | 1.03mi |
| 3583 Brycewood Dr Decatur, GA | 3.0 | 2.5 | 1461 | $2,150 | $1.47 | 43d | 1 | 1.04mi |
| 3725 Patti Pkwy Decatur, GA | 4.0 | 2.0 | 1914 | $2,220 | $1.16 | 43d | 1 | 1.05mi |
| 3577 Brycewood Dr Decatur, GA | 3.0 | 2.5 | 1501 | $1,950 | $1.30 | 43d | 1 | 1.05mi |
| 4210 Waldrop Hills Ter Decatur, GA | 3.0 | 2.5 | 1200 | $1,666 | $1.39 | 43d | 1 | 1.07mi |
| 3428 Homeward Trl Ellenwood, GA | 3.0 | 2.0 | 1242 | $1,795 | $1.45 | 12d | 1 | 1.07mi |
| 3407 Homeward Trl Ellenwood, GA | 3.0 | 2.0 | 1512 | $1,695 | $1.12 | 43d | 1 | 1.08mi |
| 4060 Waldrop Hills Dr Decatur, GA | 3.0 | 2.5 | 1696 | $1,920 | $1.13 | 15d | 1 | 1.08mi |
| 3378 Homeward Trl Ellenwood, GA | 3.0 | 2.0 | 1176 | $1,695 | $1.44 | 20d | 1 | 1.13mi |
| 3515 Shepherds Path Decatur, GA | 3.0 | 2.0 | 1279 | $1,495 | $1.17 | 43d | 1 | 1.14mi |
| 3477 Shepherds Path Decatur, GA | 2.0 | 2.0 | 1200 | $1,200 | $1.00 | 43d | 1 | 1.19mi |
| 3342 Crestview Ct Ellenwood, GA | 3.0 | 2.0 | 1290 | $1,601 | $1.24 | 5d | 1 | 1.22mi |
| 3335 Crestview Ct Ellenwood, GA | 3.0 | 2.5 | 1492 | $1,650 | $1.11 | 24d | 1 | 1.26mi |
| 3716 Cress Way Dr Decatur, GA | 4.0 | 2.5 | 1669 | $2,185 | $1.31 | 5d | 1 | 1.29mi |
| 4402 Davana Dr Ellenwood, GA | 3.0 | 1.0 | 1056 | $1,608 | $1.52 | 24d | 1 | 1.30mi |
| 3346 Clevemont Way Ellenwood, GA | 3.0 | 2.0 | 2216 | $1,886 | $0.85 | 5d | 1 | 1.34mi |
| 3328 River Run Trl Decatur, GA | 3.0 | 2.0 | 1665 | $1,981 | $1.19 | 1d | 1 | 1.37mi |
| 3554 Waldrop Rd Decatur, GA | 3.0 | 2.5 | 1646 | $2,135 | $1.30 | 3d | 1 | 1.49mi |
| 3733 Waldrop Hills Dr Decatur, GA | 3.0 | 2.5 | 1646 | $2,023 | $1.23 | 43d | 1 | 1.49mi |
Listing history 50 events
-
2026-06-18days on market $65,000 Active 37 DOM
-
2026-06-17statusdays on market $65,000 Active 36 DOM
-
2026-06-16days on market $65,000 Price Change 35 DOM
-
2026-06-15pricestatusdays on market $65,000 Price Change 34 DOM
-
2026-06-13days on market $69,000 Active 32 DOM
-
2026-06-04days on market $69,000 Active 28 DOM
-
2026-06-03statusdays on market $69,000 Active 27 DOM
-
2026-06-02days on market $69,000 Back On Market 26 DOM
-
2026-06-01days on market $69,000 Back On Market 25 DOM
-
2026-06-01status $69,000 Back On Market 24 DOM
-
2026-05-18price $69,000 73-char remark
-
2026-05-18status Back On Market 73-char remark
-
2026-05-15historical 73-char remark
-
2026-05-09price $75,000 73-char remark
-
2026-05-07price $79,000 73-char remark
-
2026-05-05price $87,500 73-char remark
-
2026-04-28$89,000 New 73-char remark
-
2026-04-24historical
-
2026-04-22price $94,700
-
2026-04-16price $94,800
-
2026-04-14price $94,900
-
2026-02-09$95,000 Back On Market
-
2025-12-13status Back On Market
-
2025-12-13historical
-
2025-12-12historical
-
2025-12-06status Back On Market
-
2025-12-05historical
-
2025-11-28$105,000 New
-
2025-11-14historical
-
2011-02-04historical
-
2011-02-03status Pending
-
2011-01-19soldstatus $2,000 Sold
-
2011-01-13status Active
-
2010-12-31historical
-
2010-11-13price $13,500
-
2010-11-12price $13,500
-
2010-10-08status Active
-
2010-09-15status Pending
-
2010-08-05status Active
-
2010-08-01historical
-
2010-06-21status Active
-
2010-06-14status Pending
-
2010-04-02price $16,200
-
2010-04-01price $16,200
-
2010-02-19status Active
-
2010-02-19historical
-
2010-01-21status Active
-
2009-12-17historical
-
1997-10-28soldstatus $73,500
-
1987-10-30soldstatus $59,900
ⓘ Source: listings_history table (triggers on properties + properties_extension) + one-shot
backfill from property_details.listing_events for pre-trigger history.
Climate risk First Street
- Flood 1/10 Low FEMA zone X (unshaded) · 0% chance over 30 yrs
- Wildfire 3/10 Moderate
- Heat 6/10 Major 7 d/yr ≥105°F today · 17 d/yr by 30 yrs out
- Wind 6/10 Major 27% chance of damaging wind over 30 yrs
- Air quality 5/10 Major 7 unhealthy d/yr today · 10 by 30 yrs out
Nearby sold comps map
Loading sold comps map…
Walkable amenities ~0.75 mi
Loading nearby amenities…
Taxation est. · year 1
- Rental income
- $25,269
- − Mortgage interest
- −$3,641
- − Property taxes
- −$975
- − Insurance
- −$325
- − Repairs & maintenance
- −$2,022
- − Management
- −$2,022
- − Depreciation
- −$1,891
- Taxable income
- $14,394
- Est. tax owed @ 24.0%
- −$3,455
- After-tax cash flow
- $11,117/yr
For passive investors: Depreciation is non-cash, so a rental often shows a tax loss while cash-flowing — sheltering income. Rental losses are passive: they offset passive income freely, and up to $25,000/yr can offset ordinary (W-2) income if you actively participate and your MAGI is under $100k (phasing out to $0 by $150k); unused losses carry forward. On sale, claimed depreciation is recaptured at up to 25%, and gains may owe capital-gains tax (a 1031 exchange can defer both). Figures are a year-1 estimate at your 24.0% rate — not tax advice; consult a CPA.
Schools (NCES district)
- District
- Dekalb County
- NCES district ID
- 1301740
- Math proficiency
- 19% ▼ -12.00%
- Reading proficiency
- 28% ▼ -7.00%
- Median HH income
- $51,448
- Composite
- 20.92/100
- National rank
- #8482
- State rank
- #125 of 174 in GA
Livability — Stonecrest
No livability data for this city. (Only ~50 U.S. cities are tracked.)
Census & demographics
- County
- Henry County · 316,359 people
- City population
- 106,165
- Metro
- Atlanta-Sandy Springs-Alpharetta, GA
- Population (ZIP)
- 41,983
- Household income
- $79,762
- Rent vs Own
- Severe rent burden
- 864.0
Population outlook (DeKalb County) Hauer SSP2
- Today (2025)
- 839,977 people
- By 2030
- 891,768 · +6.2%
- By 2040
- 988,894 · +17.7%
- By 2050
- 1,074,583 · +27.9%
- By 2075
- 1,245,026 · +48.2%
- By 2100
- 1,303,135 · +55.1%
Race, ethnicity, and origin ACS 2023
- Neighborhood character
- Predominantly Black (84%)
- Race & ethnicity
- Black 84% Hispanic / Latino 7% Two or more races 6% White 6% Asian 1%
- Hispanic origin (detail)
- Mexican 6%
- Common ancestry
- Hispanic 1%
- Foreign-born
- 7% · Canada, Vietnam
- Languages at home
- 91% English-only · Spanish 6% Vietnamese 1% French/Haitian/Cajun 1%
Political lean MEDSL · DeKalb
- 2024 margin
- Solid D (+64.8) · D 81.9% · R 17.1% · Other 1.0%
- 2008→2024 swing
- +6.1pp toward D · 2008: 58.6pp · 2024: 64.8pp
- All cycles
- 2024: D+64.8 2020: D+67.4 2016: D+64.8 2012: D+56.8 2008: D+58.6
Not yet ingested
- Civics
- —
Market trends
- HPI YoY
- ▼ -70.99%
- Current HPI
- 213.1999
- Rent YoY
- ▲ 4.56%
- Metro
- Atlanta-Sandy Springs-Alpharetta, GA
- State GDP YoY
- ▲ 2.66%
- F500 in state
- 28
Industry mix (Fortune 500 HQ in GA)
| Industry | F500 HQs | Revenue |
|---|---|---|
| Paper / Packaging | 2 | $29B |
|
||
| Retail | 1 | $160B |
|
||
| Transportation / Logistics | 1 | $91B |
|
||
| Airlines | 1 | $62B |
|
||
| Consumer Goods | 1 | $47B |
|
||
| Utilities | 1 | $25B |
|
||
Price history
+614.3% since first listed48 events — show timeline
- 2026-06-15 Price Changed $65,000 GAMLS
- 2026-06-10 Relisted — GAMLS
- 2026-06-05 Listing Removed — GAMLS
- 2026-06-01 Relisted — GAMLS
- 2026-05-29 Listing Removed — GAMLS
- 2026-05-26 Relisted — GAMLS
- 2026-05-22 Listing Removed — GAMLS
- 2026-05-18 Price Changed $69,000 GAMLS
- 2026-05-18 Relisted — GAMLS
- 2026-05-15 Listing Removed — GAMLS
- 2026-05-09 Price Changed $75,000 GAMLS
- 2026-05-07 Price Changed $79,000 GAMLS
- 2026-05-05 Price Changed $87,500 GAMLS
- 2026-04-28 Listed $89,000 GAMLS
- 2026-04-24 Listing Removed — GAMLS
- 2026-04-22 Price Changed $94,700 GAMLS
- 2026-04-16 Price Changed $94,800 GAMLS
- 2026-04-14 Price Changed $94,900 GAMLS
- 2026-02-09 Listed $95,000 GAMLS
- 2025-12-13 Relisted — GAMLS
- 2025-12-13 Listing Removed — GAMLS
- 2025-12-12 Listing Removed — GAMLS
- 2025-12-06 Relisted — GAMLS
- 2025-12-05 Listing Removed — GAMLS
- 2025-11-28 Listed $105,000 GAMLS
- 2025-11-14 Coming Soon — GAMLS
- 2011-02-04 Listing Removed — FMLS
- 2011-02-03 Pending — FMLS
- 2011-01-19 Sold (MLS) $2,000 FMLS
- 2011-01-13 Relisted — FMLS
- 2010-12-31 Listing Removed — FMLS
- 2010-11-13 Price Changed $13,500 GAMLS
- 2010-11-12 Price Changed $13,500 FMLS
- 2010-10-08 Relisted — FMLS
- 2010-09-15 Pending — FMLS
- 2010-08-05 Relisted — FMLS
- 2010-08-01 Listing Removed — FMLS
- 2010-06-21 Relisted — FMLS
- 2010-06-14 Pending — FMLS
- 2010-04-02 Price Changed $16,200 GAMLS
- 2010-04-01 Price Changed $16,200 FMLS
- 2010-02-19 Relisted — FMLS
- 2010-02-19 Listing Removed — FMLS
- 2010-01-21 Relisted — FMLS
- 2009-12-17 Listing Removed — FMLS
- 1997-10-28 Sold (Public Records) $73,500 Public Records
- 1987-10-30 Sold (Public Records) $59,900 Public Records
- 1985-12-01 Sold (Public Records) $9,100 Public Records
Property tax history
+7.4%/yrLatest (2025): $3,762 · +1.1% YoY. Source: county tax records.
Cash-flow waterfall
monthlySold comps — $/sqft
last 12 mo · ≤1 miLoading sold comps…