144 Short Jay St · Woodbury, GA
Flood risk 1/10 · Minimal
- FEMA flood zone
- X (unshaded)
- Chance of flooding over 30 yrs
- 0.0%
- Est. flood insurance / yr
- $507 – $1,088
Fire risk 4/10 · Minor
- Est. fire insurance / yr
- $963 – $1,789
Heat risk 6/10 · Moderate
- Hot days now (above 106°F)
- 7 days/yr
- Hot days in 30 yrs
- 18 days/yr
Wind risk 6/10 · Moderate
- Chance of severe wind over 30 yrs
- 57.0%
Air-quality risk 2/10 · Minimal
- Unhealthy air days now
- 2 days/yr
- Unhealthy air days in 30 yrs
- 2 days/yr
Risk factors via First Street. Map © Google.
Why this score? — see what drove the C- grade
The composite is a weighted blend of 9 inputs, each scored 0–100. Each bar is that input's sub-score; the figure is the points it added to the 100-point composite (weight × sub-score).
- Cash flow +15.0/30.0
- Appreciation +10.0/10.0
- ARV discount +7.5/15.0
- 1% rule +5.0/10.0
- DSCR +5.0/10.0
- Livability +2.9/5.0
- Rent growth +2.5/5.0
- Condition / age +2.5/5.0
- Schools +1.7/10.0
$39,999
🖨 Deal sheet (PDF) 📄 Offer letter ✓ Due diligence
Listing remarks
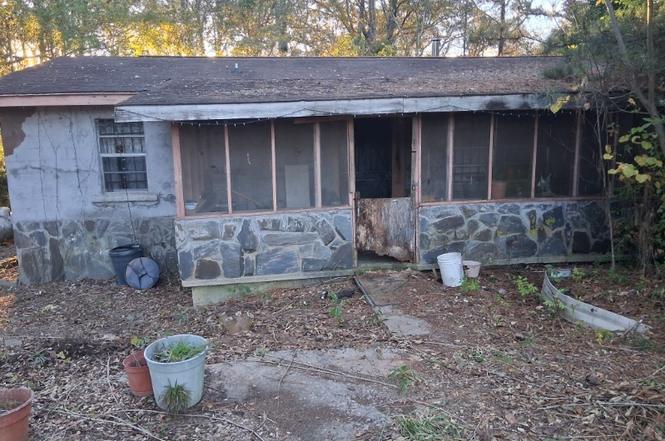
Investor Special in the heart of Woodbury! This solid 3-bedroom, 2-bath home offers approximately 1,329 square feet and presents an excellent opportunity for investors, flippers, or buy-and-hold landlords looking to add value. Situated on a spacious lot, the property features a functional floor plan, durable construction, and strong upside potential with a full renovation. The home is currently vacant and ready for immediate improvements. With renovated homes and rental demand continuing throughout the area, this property offers the chance to create significant equity through updates and repairs. Whether you're looking for your next fix-and-flip project or a long-term rental investment, thi
Key facts
- Near schools
- Durable construction
- Spacious lot
Tags
Property features AI
Finance
- Financial info: Property listed as fixer
- HOA & community: No HOA; No association fee inclusions
Exterior
- Parking: Parking pad (open parking)
- Utilities: Private water; Septic tank; No utilities listed
- Home design: Single-family residence (house); One story
- Construction: Built in 1987; Block and brick construction; Composition roof
- Exterior features: Private lot
Interior
- Kitchen: No appliances listed
- Bedrooms: 3 bedrooms on the main level
- Flooring: Other flooring
- Bathrooms: 2 full bathrooms on the main level
- Heating & cooling: No heating; No cooling
- Interior features: Other interior features; One-level layout; Crawl space basement
- Laundry & utility: Laundry closet
Neighborhood map
What this means for you Summary
Snapshot
- This is a 3-bed/2.0-bath single-family listed at $40k.
Deal economics
- At list price, monthly cash flow is $1k ($17k/yr) — positive.
- The deal already cash-flows at list — no discount required.
- Meets the 1% rule at list price ($2k rent vs $40k).
- Recommended offer: $39k (1.5% below list) — sets the bar for market timing.
Location & tenants
- Location reads 58/100 on livability (#431 in GA) — a working-class tenant base; expect higher turnover. Strengths: cost of living A+, housing A+, crime A; Watch: amenities F, commute F, employment F.
- Meriwether County (rural): math 18% / reading 22% proficiency, ranked #144 of 174 in GA (top 83%) — low school quality limits family demand, transient renter base, plan for 1-2y turnover; 71% free/reduced lunch — lower-income household profile, screen leases tightly.
- Zoned schools: Unity Elementary School (Pk-5) (math 12% / reading 12%, grade F, #1,041 of 1,228 statewide, top 87%, 427 students, 96% FRL); Manchester Middle School (math 20% / reading 26%, grade F, #321 of 470 statewide, top 69%, 313 students, 96% FRL); Manchester High School (math 24% / reading 37%, grade F, #128 of 424 statewide, top 30%, 403 students, 96% FRL) — zoned schools average 96% FRL vs 71% district-wide (26 pts higher); higher-poverty schools than district average — tighter screening recommended.
- Market conditions: 22 active listings in the ZIP; 180 units permitted in Meriwether County in 2024 (0 in 5+ unit buildings).
Forward outlook
- In year one you build about $4k of equity ($276 loan paydown + $4k appreciation (10.0% local appreciation)).
- Meriwether County population projected at -28% by 2050 — secular population decline; favor cash flow + early exit over multi-decade hold.
- At projected returns (10.0% appreciation + 3.0% rent growth), your $11k cash investment doubles in ~1 year — after that, you're playing with house money.
- By year 7, paydown + projected appreciation supports a ~$31k cash-out refi (75% LTV) — recoverable capital for the next deal without selling this one.
Negotiation context
- It's been on market 18 days — a 2% lower offer ($39k) is reasonable based on typical stale-listing flexibility.
Risks & watch-outs
- Climate carrying-cost: major wind risk, 57% chance of damaging wind over 30y; extreme-heat days projected 7→18/yr by 2055 (HVAC capex compounding) — expect insurance premiums to compound above CPI over the hold.
Questions for the listing agent
- Is there a deadline driving the sale (1031 exchange, divorce, estate, relocation)? That informs how much negotiation room exists.
- Schools are F-rated, which usually means shorter tenancies and higher turnover. Who's the typical renter profile here, and what's been the actual vacancy rate?
- What's the average days-on-market for RENTAL listings here right now (not sales)? A rising rental-DOM trend means longer vacancies and softer asking-rent achievability than the comps imply.
- What's the recent tenant-quality profile in this submarket — average credit score on applications, eviction rate, late-payment / NSF rate, and stable-employment percentage? A property-management company in the area should have these aggregated.
- How much new for-sale + rental construction is in the pipeline within 1–3 miles? Heavy new supply typically softens prices + rents 12–24 months out; constrained supply supports both.
Investment metrics
- 1% rule
- 5.35% ✓
- Cap rate
- 47.89%
- Cash-on-cash
- 148.56%
- DSCR
- 7.61
- GRM
- 1.6
CMA / ARV
- ARV (on-the-fly)
- $143,532
- Comps found
- 2
Show comp detail 2 sales within ~0.75 mi
| Address | Dist | Beds/Ba | Sqft | Sold | Price | $/sf | Match |
|---|---|---|---|---|---|---|---|
| 211 Dromedary St | 0.49mi | 3/1.0 | 1,460 (+10%) | 3mo | $157,000 | $108 | 54 |
| 178 Bray St | 0.72mi | 3/1.0 | 1,488 (+12%) | 7mo | $35,000 | $24 | 37 |
Match score weights: distance 35% · size 25% · config 20% · recency 20%. Top-matched comps best support the ARV.
Projected returns pro-forma
10.0% appreciation · 3.0% rent growth · sell at horizon
- IRR
- —
- Equity multiple
- 10.83×
- Total profit
- $110,143
- Equity at exit
- $36,034
- IRR
- —
- Equity multiple
- 23.77×
- Total profit
- $255,006
- Equity at exit
- $77,709
Cash invested: $11,200 (down + closing). Projections, not guarantees.
Landlord ↔ Tenant lean methodology
- Overall (STATE)
- 90 Strongly Landlord-Friendly
- State Georgia
- 90 Strongly Landlord-Friendly · R+3
- County
- — inherits STATE
- City
- — inherits STATE
ZIP-level market 30293
- Home prices YoY
- 14.5%
- Active inventory
- 22
- Price-to-rent
- 1.6×
Monthly cashflow live
- Estimated rent
- $2,141 medium interval (Pro) →
- Mortgage (P&I)
- −$210
- Tax from tax record
- −$79 /mo · $942/yr
- Insurance
- −$17
- HOA
- −$0
- Lot rent
- −$0
- Vacancy / Maint / Mgmt
- −$450
- Net cashflow
- $1,387
Break-even live
Sensitivity live
| Price | -10% $1,409 | -5% $1,398 | +0% $1,387 | +5% $1,375 | +10% $1,364 |
|---|---|---|---|---|---|
| Rent | -10% $1,217 | -5% $1,302 | +0% $1,387 | +5% $1,471 | +10% $1,556 |
| Rate | -1.0pp $1,407 | -0.5pp $1,397 | base $1,387 | +0.5pp $1,376 | +1.0pp $1,366 |
UW: 25.0% down · 7.5% · 30yr · 1.5% tax · 5.0% vac · 8.0% maint · 8.0% mgmt
Financing live
Cash to close
- Down payment
- $10,000
- Closing costs
- $1,200
- Reserves months
- —
- Total cash needed
- —
Loan-product check · same deal, 3 products live
Conventional
25% down · 7.5% · 30yr
- Down + closing
- —
- Monthly P&I
- —
- Monthly cashflow
- —
- DSCR
- —
- Eligible?
- —
Personal DTI + credit; lowest rate.
DSCR
20% down · 8.5% · 30yr
- Down + closing
- —
- Monthly P&I
- —
- Monthly cashflow
- —
- DSCR
- —
- Eligible?
- —
No personal income docs; deal must DSCR.
Hard money
10% down · 12.0% · 12mo
- Down + closing
- —
- Monthly P&I
- —
- Monthly cashflow
- —
- DSCR
- —
- Eligible?
- —
Short-term bridge; refi at stabilization.
Listing history 14 events
-
2026-06-22days on market $39,999 Active 18 DOM
-
2026-06-21days on market $39,999 Active 17 DOM
-
2026-06-19days on market $39,999 Active 15 DOM
-
2026-06-18statusdays on market $39,999 Active 14 DOM
-
2026-06-17days on market $39,999 New 13 DOM
-
2026-06-16days on market $39,999 New 12 DOM
-
2026-06-15days on market $39,999 New 11 DOM
-
2026-06-14days on market $39,999 New 9 DOM
-
2026-06-12days on market $39,999 New 8 DOM
-
2026-06-09days on market $39,999 New 5 DOM
-
2026-06-08days on market $39,999 New 4 DOM
-
2026-06-07days on market $39,999 New 3 DOM
-
2026-06-05remarks 699-char remark
-
2026-06-05$39,999 New 1 DOM
ⓘ Source: listings_history table (triggers on properties + properties_extension) + one-shot
backfill from property_details.listing_events for pre-trigger history.
Tax reassessment forecast GA · Resets to sale price
- Current annual tax
- $942 · $79/mo
- Projected year-2 tax
- $942 · $79/mo
- Expected delta
- $0/yr ($0/mo · 0.0%)
ⓘ Screening estimate from a state-policy table — verify with the county assessor before closing.
Climate risk First Street
- Flood 1/10 Low FEMA zone X (unshaded) · 0% chance over 30 yrs
- Wildfire 4/10 Moderate
- Heat 6/10 Major 7 d/yr ≥106°F today · 18 d/yr by 30 yrs out
- Wind 6/10 Major 57% chance of damaging wind over 30 yrs
- Air quality 2/10 Low 2 unhealthy d/yr today · 2 by 30 yrs out
Nearby sold comps map
Loading sold comps map…
Walkable amenities ~0.75 mi
Loading nearby amenities…
Taxation est. · year 1
- Rental income
- $25,693
- − Mortgage interest
- −$2,241
- − Property taxes
- −$942
- − Insurance
- −$200
- − Repairs & maintenance
- −$2,055
- − Management
- −$2,055
- − Depreciation
- −$1,164
- Taxable income
- $17,036
- Est. tax owed @ 24.0%
- −$4,089
- After-tax cash flow
- $12,550/yr
For passive investors: Depreciation is non-cash, so a rental often shows a tax loss while cash-flowing — sheltering income. Rental losses are passive: they offset passive income freely, and up to $25,000/yr can offset ordinary (W-2) income if you actively participate and your MAGI is under $100k (phasing out to $0 by $150k); unused losses carry forward. On sale, claimed depreciation is recaptured at up to 25%, and gains may owe capital-gains tax (a 1031 exchange can defer both). Figures are a year-1 estimate at your 24.0% rate — not tax advice; consult a CPA.
Schools (NCES district)
- District
- Meriwether County
- NCES district ID
- 1303630
- Math proficiency
- 18% ▼ -11.00%
- Reading proficiency
- 22% ▼ -6.00%
- Median HH income
- $36,287
- Composite
- 16.59/100
- National rank
- #9175
- State rank
- #144 of 174 in GA
Livability — Woodbury
- Score
- 58/100
- State rank
- #431
- US rank
- #20989
Category grades
Schools grade is shown separately in the Schools card above.
Census & demographics
- Census place
- Woodbury, GA
- Population (ZIP)
- 2,178
Population outlook (Meriwether County) Hauer SSP2
- Today (2025)
- 19,554 people
- By 2030
- 18,482 · -5.5%
- By 2040
- 16,204 · -17.1%
- By 2050
- 14,030 · -28.2%
- By 2075
- 9,539 · -51.2%
- By 2100
- 6,136 · -68.6%
Race, ethnicity, and origin ACS 2023
- Neighborhood character
- Majority White (61%)
- Race & ethnicity
- White 61% Black 36% Two or more races 3%
- Common ancestry
- Slovak 2% Serbian 1%
Political lean MEDSL · Meriwether
- 2024 margin
- Strong R (+25.5) · D 37.1% · R 62.6%
- 2008→2024 swing
- -20.0pp toward R · 2008: -5.4pp · 2024: -25.5pp
- All cycles
- 2024: R+25.5 2020: R+20.6 2016: R+15.4 2012: R+5.7 2008: R+5.4
Not yet ingested
- Civics
- —
Market trends
- HPI YoY
- ▲ 41.71%
- Current HPI
- 328.5122
- Rent YoY
- —
- Metro
- —
- State GDP YoY
- ▲ 2.66%
- F500 in state
- 28
Industry mix (Fortune 500 HQ in GA)
| Industry | F500 HQs | Revenue |
|---|---|---|
| Paper / Packaging | 2 | $29B |
|
||
| Retail | 1 | $160B |
|
||
| Transportation / Logistics | 1 | $91B |
|
||
| Airlines | 1 | $62B |
|
||
| Consumer Goods | 1 | $47B |
|
||
| Utilities | 1 | $25B |
|
||
Price history
1 event — show timeline
- 2026-06-04 Listed $39,999 GAMLS
Property tax history
+6.0%/yrLatest (2025): $942 · -0.1% YoY. Source: county tax records.
Cash-flow waterfall
monthlySold comps — $/sqft
last 12 mo · ≤1 miLoading sold comps…