5979 Campbell Hwy Hwy · Lynchburg, VA
Flood risk No data
- FEMA flood zone
- —
- Chance of flooding over 30 yrs
- —
- Est. flood insurance / yr
- —
Fire risk No data
- Est. fire insurance / yr
- —
Heat risk No data
- Hot days now (above threshold)
- —
- Hot days in 30 yrs
- —
Wind risk No data
- Chance of severe wind over 30 yrs
- —
Air-quality risk No data
- Unhealthy air days now
- —
- Unhealthy air days in 30 yrs
- —
Risk factors via First Street. Map © Google.
Why this score? — see what drove the B grade
The composite is a weighted blend of 9 inputs, each scored 0–100. Each bar is that input's sub-score; the figure is the points it added to the 100-point composite (weight × sub-score).
- Cash flow +30.0/30.0
- 1% rule +10.0/10.0
- DSCR +10.0/10.0
- ARV discount +7.5/15.0
- Schools +5.2/10.0
- Livability +4.5/5.0
- Rent growth +2.8/5.0
- Condition / age +2.5/5.0
- Appreciation +0.0/10.0
$88,000
🖨 Deal sheet 📄 Offer letter ✓ Due diligence
Listing remarks MLS
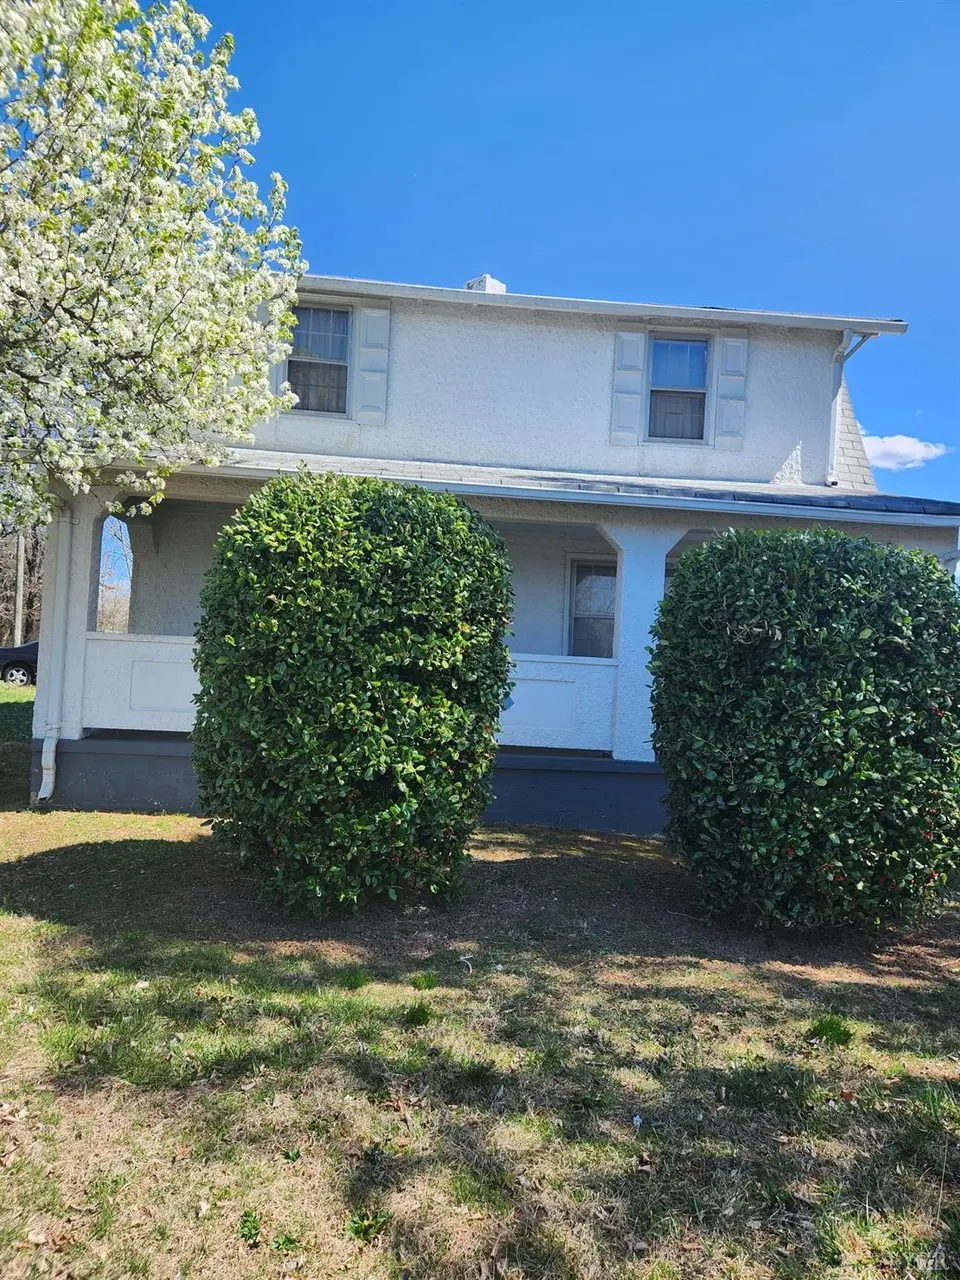
This house was physically moved back when Rt 501 changed and caused a decline in the foundation which is visible from outside and inside. The house has not been lived in for some years and all the floors may not be safe to walk on. Proof of funds must be attached to all offers and offers are subject to Mortgage Co approval. An As Is Addendum must also be attached as well as a short sell addendum.
Key facts
- 0.48 acre lot
- Built 1940
- Listed 44 days
Neighborhood map
What this means for you Summary
Snapshot
- This is a 3-bed/1.0-bath single-family listed at $88k.
Deal economics
- At list price, monthly cash flow is $697 ($8k/yr) — positive.
- The deal already cash-flows at list — no discount required.
- Meets the 1% rule at list price ($2k rent vs $88k).
- Recommended offer: $85k (3.0% below list) — sets the bar for market timing.
- Cap rate 15.8% vs local median 4.0% in Lynchburg — top-decile yield for the area; either an underpriced asset or a hidden risk that comps aren't pricing in. Stress-test before assuming the spread holds.
Location & tenants
- Location reads 91/100 on livability (#1 in VA, #58 nationally) — a professional / high-income tenant draw. Strengths: amenities A+, commute A+, cost of living A+; Watch: crime C-, employment D+.
- Campbell County Public School District (rural): math 55% / reading 68% proficiency, ranked #55 of 131 in VA (top 42%) — acceptable for families but not a draw, mixed tenant base, ~2y average lease.
- Market conditions: Rents rising (+1.1%/yr); 216 active listings in the ZIP; lower-income renter base — watch delinquency; 315 units permitted in Campbell County in 2024 (51 in 5+ unit buildings).
- This rent runs 44% of the median local income ($42k/yr) — at the standard rent-burdened threshold; future hikes will face affordability resistance.
Forward outlook
- Local home prices are declining (-3.0%/yr); year-one equity from $608 of loan paydown is wiped out by about $3k of value loss. Plan a longer hold.
- Campbell County population projected to shrink 6% by 2050 — rents likely to lag national; underwrite the cash flow, not the appreciation.
- At projected returns (-3.0% appreciation + 1.1% rent growth), your $25k cash investment doubles in ~4 years — after that, you're playing with house money.
Negotiation context
- It's been on market 44 days — a 3% lower offer ($85k) is reasonable based on typical stale-listing flexibility.
Risks & watch-outs
- Watch-outs: built in 1940 — expect roof / HVAC / electrical / plumbing capex.
Questions for the listing agent
- It's been on market 44 days. Have you received any prior offers? Is the seller open to a 3% concession, seller financing, or rate buy-down credit?
- Built in 1940 — when were the roof, HVAC, electrical panel, plumbing, and water heater last replaced?
- Is there a deadline driving the sale (1031 exchange, divorce, estate, relocation)? That informs how much negotiation room exists.
- Schools are A-rated — typically a magnet for longer-tenancy family renters. What's the average tenant stay here, and is there a school-zone premium baked into asking?
- What's the average days-on-market for RENTAL listings here right now (not sales)? A rising rental-DOM trend means longer vacancies and softer asking-rent achievability than the comps imply.
- What's the recent tenant-quality profile in this submarket — average credit score on applications, eviction rate, late-payment / NSF rate, and stable-employment percentage? A property-management company in the area should have these aggregated.
- How much new for-sale + rental construction is in the pipeline within 1–3 miles? Heavy new supply typically softens prices + rents 12–24 months out; constrained supply supports both.
Investment metrics
- 1% rule
- 1.76% ✓
- Cap rate
- 15.80%
- Cash-on-cash
- 33.95%
- DSCR
- 2.51
- GRM
- 4.7
CMA / ARV
- ARV (median comp)
- $197,070
- List price
- $88,000
- Delta
- -55.35%
- Verdict
- UNDERPRICED
- Comps
- 12 within 1.0 mi
Show comp detail 1 sale within ~0.75 mi
| Address | Dist | Beds/Ba | Sqft | Sold | Price | $/sf | Match |
|---|---|---|---|---|---|---|---|
| 233 Bocock Rd | 0.18mi | 3/2.0 | 1,458 (-6%) | 15mo | $340,000 | $233 | 65 |
Match score weights: distance 35% · size 25% · config 20% · recency 20%. Top-matched comps best support the ARV.
Projected returns pro-forma
-3.0% appreciation · 1.15% rent growth · sell at horizon
- IRR
- 27.3%
- Equity multiple
- 2.11×
- Total profit
- $27,271
- Equity at exit
- $13,121
- IRR
- 33.8%
- Equity multiple
- 3.82×
- Total profit
- $69,590
- Equity at exit
- $7,609
Cash invested: $24,640 (down + closing). Projections, not guarantees.
Landlord ↔ Tenant lean methodology
- Overall (STATE)
- 55 Moderately Landlord-Leaning
- State Virginia
- 55 Moderately Landlord-Leaning · D+2
- County
- — inherits STATE
- City
- — inherits STATE
ZIP-level market 24501
- Rents YoY
- 1.1%
- Active inventory
- 216
- Price-to-rent
- 4.7×
Monthly cashflow live
- Estimated rent
- $1,553 medium interval (Pro) →
- Mortgage (P&I)
- −$461
- Tax from tax record
- −$31 /mo · $377/yr
- Insurance
- −$37
- HOA
- −$0
- Vacancy / Maint / Mgmt
- −$326
- Net cashflow
- $697
Break-even live
UW: 25.0% down · 7.5% · 30yr · 1.5% tax · 5.0% vac · 8.0% maint · 8.0% mgmt
Financing live
Cash to close
- Down payment
- $22,000
- Closing costs
- $2,640
- Reserves months
- —
- Total cash needed
- —
Loan-product check · same deal, 3 products live
Conventional
25% down · 7.5% · 30yr
- Down + closing
- —
- Monthly P&I
- —
- Monthly cashflow
- —
- DSCR
- —
- Eligible?
- —
Personal DTI + credit; lowest rate.
DSCR
20% down · 8.5% · 30yr
- Down + closing
- —
- Monthly P&I
- —
- Monthly cashflow
- —
- DSCR
- —
- Eligible?
- —
No personal income docs; deal must DSCR.
Hard money
10% down · 12.0% · 12mo
- Down + closing
- —
- Monthly P&I
- —
- Monthly cashflow
- —
- DSCR
- —
- Eligible?
- —
Short-term bridge; refi at stabilization.
Listing history 2 events
-
2026-05-07status Pending 399-char remark
Show marketing remark (399 chars)
This house was physically moved back when Rt 501 changed and caused a decline in the foundation which is visible from outside and inside. The house has not been lived in for some years and all the floors may not be safe to walk on. Proof of funds must be attached to all offers and offers are subject to Mortgage Co approval. An As Is Addendum must also be attached as well as a short sell addendum.
-
2026-03-23$88,000 Active 399-char remark
Show marketing remark (399 chars)
This house was physically moved back when Rt 501 changed and caused a decline in the foundation which is visible from outside and inside. The house has not been lived in for some years and all the floors may not be safe to walk on. Proof of funds must be attached to all offers and offers are subject to Mortgage Co approval. An As Is Addendum must also be attached as well as a short sell addendum.
ⓘ Source: listings_history table (triggers on properties + properties_extension) + one-shot
backfill from property_details.listing_events for pre-trigger history.
Tax reassessment forecast VA · Resets to sale price
- Current annual tax
- $377 · $31/mo
- Projected year-2 tax
- $722 · $60/mo
- Expected delta
- +$345/yr (+$29/mo · 91.6%)
ⓘ Screening estimate from a state-policy table — verify with the county assessor before closing.
Nearby sold comps map
Loading sold comps map…
Walkable amenities ~0.75 mi
Loading nearby amenities…
Taxation est. · year 1
- Rental income
- $18,631
- − Mortgage interest
- −$4,929
- − Property taxes
- −$377
- − Insurance
- −$440
- − Repairs & maintenance
- −$1,490
- − Management
- −$1,490
- − Depreciation
- −$2,560
- Taxable income
- $7,344
- Est. tax owed @ 24.0%
- −$1,763
- After-tax cash flow
- $6,602/yr
For passive investors: Depreciation is non-cash, so a rental often shows a tax loss while cash-flowing — sheltering income. Rental losses are passive: they offset passive income freely, and up to $25,000/yr can offset ordinary (W-2) income if you actively participate and your MAGI is under $100k (phasing out to $0 by $150k); unused losses carry forward. On sale, claimed depreciation is recaptured at up to 25%, and gains may owe capital-gains tax (a 1031 exchange can defer both). Figures are a year-1 estimate at your 24.0% rate — not tax advice; consult a CPA.
Schools (NCES district)
- District
- Campbell County Public School District
- NCES district ID
- 5100600
- Math proficiency
- 55% ▼ -29.00%
- Reading proficiency
- 68% ▼ -11.00%
- Median HH income
- $45,915
- Composite
- 51.88/100
- National rank
- #1656
- State rank
- #55 of 131 in VA
Livability — Lynchburg
- Score
- 91/100
- State rank
- #1
- US rank
- #58
Category grades
Schools grade is shown separately in the Schools card above.
Census & demographics
- County
- Lynchburg City · 97,036 people
- City population
- 97,036
- Metro
- Lynchburg, VA
- Population (ZIP)
- 25,006
- Household income
- $42,222
- Rent vs Own
- Severe rent burden
- 1717.0
Population outlook (Campbell County) Hauer SSP2
- Today (2025)
- 56,306 people
- By 2030
- 56,366 · +0.1%
- By 2040
- 55,406 · -1.6%
- By 2050
- 53,011 · -5.9%
- By 2075
- 45,932 · -18.4%
- By 2100
- 36,029 · -36.0%
Race, ethnicity, and origin ACS 2023
- Neighborhood character
- Diverse neighborhood (Simpson 0.55)
- Race & ethnicity
- White 58% Black 34% Two or more races 4% Hispanic / Latino 3%
- Common ancestry
- Slovak 1% Italian 1% Serbian 1%
- Foreign-born
- 3% · Canada
- Languages at home
- 96% English-only · Spanish 2%
Political lean MEDSL · Campbell
- 2024 margin
- Solid R (+48.6) · D 25.3% · R 73.9%
- 2008→2024 swing
- -12.3pp toward R · 2008: -36.2pp · 2024: -48.6pp
- All cycles
- 2024: R+48.6 2020: R+44.1 2016: R+47.2 2012: R+39.4 2008: R+36.2
Not yet ingested
- Civics
- —
Market trends
- HPI YoY
- ▼ -131.06%
- Current HPI
- 223.6839
- Rent YoY
- ▲ 1.15%
- Metro
- Lynchburg, VA
- State GDP YoY
- ▲ 2.40%
- F500 in state
- 50
Industry mix (Fortune 500 HQ in VA)
| Industry | F500 HQs | Revenue |
|---|---|---|
| Aerospace / Defense | 4 | $236B |
|
||
| Technology / Defense | 3 | $32B |
|
||
| Financial Services | 2 | $176B |
|
||
| Utilities | 2 | $27B |
|
||
| Insurance | 2 | $25B |
|
||
| Technology | 2 | $15B |
|
||
Price history
2 events — show timeline
- 2026-05-07 Pending — LMLS
- 2026-03-23 Listed $88,000 LMLS
Property tax history
+1346.6%/yrLatest (2025): $377 · +0.0% YoY. Source: county tax records.
Cash-flow waterfall
monthlySold comps — $/sqft
last 12 mo · ≤1 miLoading sold comps…